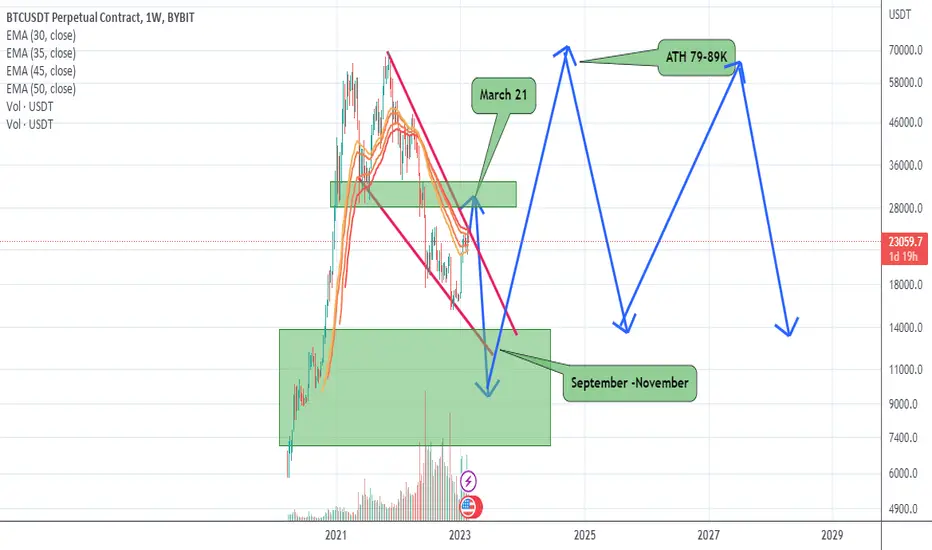
BTC-USDT TWO big FAKE OUTS before ATH. UNPOPULAR ANALYSIS.This Probable Path for BTC USD will play out for the next 8-9 months before a true bul run
Target below:
1st 15,000
2nd 13,500
3rd 11,000
4th 9,000
5th 7,000
6th 3,500
Upward Target after Hitting Lower values:
Final Target 79,000 to 89,000
then after the next bull run we go sideways with the range of 18,000 89,0000 for the next 10 years.
sending love to all.
Btcusdtoday
BTCUSD 5mins scalping long entryHello traders,
This is my second post today. Now we will look at COINBASE:BTCUSD . After waiting for a long time today, I finally missed the 5mins shorting opportunity as I was away from the system. But it met my profit target as I expected. But even if that opportunity is gone, now there is another opportunity to take a long entry from 24079.50 to 24291.00 . If this entry is suitable for you then analyze and get down to the long trade.
Trade according to your qualifications
Thanks & Regards,
Alpha Trading Station
Disclaimer: This view is for educational purpose only & any stock mentioned here should not be taken as a trading/investing advice. We may or may not have position in the stocks mentioned here. Please consult your financial advisor before investing. Because Price is the "King of Market".

MATIC Long!!KUCOIN:MATICUSDT
MATIC sitting in potential cup with breakout upside to 1.76 level possible 36%.
On rejection can short to pullback for re-entry ideas for long to breakout.
Better entry, retest of breakout level. Can look to enter on break and add to position on successful retest.
LTF analysis can provide pre-breakout opportunity but watch for 21 to catch structure.
MATIC news:
1. Doritos chips becomes latest brand to launch in metaverse with Polygon-based NFTs
Polygon’s growing adoption by mainstream corporate giants including Nike, Disney, Starbucks, Coca-Cola, Meta and Reddit.
If you liked this idea or if you have your own opinion about it, write in the comments.
The information and publications are not meant to be, and do not constitute, financial, investment, trading, or other types of advice or recommendations.

BTCUSD 30m Short sellingHello guys,
This is a very urgent trade. What are we going to see today is Bitcoin. COINBASE:BTCUSD is coming very fast to continue its resistance level . So speed is very important in this. This is an opportunity to short sell .
Trade safe!
Thanks & Regards,
Alpha Trading Station

#BTC UPDATE Hi guys, This is CryptoMojo, One of the most active trading view authors and fastest-growing communities.
Consider following me for the latest updates and Long /Short calls on almost every exchange.
I post short mid and long-term trade setups too.
Let’s get to the chart!
I have tried my best to bring the best possible outcome to this chart, Do not consider financial advice.
#BTC/USDT ANALYSIS
BTC is retesting over the descending channel and trading above the Ichimoku cloud. Volume is going in favor of bulls, as we can see in the current wave that bulls are still dominating.
BTC is taking a correction to balance the wave structure, and a strong bullish rally is expected just after the completion of the corrective wave.
This chart is likely to help you make better trade decisions if it does consider upvoting it.
I would also love to know your charts and views in the comment section.
Thank youvel of $21300.

BTC - Short strategyBYBIT:BTCUSDT.P
4h time frame
-
BTC did a pump after announcing CPI, but still faces the structural resistance (22350~22500)
According to last BTC analysis, we can set final TP at 20900 which is a nice support level to form an inverse HS.
-
Entry: 22350~22500
TP: 21200, 20900
SL: if successfully break up this DC(Descending channel)

Bitcoin BTC Next Expected move on 4H CHARTHello guyz!!
Bitcoin currently trading now at 22889$.
from last 5 days bitcoin trading.... in a down trend.
bitcoin bounce back expected from 224000$ ( if you want open trade in long at this price)
if bitcoin brok 22400$ support then possible we see bitcoin price at 21100$ ( soo manage trade in proper way)
CURRENTLY.... rsi indicator is bearish on 4H time fram chart.
and macd indicator bearish toon on 4H tf.
do trade at your own risk.
follow me for mor more updates.

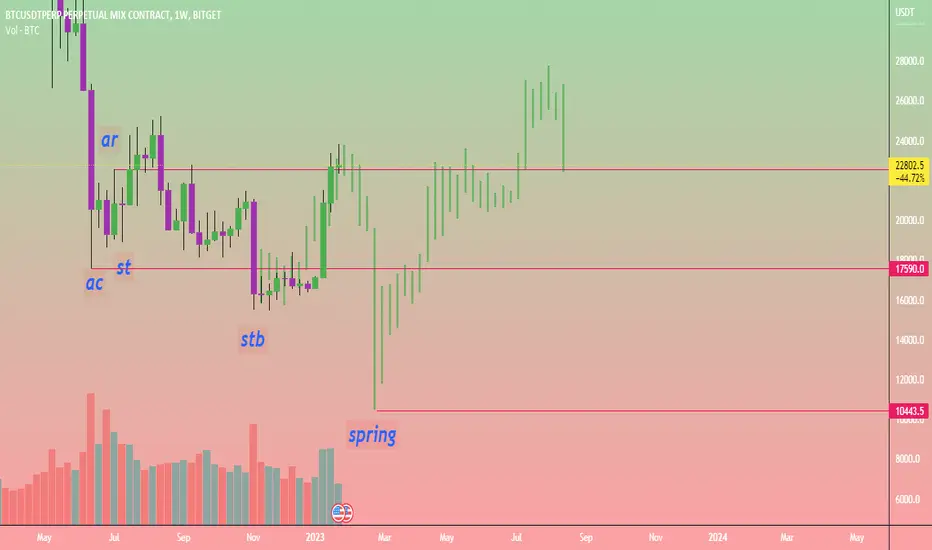
Btcusdt forming its Accumulation 1 s last phase 10k next MoveBtcusdt forming its Accumulation 1 s last phase 10k next Move
btcusdt will complete its remaing phase on weekly timeframe
spring area ll be our Bottom for next Bull Run...
upcoming Crash on Weekly Timeframe ..
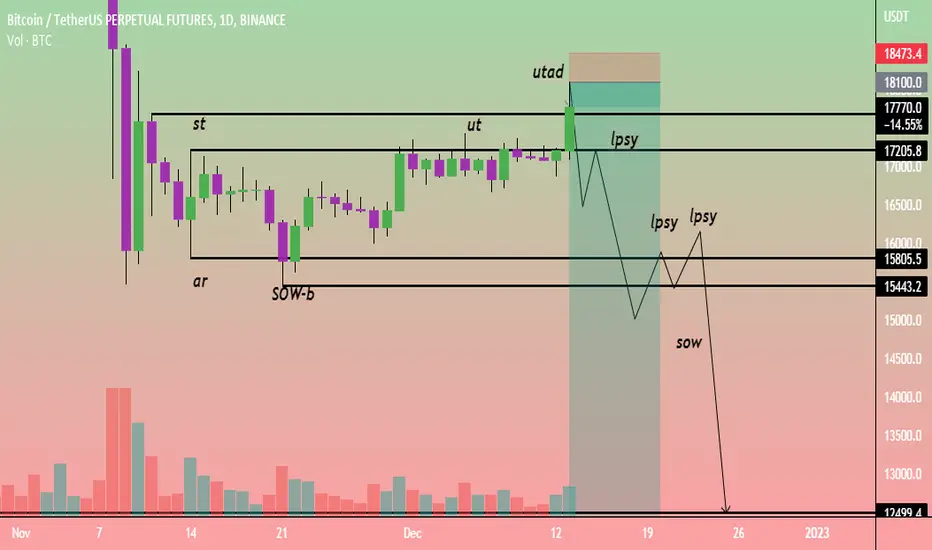
btcusdt Distribution on 1 hour Time frame Btcust before and after on 1 hour timeframe my Analysis yesterday Night
btcusdt Distribution on 1 hour Time frame perfectly going on my lines
Btcust before and after on 1 hour timeframe my Analysis yesterday Night
#BTC #BTCUSDT #Bitcoin #BNB #Binance #CZBinance #BinanceSmartChain

BTCUSDT LONG SIGNAL!!!!Hi, friends. Nice to meet you.
The beat is supported by an important support line, of course, a long RBI!!!

BTCUSDT LONG!!!!Hi, friends. Nice to meet you.
The beat's on the trend line. We're retesting.
It's a long RBI right now!

#BTC BREKOUT BULLISH FLAG PATTERN!Hi guys, This is CryptoMojo, One of the most active trading view authors and fastest-growing communities.
Consider following me for the latest updates and Long /Short calls on almost every exchange.
I post short mid and long-term trade setups too.
Let’s get to the chart!
I have tried my best to bring the best possible outcome to this chart, Do not consider financial advice.
#BTC
In the shorter time frame, BTC breakout this bullish flag pattern add retested it also according to the pattern Tactically we can expect a 10% bounce.
We have 21, 500 as strong resistance
Let’s see how the market reacts in a few hours.
Analysis in the higher time frame
- I have taken fractals from the past, 2019, from historical price action that we refer to as an 'echo bubble'.
- According to the fractals, one possible scenario is that we tap $14k, before making a 100% move up to $28k.
- This would be a completely reasonable trajectory to have in mind, considering that we have seen a case for Bitcoin moving from $4k to $14k
- Eventually, we would peak around the summer of 2023, with everyone thinking that the macro bull market has resumed.
- Personally, if this speculative scenario plays out, I would revert back to holding a massive cash position until the dust settles again.
- People, including myself, thought we'd never get back below 20k, and here we are now, with people calling for $7k.
Comment your view in the comment section and stay tuned, I will keep updating BTC in the different time frames.
This chart is likely to help you make better trade decisions if it does consider upvoting it.
I would also love to know your charts and views in the comment section.
Thank you

#BTC is not looking good in the shorter time frame!Hi guys, This is CryptoMojo, One of the most active trading view authors and fastest-growing communities.
Consider following me for the latest updates and Long /Short calls on almost every exchange.
I post short mid and long-term trade setups too.
Let’s get to the chart!
I have tried my best to bring the best possible outcome to this chart, Do not consider financial advice.
#BTC UPDATE
BTC is making this bearish pennant pattern.
BTC doesn't look good, According to the pattern if BTC did a break down then BTC can drop 10% after the confirmed retest.
We have 16.5k and 15.5k as support
If BTC breaks out this upper resistance then the pattern will be invalidated.
Stay tuned I will keep updating
This chart is likely to help you make better trade decisions if it does consider upvoting it.
I would also love to know your charts and views in the comment section.
Thank you

#BTC Be Patient, Big things Take time Hi guys, This is CryptoMojo, One of the most active trading view authors and fastest-growing communities.
Consider following me for the latest updates and Long /Short calls on almost every exchange.
I post short mid and long-term trade setups too.
Let’s get to the chart!
I have tried my best to bring the best possible outcome to this chart, Do not consider financial advice.
#Bitcoin Long Term Technical Analysis:-
In this weekly time frame, BTC is trading inside this expanding triangle pattern and is currently at the lower level of this pattern.
Which is at 1428D long Strong support also BTC must hold this level. If BTC breaks down to this level then $11k to $12k is the next stopping point.
I am accumulating BTC in this range and what if BTC drop towards 11k to 12k then I will buy more, no one can catch the accurate bottom.
TARGET:- 73k, 90k, 150k,
This is not a piece of financial advice.
(DYOR)
This chart is likely to help you make better trade decisions if it does consider upvoting it.
I would also love to know your charts and views in the comment section.
Thank you

BTCUSDT 4h LONG ANALYSISHi, friends. Nice to meet you
I sincerely support your successful sales
Hi, friends. Nice to meet you
I sincerely support your successful sales
Look at the current Tether Dominance, which is expected to go down further after a retest in a strong resistance section
Then the btc and alt will go up the other way, right?
I think if btc can break through 18k, it can go to 18.3k, which is the most important can in a week
That's it for today. See you next time

btcusdt dayly timeframe bearish wyckoff distribution foundbtcusdt dayly timeframe bearish wyckoff distribution found
dyor
learning purpose
#BTC is not looking good in the shorter time frame!Hi guys, This is CryptoMojo, One of the most active trading view authors and fastest-growing communities.
Consider following me for the latest updates and Long /Short calls on almost every exchange.
I post short mid and long-term trade setups too.
Let’s get to the chart!
I have tried my best to bring the best possible outcome to this chart, Do not consider financial advice.
#BTC UPDATE
BTC breakout this rising wages pattern and currently retesting it.
BTC doesn't look good, According to the pattern BTC can drop 10% after the confirm retest.
If BTC breaks out this lower resistance then the pattern will be invalidated.
Stay tuned I will keep updating
This chart is likely to help you make better trade decisions if it does consider upvoting it.
I would also love to know your charts and views in the comment section.
Thank you

BTC/USDTHey everyone, this is my analysis for BTC there's huge liquidity below this trend line I shared each and everything in the chart its price goes up from the D leg, so don't panic that will be just a liquidity wick and make trend lines just for that.
Good luck everyone.
#Bitcoinanalysis #btc

#BTC is getting ready for the Big move!!Hi guys, This is CryptoMojo, One of the most active trading view authors and fastest-growing communities.
Consider following me for the latest updates and Long /Short calls on almost every exchange.
I post short mid and long-term trade setups too.
Let’s get to the chart!
I have tried my best to bring the best possible outcome to this chart, Do not consider financial advice.
#BTC UPDATE
BTC is forming this big falling wedge pattern
what is falling wedge pattern
The falling wedge is a bullish pattern. Together with the rising wedge formation, these two create a powerful pattern that signals a change in the trend direction. In general, a falling wedge pattern is considered to be a reversal pattern, although there are examples when it facilitates a continuation of the same trend.
*BTC Need to Clear the 18,500 Resistance to Confirm the Falling Wedge Breakout
* RSI is also sowing some bullish divergences move
*If it conform this pattern then according to the pattern we will see good bounce
Stay tuned I will keep updating
This chart is likely to help you make better trade decisions if it does consider upvoting it.
I would also love to know your charts and views in the comment section.
Thank you


BTCUSDT analysis crypto 28/11/2022Market respect our yellow correction LVL for the yellow sequence , also the market interact with the green correction LVL for the bearish green sequence , we will keep waiting the market for setting the bullish way for trading

#BTC UPDATE Hi guys, This is CryptoMojo, One of the most active trading view authors and fastest-growing communities.
Consider following me for the latest updates and Long /Short calls on almost every exchange.
I post short mid and long-term trade setups too.
Let’s get to the chart!
I have tried my best to bring the best possible outcome to this chart, Do not consider financial advice.
#BTC UPDATE
BTC break down this descending triangle pattern
What is a descending triangle pattern?
The classic version of this pattern forms a trend line that is sloping and a flat or horizontal support line. The pattern emerges as the price bounces off the support level at least twice. The completion of the pattern occurs after the end of a retracement in a downtrend.
The downside breakout from the support triggers a strong bearish momentum-led decline.
However, this textbook pattern seldom occurs in real markets. In most cases, a descending triangle pattern can also see a sloping base as well. Instead of a flat support level, you can see higher lows being formed.
The illustration below shows what an “ideal” descending triangle pattern looks like, which is often labelled a descending wedge, as well.
In my last update, I mention the 17.5k horizontal support, after that post, BTC Bounced from that support
Currently, it breakout the descending triangle with a successful retest and heads toward the horizontal resistance which is around 17k.
A solid breakout of $17k would be the confirmation of the continuation of bullish momentum in the market, while a rejection will result in further range play.
Stay tuned I will keep updating.
This chart is likely to help you make better trade decisions if it does consider upvoting it.
I would also love to know your charts and views in the comment section.
Thank you

Bitcoin Prediction H1Here is my view for BTCUSD on H1. The price could go down, you can put a pending order on the Order block or find an entry on LTF within OB Zone. Trade Safe!
