BTCUSDT SHORT M15At the moment, the BTCUSDT trading pair is experiencing a distribution moment. Taking into account the liquidity collected at the top, I open a position in SHORT from the POI and FGV m15 I indicated with the target:
80,607.65$
79,058.00$
76,606.00$
Risk for stop order -1%
BTCUSDTPERP

Is the #BTC downtrend over?📊 Is the #BTC downtrend over?
🧠From a structural perspective, the current rally is over. If we want to reverse the daily downtrend, we need to build a bullish structure of the same cycle. That is to say, we can only remain optimistic if we succeed in standing above 84,500.
➡️If we continue to break below the low L: 76,562, the next support area worth our attention is 69,000-72,000
Let's see👀
🤜If you like my analysis, please like💖 and share💬
BITGET:BTCUSDT.P

BTCUSD buy signal. Don't forget about stop-loss.
Write in the comments all your questions and instruments analysis of which you want to see.
Friends, push the like button, write a comment, and share with your mates - that would be the best THANK YOU.
P.S. I personally will open entry if the price will show it according to my strategy.
Always make your analysis before a trade

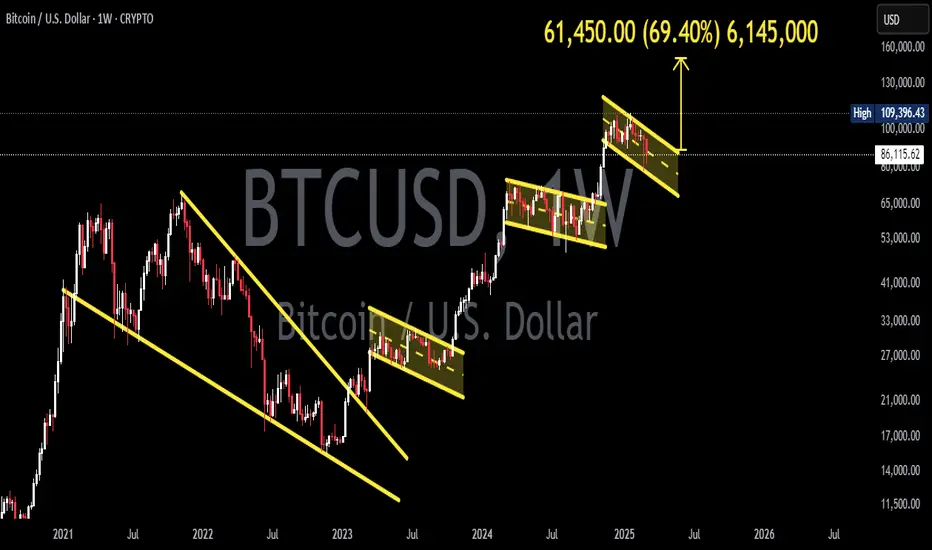
BTCUSDT 1WBTC ~ 1W Analysis
#BTC We hope Bitcoin does not damage this bullish structure. Or everything will get worse.

BTCUSDT TRADING POINT UPDATE >READ THE CHAPTIANSMC Trading Signals Update 🗾🗺️ crypto Traders SMC-Trading Point update you on New technical analysis setup for crypto BTC USDT. ) crypto Traders BTC USD ) list time post signals 🚀 Hit sucksfully My target point ) Now update on New analysis setup. BTC USDT still drop 💧. Trend 📉. Technical patterns FVG) 85k. Back down trand target point 78k.
Key Resistance level 85k
Key Support level 81k- 78k
Mr SMC Trading point
Pales support boost 🚀 analysis follow)

There are no failed investments, only failed operationsI. Trend analysis
🔹 overall trends:
Since the beginning of 2024, Bitcoin has experienced a clear upward trend, peaking at nearly $115,000.
The price has recently fallen below several key support levels and entered a downward trend, with prices testing support in the 80,000-85,000 range.
The short-term trend remains weak, and the market may continue to seek lower support levels.
🔹 moving average system:
The short-term moving average (red, 10th) indicating that the market is still dominated by short-term bears.
The long-term moving average (blue, 60 days) has also started to turn downward, suggesting a weakening of the medium-term trend.
Conclusion: The market is still in a downward trend, and the moving average system shows no obvious signs of stabilization.
Structural analysis (K-line morphology)
📌 head and shoulders may have been completed:
From the high level formed by 93,000 to 115,000, there is a more obvious head and shoulder structure, which is currently falling below the neckline (82,000) and accelerating the decline.
If this pattern holds, the target decline level may test the 77,000-80,000 area.
📌 M head shape:
The previous two highs (around 100,000) formed an M-head and fell below key support, remaining weak in the short term.
📌 support area:
77000 (important support, if broken, the medium-term trend may accelerate to short)
72000~ 75000 (target in extreme cases)
📌 resistance areas:
89000~ 90000 (early neckline, has turned to strong resistance)
93000 (if the market rebounds, it needs to break through this level to reverse the trend)

Bitcoin Collapses $80K, What’s Next?Its price briefly stabilized around $86K over the weekend before heading south at the start of the business week. It dropped to around $80K, leaving millions in liquidations on a 24-hour basis. Later, bulls stepped in and pushed the valuation to nearly $84K. The resurgence, however, was short-lived and was followed by another free fall to as low as $79,500. As of this writing, BTC is trading around $79,000, representing a 5% drop on the day. Its market cap dropped below $1.6 trillion.
While many industry players are hopeful that this is another temporary pullback that can be replaced by a new bull run, others are not so optimistic. Next up is a re-estimation of $78K for BTCUSD, “if that fails, the next $76300, 75,500 in the crosshairs.” BINANCE:BTCUSDT BITSTAMP:BTCUSD COINBASE:BTCUSD BYBIT:BTCUSDT.P

#BTC reaches target zone📊#BTC reaches target zone✔️
🧠The weekly close is below the grey zone, so this zone has turned into the blue resistance zone (W).
➡️From a structural point of view, we have reached the support line and the target zone of the small bearish structure is also here, so don't chase the short here, if the price can rebound to the blue resistance zone or the lower edge of the triangle again, then you can try to participate in some short trades.
Let's see👀
🤜If you like my analysis, please like💖 and share💬
BITGET:BTCUSDT.P

#BTC Descending Triangle📊#BTC Descending Triangle📉
🧠From a graphical perspective, we broke below the lower edge of the triangle, so we need to be wary of further declines.
➡️From a structural perspective, we broke below the support zone (84000-86000), so support turned into resistance. If the price returns to this area again, consider participating in some short trades.
Let's see👀
🤜If you like my analysis, please like💖 and share💬
BITGET:BTCUSDT.P

Ready for 95k?BTC biasness has changed and as mentioned, nPoC test is what you would want, Aiming for 93k and 95k in near terms!

BTCUSDT TRADING POINT UPDATE >READ THE CHAPTIAN Buddy's dear friend 👋
SMC Trading Signals Update 🗾🗺️ crypto Traders SMC-Trading Point update you on New technical analysis setup for crypto BTC USDT BTC still rejected supply zone. Again. Back Short Trade. FVG level) 83k I'm want to Sell now short trend 📈
Key Resistance level 93k + 95k
Key Support level 85k - 83k
Mr SMC Trading point
Pales support boost 🚀 analysis follow)

BTC/USD Ready for a BIG DROP? Next Target: Demand Zone!Bitcoin Showing Weakness – Smart Money Preparing a Move!
BTC/USD is struggling to hold key resistance levels, signaling potential distribution before a larger sell-off. Institutional players have grabbed liquidity, and a Break of Structure (BOS) to the downside confirms bearish momentum.

BTCUSDT 1WBTC ~ 1W Analysis
#BTC Expect good news to continue this pattern of increase. Maybe the next few weeks.
#BTC complex consolidation phase📊#BTC complex consolidation phase📊
🧠It is approaching the weekend, and the price is still running below the gray range. If the closing price this week is below the gray range, then the gray range will completely turn into the blue resistance zone, which is not a good signal, which means that the probability of further decline will increase.
➡️From a structural point of view, if we fall below the rising support line and the yellow support zone (84000-86000) and do not recover quickly, it means that we will fall further. 📉
Let's see👀
🤜If you like my analysis, please like💖 and share💬
BITGET:BTCUSDT.P

Elliot Wave, Market Stru. Premium/Discount , Liquidity BTC/USDT Please respect others Analysis, Some are good some are trying to be good,
We used Elliot wave for directional shift
MS for top down analysis.
liquidity zones for precision
please review this analysis

BITCOIN MAIN SHORT AREA – BE CAREFUL!🚨 BITCOIN MAIN SHORT AREA – BE CAREFUL! 🚨
“This isn’t just any level—this is the main short zone. Smart traders don’t rush; we wait for clear confirmations and strike with precision!”
🔥 Key Game Plan:
15M Downside Breakouts Required – We’re watching for clear market structure shifts before entering.
CDV Must Confirm – No CDV support for the short? No trade. We need sellers stepping in with conviction.
Stop Loss at $99,500 – Risk management is key. No guessing, no emotions.
Sniper Entry? $98,000 is a Solid Level – If we get there with confirmation, it could be an elite short.
💡 Final Thoughts:
“Patience is what separates pros from amateurs. If we get the breakdown + CDV confirmation, this trade could be beautiful. If not, we step aside and wait for the next A+ setup.”
📉 Stay sharp, execute with confidence! 🔥
Let me tell you, this is something special. These insights, these setups—they’re not just good; they’re game-changers. I've spent years refining my approach, and the results speak for themselves. People are always asking, "How do you spot these opportunities?" It’s simple: experience, clarity, and a focus on high-probability moves.
Want to know how I use heatmaps, cumulative volume delta, and volume footprint techniques to find demand zones with precision? I’m happy to share—just send me a message. No cost, no catch. I believe in helping people make smarter decisions.
Here are some of my recent analyses. Each one highlights key opportunities:
🚀 RENDERUSDT: Strategic Support Zones at the Blue Boxes +%45 Reaction
🎯 PUNDIXUSDT: Huge Opportunity | 250% Volume Spike - %60 Reaction Sniper Entry
🌐 CryptoMarkets TOTAL2: Support Zone
🚀 GMTUSDT: %35 FAST REJECTION FROM THE RED BOX
🎯 DEXEUSDT %180 Reaction with %9 Stop
🐶 DOGEUSDT.P: Next Move
💎 ETHUSDT.P: Where to Retrace
🟢 BNBUSDT.P: Potential Surge
📊 BTC Dominance: Reaction Zone
🌊 WAVESUSDT.P: Demand Zone Potential
🟣 UNIUSDT.P: Long-Term Trade
🔵 XRPUSDT.P: Entry Zones
🔗 LINKUSDT.P: Follow The River
📈 BTCUSDT.P: Two Key Demand Zones
🟩 POLUSDT: Bullish Momentum
🌟 PENDLEUSDT.P: Where Opportunity Meets Precision
🔥 BTCUSDT.P: Liquidation of Highly Leveraged Longs
🌊 SOLUSDT.P: SOL's Dip - Your Opportunity
🐸 1000PEPEUSDT.P: Prime Bounce Zone Unlocked
🚀 ETHUSDT.P: Set to Explode - Don't Miss This Game Changer
🤖 IQUSDT: Smart Plan
⚡️ PONDUSDT: A Trade Not Taken Is Better Than a Losing One
💼 STMXUSDT: 2 Buying Areas
🐢 TURBOUSDT: Buy Zones and Buyer Presence
🌍 ICPUSDT.P: Massive Upside Potential | Check the Trade Update For Seeing Results
🟠 IDEXUSDT: Spot Buy Area | %26 Profit if You Trade with MSB
📌 USUALUSDT: Buyers Are Active + %70 Profit in Total
🌟 FORTHUSDT: Sniper Entry +%26 Reaction
🐳 QKCUSDT: Sniper Entry +%57 Reaction
📊 BTC.D: Retest of Key Area Highly Likely
This list? It’s just a small piece of what I’ve been working on. There’s so much more. Go check my profile, see the results for yourself. My goal is simple: provide value and help you win. If you’ve got questions, I’ve got answers. Let’s get to work!

BTCUSDT 1WBTC ~ 1W Analysis
#BTC We hope there will be a lot of good news after this dips. To support the next increase to the top of Elliot Wave 5.

#BTC support turns into resistance, cautiously bullish 📊#BTC support turns into resistance, cautiously bullish ⚠️
🧠Due to the turbulence of the international situation, it has gradually fed back to the investment market, so recent transactions will become more difficult, so we should choose to observe and wait for the right opportunity to appear.
➡️From a structural point of view, we did not stabilize in the support area of 84000-86000, but continued to fall below this area, so this support area turned into a resistance area, and the resistance area cannot be bullish.
➡️If the price stabilizes near the support line 79524, then if the target area of this support structure overlaps with the blue resistance area, then you can consider participating in some short transactions.
Let's take a look👀
🤜If you like my analysis, please like💖 and share💬 BITGET:BTCUSDT.P

#BTC Downtrend Ended?📊#BTC Downtrend Ended?
🧠From a structural perspective, the risk of further decline has not been lifted, because the short structure at the daily level is still intact and the downward trend line has not been effectively broken, so the next period of time is likely to be dominated by complex consolidation.
➡️If we can successfully break through the inflection point 99425 or the downward trend line, it means that the short structure is broken, and we can find the right opportunity to actively participate in long-long transactions in the subsequent callback, otherwise we still need to be vigilant about the risk of further decline.
Let's see 👀
🤜If you like my analysis, please like 💖 and share 💬
BITGET:BTCUSDT.P

Bitcoin RSI Dips Below 30 Again!The above chart highlights Bitcoin's price action alongside the Relative Strength Index (RSI) on a daily timeframe. Historically, every time the RSI dropped below 30, indicating oversold conditions, Bitcoin experienced a price bounce shortly after. The chart marks these moments with blue circles and green arrows, showing clear upward reversals following each dip. Currently, Bitcoin's RSI has once again fallen below 30, with the price around $87,000 after a sharp 10% drop. If past patterns hold true, this could signal an upcoming bullish reversal.

#BTC Bearish Head and Shoulders📊#BTC Bearish Head and Shoulders📉
🧠From a structural perspective, we are currently in the blue resistance zone and have formed a bearish head and shoulders structure, so we need to be wary of the risk of a pullback.
➡️If the price breaks through the inflection point 86516 again, it means that the blue resistance has turned into a support zone. If we can stabilize in this area, a bullish cup and handle structure will be formed, and we can participate in some long trades according to this structure.
Let's see👀
🤜If you like my analysis, please like💖 and share💬
BITGET:BTCUSDT.P

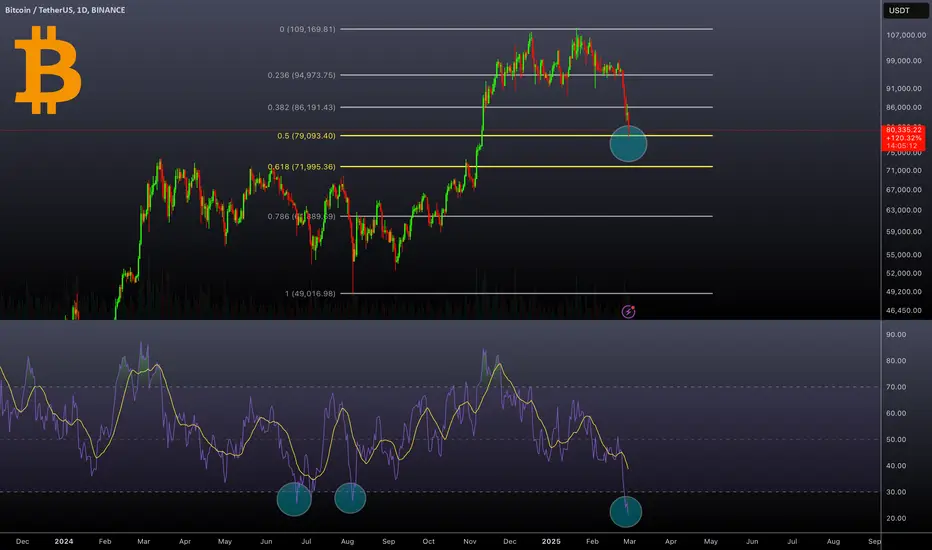
Bitcoin- Fibonacci Retest and Oversold RSIBitcoin's daily chart shows a significant price retracement, currently testing the key 0.5 Fibonacci level around $79,000. This level historically acts as a strong support zone during corrective phases. If BTC holds above this level, it could signal a potential rebound. However, if it breaks lower, the next major support is near $72,000 (0.618 Fibonacci level).
Additionally, the Relative Strength Index (RSI) has dropped to the 20 level, indicating extreme oversold conditions. Historically, such low RSI readings have led to strong reversals. If buying pressure emerges, BTC could see a recovery from these levels.
Regards
Hexa
BTCUSDT 1WBTC ~ 1W Analysis
#BTC It's hard to say this, but this is the end.
We are still sure bullish isn't over yet.
