BTCUSDT: Your Next Move? The Blue Box OpportunityAlright, focusing on BTCUSDT. This blue box is a critical buying zone.
The market's recent moves demand clarity. You need to know where genuine opportunity lies, avoiding the traps that catch most traders.
I've identified this blue box as a prime area where demand could ignite. But don't just jump in. Here's the plan:
Watch the Volume Footprint: Is there real accumulation, or just noise?
Spot CDV Divergences: Hidden strength often appears here, even if price looks weak.
Confirm on LTF: A clear breakout above minor resistance, followed by a retest as support, is your green light.
Be vigilant for liquidity hunts – those quick dips that shake out weak hands before a real move. If this blue box holds, and we get these confirmations, my bias is firmly upwards.
I only focus on assets with sudden, significant volume increases. BTCUSDT's current setup, combined with this potential volume, makes it a high-interest play.
Keep a very close eye on this blue box. Understanding these subtle signals means you can navigate these intricate dynamics, securing your position for potential gains. Miss this, and you might regret it.
📌I keep my charts clean and simple because I believe clarity leads to better decisions.
📌My approach is built on years of experience and a solid track record. I don’t claim to know it all but I’m confident in my ability to spot high-probability setups.
📌If you would like to learn how to use the heatmap, cumulative volume delta and volume footprint techniques that I use to determine very accurate demand regions, you can send me a private message. I help anyone who wants it completely free of charge.
🔑 On my profile, you can find an extensive track record spanning hundreds of analyses and many examples of my strategies in action. To keep things concise here, I'm sharing just a few of my most recent successful calls as a small snapshot of my ongoing work:
📊 FLOKIUSDT - +%100 From Blue Box!
📊 TRXUSDT - I Do My Thing Again
📊 OGNUSDT | One of Today’s Highest Volume Gainers – +32.44%
📊 TIAUSDT | Still No Buyers—Maintaining a Bearish Outlook
📊 Simple Red Box, Extraordinary Results
Feel free to check out my TradingView profile for all of them; listing everything here would genuinely take too long! 😉
BTCUSDTPERP

BTC Bears Eye 100000 Break; Short at 107000 -108000 ResistanceBTC's downward movement failed to break through 100,000📉, but there is a clear downward trend, and breaking below 100,000 is only a matter of time⏳. In the short term, shorting at high levels can be considered📉. The upward resistance currently has difficulty breaking through 110,000🚧, and shorting can now be considered in the resistance range of 107,000-108,000📉
⚡️⚡️⚡️ BTCUSD ⚡️⚡️⚡️
🚀 Sell@ 107000 - 106000
🚀 TP 102000 - 98000
Accurate signals are updated every day 📈 If you encounter any problems during trading, these signals can serve as your reliable guide 🧭 Feel free to refer to them! I sincerely hope they'll be of great help to you 🌟 👇

Is the #BTC rally over?📊 Is the #BTC rally over?
🧠From a structural perspective, we have reached the ideal target zone of the double top bearish structure, so a strong rebound is very reasonable. The realization of the ideal target zone means that the previous decline has ended. We need to change our thinking and stop being too bearish. Stay cautious!
➡️At the same time, the goals of the long structure we built in the support area have also been fully achieved, and this period of rise has reached the lower edge of the extended wedge + the downward trend line + the blue resistance area very quickly, so there is a possibility of a pullback, so don’t chase the rise here. If you want to participate in long transactions, we should pay attention to the opportunities after the pullback.
Let’s see👀
🤜If you like my analysis, please like💖 and share💬
BITGET:BTCUSDT.P

#BTC/USD Close Fight but bulls win! $117K Still in sight!CRYPTOCAP:BTC Weekly Update:
BTC closed the week up by just 0.08%, leaving behind a long wick and a tiny body, forming a Dragonfly Doji, one of the strongest candlestick patterns, signalling a fierce battle between bulls and bears.
✅ This time, the bulls won by a small margin, but a win is a win.
✅ BTC successfully held its key support.
✅ The CC is green, which is a positive sign.
The price action remains choppy, but the trend is still pushing upward from here.
Invalidation:- Weekly Close below $100k
What do you think?
Do let me know in the comments section. And please hit the like button.
Thank you
#PEACE

Bitcoin’s Reversal from Supports — Is the Correction Over? Bitcoin ( BINANCE:BTCUSDT ) moved as I expected in the previous idea , and it also reversed the decline I intended and started to rise from the Support zone($102,000-$107,120) , Support lines , and 50_SMA(Daily) .
Bitcoin is trading near the Resistance zone($104,380-$103,670) , Cumulative Short Liquidation Leverage($105,500-$105,265) , and Resistance lines .
In terms of Elliott Wave theory , it seems that Bitcoin has managed to complete the main wave Y . The main corrective structure was the Double Three Correction(WXY) . If the Resistance lines are broken , we can confirm the end of the main wave Y .
I expect Bitcoin to start rising after a re-correction from Cumulative Long Liquidations Leverage and reach the targets I have specified on the chart.
Cumulative Long Liquidation Leverage: $102,883-$102,181
Cumulative Long Liquidation Leverage: $101,318-$100,748
Note: If Bitcoin falls below $100,200(Worst Stop Loss(SL)), we should expect further declines.
Note: $105,500 is an important price for Bitcoin, and if Bitcoin can close the 4-hour candle above it, we can expect a break of the Heavy Resistance zone($104,380-$103,670)
Please respect each other's ideas and express them politely if you agree or disagree.
Bitcoin Analyze (BTCUSDT), 1-hour time frame.
Be sure to follow the updated ideas.
Do not forget to put a Stop loss for your positions (For every position you want to open).
Please follow your strategy and updates; this is just my Idea, and I will gladly see your ideas in this post.
Please do not forget the ✅' like '✅ button 🙏😊 & Share it with your friends; thanks, and Trade safe.

Bitcoin Analysis – Possible Scenarios🟠 Price is consolidating around 104,500, sitting right on the short-term ascending trendline. No clear breakout yet.
🔴 Supply Zones:
1️⃣ OB 1H:📍 107,800 – 108,600📌 Strong rejection zone that led to the current decline.
2️⃣ OB 4H:📍 106,100 – 107,500📌 Key resistance zone – a valid break above may trigger bullish continuation.
3️⃣ Upper OB 1H:📍 110,700 – 111,400📌 Higher resistance to watch in case of strong breakout.
🟢 Demand Zones:
1️⃣ FVG 1H:📍 103,900 – 104,300📌 Price is nearing this imbalance zone – bullish reaction expected if support holds.
2️⃣ Lower FVG 1H:📍 99,900 – 100,700📌 If current support fails, this is the next strong liquidity zone.
📊 Possible Scenarios:
1️⃣ Bounce from current trendline & FVG → move toward OB 4H (buy setup with confirmation)
2️⃣ Break below trendline → deeper pullback into 100K zone
3️⃣ Breakout above OB 4H → target next resistance at 108,600 and above
‼️ Wait for confirmation before jumping in – price action is at a decision point.
🔍 Insight by ProfitaminFX
If this outlook aligns with your bias, or if you see it differently, feel free to share your perspective in the comments. Let’s grow together 📈

#BTC Beware of further declines📊#BTC Beware of further declines📉
🧠From a structural perspective, we have not been able to break through and stabilize at the resistance area near 106500. And the structure of the reversal of the bullish trend has been established, so the downside risk remains.
➡️From a graphical perspective, we have formed an extended wedge between the support line and the resistance area, and the price has now fallen below the lower edge of the wedge, so we will likely see further pullbacks.
➡️If the market really develops as expected, then the support area worth paying attention to is around 100700.
⚠️Note that if we rise again and successfully break through and stabilize at the resistance near 106750, then we will see more gains.
Let's see👀
🤜If you like my analysis, please like💖 and share💬 BITGET:BTCUSDT.P

#BTC Double Top Bearish Structure, Beware of Pullback📊#BTC Double Top Bearish Structure, Beware of Pullback📉
🧠From a structural perspective, we broke below the neckline of 106510, which means that the bearish double top pattern is established, so we need to be wary of the coming of a plunge.
➡️As I said in my last analysis, we stabilized and rebounded after testing the support near H1, but I was not satisfied because my order was swept after I moved up the SL, so we cancelled the risk and also meant that we might cancel the possible future profits.
➡️However, I still succeeded because I stuck to my trading plan and tried some short trades after the price rebounded near the blue resistance line. 50% of the profit has been locked in because I am worried that the market will jump back and forth between support and resistance, and there is a gap to be filled near 109200.
⚠️If we fail to hold the support near 106500 tomorrow, then we will see a plunge.
Let's see👀
🤜If you like my analysis, please like💖 and share💬 BITGET:BTCUSDT.P

"Caught the Dip – Next Stop: Resistance Zone 1. Current Price Action:
The asset has bounced off the demand zone around 101,500 – 102,000 USDT.
It is now trading at 102,204.56 USDT, indicating early signs of the expected bullish move.
A white curved arrow suggests a rounded bottom pattern, often signaling a bullish reversal.
2. Demand Zone (Support):
Remains the same as the previous chart: 101,500 – 102,500 USDT.
Price reacted exactly at this zone and is starting to move upward.
3. Supply Zone (Target Area):
Clearly marked at 104,800 – 105,500 USDT.
This is where the expected bullish move could face resistance or where traders might look to take profit (TP).
4. Visual Reinforcement:
The large blue arrow indicates strong bullish momentum is anticipated.
The meme (Leonardo DiCaprio pointing) emphasizes that the reversal is happening as previously predicted — likely for motivational or engagement purposes in a VIP group.
---
🧠 Technical Sentiment:
Bullish Bias confirmed: Price bounced exactly from the demand zone.
Momentum Shift is underway, as indicated by the reversal pattern.
A potential "Buy Confirmation" is in play with room to ride up to the 105K resistance zone.
---
🎯 VIP Trade Setup Recap:
Parameter Value
Entry Zone 101,500 – 102,000 USDT
Current Price 102,204.56 USDT
Target (TP) 105,000 – 105,500 USDT
Stop Loss (SL) Below 101,000 USDT
Bias Bullish / Reversal
---
📌 Suggested Title:
"Reversal In Motion – Ride to 105K 🎯🚀"

#BTC Downside risk has not been lifted📊#BTC Downside risk has not been lifted⚠️
🧠Unfortunately, it is $34 away from the second target of our short strategy of 103,000.
But don't worry, the ideal target area of the short structure has not been achieved, and the downside risk has not been lifted, so we still need to look for short opportunities after the rebound.
➡️From the current structure, the aggressive pressure level is around 106,000, and the overlapping resistance area is around 106,500-107,800.
⚠️The weekend's rise is deceptive and belongs to the repair stage after the big drop. We may see a bigger drop next week!
Let's see👀
🤜If you like my analysis, please like💖 and share💬 BITGET:BTCUSDT.P

BTC - Mega Scalps to Victory! - Buy from 103.4KMega scalps means mega money hahhaha but i feel this is the ideal scenario to short first buy second or buy on the point stated!!! Although if it breaks the green box its invalidated!

Bitcoin - Ready to go but from lowerAfter breaking out of the marked range, Bitcoin retested the level but is now showing weakness in bullish momentum.
Although the price has broken above the high that created the last lower low, it did so without strong momentum, and is now pulling back.
🔍 We are watching the highlighted zones for potential bullish reactions.
In these areas, we will look for a confirmed long entry trigger.
⚠️ The lower the price drops—especially if it reaches the 4H Fair Value Gap (FVG)—the higher the reward-to-risk ratio for long setups.
Be patient and wait for confirmation before entering. ✅
🔍 Insight by ProfitaminFX
If this outlook aligns with your bias, or if you see it differently, feel free to share your perspective in the comments. Let’s grow together 📈

BTCUSDT/IBIT: No Recovery in Sight Yet. Don't Be Fooled.Hello everyone. As I closely examine BTCUSDT and IBIT, I have a significant observation: there are no clear signals yet that selling is slowing down. This means it's too early to speak of a recovery in the market.
As intelligent investors, we look not only at price movements but also at the market's underlying dynamics. Currently, I see no clear indication in either BTCUSDT or IBIT that selling pressure is diminishing.
In such situations, a meticulous examination of the volume footprint is essential. We analyze every detail in the volume to understand if buyers are truly stepping in, and if selling orders are being absorbed. At the same time, I am closely monitoring CDV (Cumulative Delta Volume) divergences. If selling pressure were truly decreasing, we would expect to see clues in the CDV, but as of now, such confirmation is absent.
To confidently state that the market has entered a recovery phase, we need strong and confirmed breakouts on a low timeframe (LTF). Following these breakouts, a successful retest of the broken levels as support would be a reliable signal that the market has shifted direction. However, at present, such a structure has not formed.
As you know, I only trade coins that show a sudden and significant increase in volume. This approach allows me to focus my capital where the market is truly revealing its intentions. My current observation in BTCUSDT and IBIT is that this type of volume increase is not yet signaling a recovery.
Therefore, for those anticipating a market recovery, it is crucial not to act hastily and to await concrete confirmation signals. The market rewards the patient.
📌I keep my charts clean and simple because I believe clarity leads to better decisions.
📌My approach is built on years of experience and a solid track record. I don’t claim to know it all but I’m confident in my ability to spot high-probability setups.
📌If you would like to learn how to use the heatmap, cumulative volume delta and volume footprint techniques that I use below to determine very accurate demand regions, you can send me a private message. I help anyone who wants it completely free of charge.
🔑I have a long list of my proven technique below:
🎯 ZENUSDT.P: Patience & Profitability | %230 Reaction from the Sniper Entry
🐶 DOGEUSDT.P: Next Move
🎨 RENDERUSDT.P: Opportunity of the Month
💎 ETHUSDT.P: Where to Retrace
🟢 BNBUSDT.P: Potential Surge
📊 BTC Dominance: Reaction Zone
🌊 WAVESUSDT.P: Demand Zone Potential
🟣 UNIUSDT.P: Long-Term Trade
🔵 XRPUSDT.P: Entry Zones
🔗 LINKUSDT.P: Follow The River
📈 BTCUSDT.P: Two Key Demand Zones
🟩 POLUSDT: Bullish Momentum
🌟 PENDLEUSDT.P: Where Opportunity Meets Precision
🔥 BTCUSDT.P: Liquidation of Highly Leveraged Longs
🌊 SOLUSDT.P: SOL's Dip - Your Opportunity
🐸 1000PEPEUSDT.P: Prime Bounce Zone Unlocked
🚀 ETHUSDT.P: Set to Explode - Don't Miss This Game Changer
🤖 IQUSDT: Smart Plan
⚡️ PONDUSDT: A Trade Not Taken Is Better Than a Losing One
💼 STMXUSDT: 2 Buying Areas
🐢 TURBOUSDT: Buy Zones and Buyer Presence
🌍 ICPUSDT.P: Massive Upside Potential | Check the Trade Update For Seeing Results
🟠 IDEXUSDT: Spot Buy Area | %26 Profit if You Trade with MSB
📌 USUALUSDT: Buyers Are Active + %70 Profit in Total
🌟 FORTHUSDT: Sniper Entry +%26 Reaction
🐳 QKCUSDT: Sniper Entry +%57 Reaction
📊 BTC.D: Retest of Key Area Highly Likely
📊 XNOUSDT %80 Reaction with a Simple Blue Box!
📊 BELUSDT Amazing %120 Reaction!
📊 Simple Red Box, Extraordinary Results
📊 TIAUSDT | Still No Buyers—Maintaining a Bearish Outlook
📊 OGNUSDT | One of Today’s Highest Volume Gainers – +32.44%
I stopped adding to the list because it's kinda tiring to add 5-10 charts in every move but you can check my profile and see that it goes on..

BTCUSDT 4H AnalysisBTC ~ 4H Analysis
#BTC On the 4H Time frame Bitcoin is retesting this multi support level. Let's see how far this support can hold.

BTC, will it wreck down to 100k?I dont think so as of now! Expect this momentum at the earliest! where if it falls below the black line and closes in 1H it gets denied!

$BUSDT Trade Setup 1HMEXC:BUSDT Trade Setup (1H)
Entry: CMP
SL: $0.37796
TP: $0.47400 / $0.53300
Setup: Breakout above trendline with strong support at $0.37313.
Needs 1H close above $0.41 for confirmation.
DYRO, NFA

#BTC reaches the support line, be cautious about rebounding📊#BTC reaches the support line, be cautious about rebounding⚠️
🧠From a structural perspective, we tested the resistance area near 110,000 again yesterday, but failed to break through. The price has stabilized after pulling back to the uptrend support line, so we need to be alert to the risk of rebound⚠️
➡️If we still cannot break through the resistance area near 110,000 this time, we should be alert to the arrival of a plunge. After breaking the downtrend support line, I expect a deep correction phase to begin.
Let's see👀
🤜If you like my analysis, please like💖 and share💬
BITGET:BTCUSDT.P

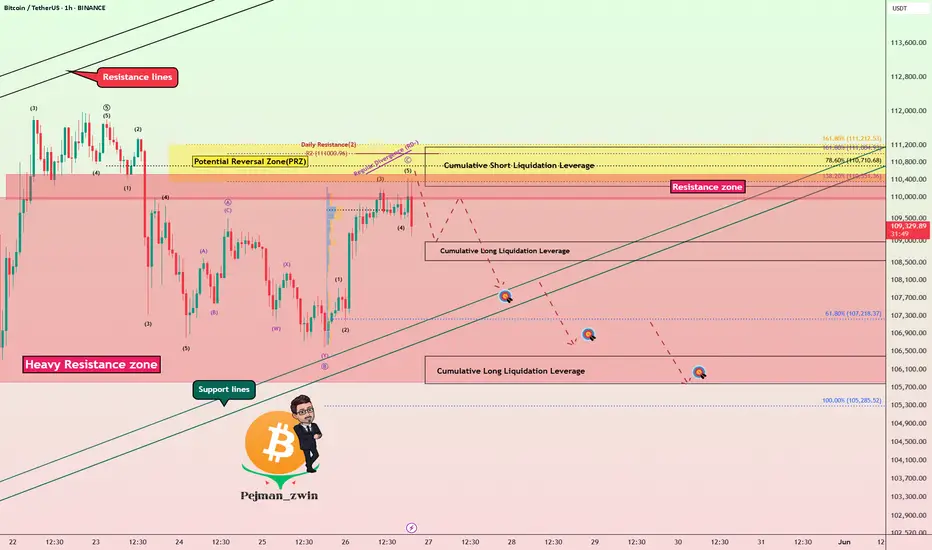
Bitcoin Bounce on Trump Tariff Delay – Short Setup Still Valid!Bitcoin ( BINANCE:BTCUSDT ) started to fall as I expected in the previous idea , and declined near the Support lines .
Bitcoin started pumping after the news that " US President Trump agreed to postpone 50% EU tariffs until July 9th ." Do you think this pumping of Bitcoin will continue?
Bitcoin is trading in a Heavy Resistance zone($110,000-$105,800) near the Potential Reversal Zone(PRZ) .
From the Elliott Wave theory perspective , Bitcoin appears to be in corrective waves , which is why I am labeling this idea as a ''Short''. The corrective waves structure is of the Expanding Flat(ABC/3-3-5) type.
I expect Bitcoin to attack the Support lines once again, and if these lines are broken, it will decline to the Targets I have indicated on the chart.
Notes :
MicroStrategy bought another 4,020 Bitcoins, but it didn't have much of an impact on the market.
If the Bitcoin price falls back below $109,000, about $185 million in long Bitcoin positions will be liquidated . = Attractive for exchanges
Bitcoin 2025 Conference to be Held in Las Vegas, Tuesday-Thursday = Could Cause Market Excitement .
Note: If Bitcoin touches $112,080, we should expect more pumping.
Please respect each other's ideas and express them politely if you agree or disagree.
Bitcoin Analyze (BTCUSDT), 1-hour time frame.
Be sure to follow the updated ideas.
Do not forget to put a Stop loss for your positions (For every position you want to open).
Please follow your strategy and updates; this is just my Idea, and I will gladly see your ideas in this post.
Please do not forget the ✅' like '✅ button 🙏😊 & Share it with your friends; thanks, and Trade safe.
Bitcoin (BTC/USDT) – Flag Breakout Points to $114KHello guys!
Bitcoin continues to respect the bullish structure within its ascending channel, and we just got a clean breakout from a textbook bull flag.
After a solid move higher earlier this month, BTC cooled off inside a tight flag pattern, consolidating above $106K. That pullback helped reset momentum, and now we’ve broken out with conviction.
You can read about it here:
We’re currently hovering around $ 109.8 K. A short-term retest of the breakout zone near $108K–$108.5K wouldn’t be surprising. it could even offer a great entry opportunity before the next leg up.
If momentum holds, the projected target from this flag pattern lands in the $113.5K–$114K zone.
watch these:
Support: $107.5K–$108.5K
Target: $114K
Invalidation: Break below $107K
Bias remains bullish unless we lose the channel structure.

#BTC failed to break through, beware of pullbacks📊#BTC failed to break through, beware of pullbacks⚠️
🧠Yesterday, I found signs of stabilization near 109500 and closed my short position and went long because I was worried that we would break through the resistance area near 110000. As a result, the market developed as expected and we successfully broke through, but unfortunately we did not stabilize above the resistance area of 110000.
➡️From a graphical point of view, we formed an extended wedge near the resistance area, and we have now fallen through this pattern, which is about $400 away from the support near 107000 that I want to focus on, so I missed this rebound space.
➡️Currently we are blocked by the downward trend line. Only if we break through here and stabilize, can we see a big surge.
⚠️Note that we have tested the support near 107000 many times. If we fall below here, we will see further pullbacks.
Let's see👀
🤜If you like my analysis, please like💖 and share💬
BITGET:BTCUSDT.P

Bullish Momentum Building, $112K Breakout on the Horizon?Hey Realistic Traders!
Can BINANCE:BTCUSDT Break Past $112K and Set a New All-Time High? Let’s Break It Down...
Trend Analysis
On the H4 timeframe, BTCUSDT has consistently traded above the EMA-90 line, confirming the continuation of a bullish trend. Within this trend, a falling wedge pattern formed, which is typically considered a bullish reversal signal. This pattern was followed by a breakout marked by a bullish Marubozu candle, further strengthening the bullish outlook.
In addition, a bullish crossover appeared on the oscillator, providing additional confirmation of upward momentum. Based on these technical signals, the price is expected to continue its upward move toward the first target at 113,613, with a potential extension to the second target at 117,968.
The outlook remains valid as long as the price stays above the key stop-loss level at 105,681.
Support the channel by engaging with the content, using the rocket button, and sharing your opinions in the comments below.
Disclaimer: "Please note that this analysis is solely for educational purposes and should not be considered a recommendation to take a long or short position on Bitcoin.

#BTC reaches the target area, beware of pullbacks📊#BTC reaches the target area, beware of pullbacks⚠️
🧠From a structural point of view, we have support near H1, and built a bullish head and shoulders structure, and broke through the downward trend line, so it is very reasonable to have such a rise.
➡️Unfortunately, the price did not reach the 105,000 support that I wanted to pay attention to, and this rise happened when I was sleeping, so I missed it.
➡️But now the price has reached the 110,000 pressure area that I am concerned about, and has reached the target area of the bullish head and shoulders structure. So I will not chase the rise in the resistance area, but I will look for some shorting opportunities.
⚠️Note that the main trend is long, so shorting is a counter-trend transaction, and we need to be cautious. Try to pay attention to the opportunity to go long on the pullback. The more aggressive support is near 108,000, and the more conservative support is near H1. It has been tested twice here. Will it be tested for the third time?
Let's see👀
🤜If you like my analysis, please like💖 and share💬
BITGET:BTCUSDT.P

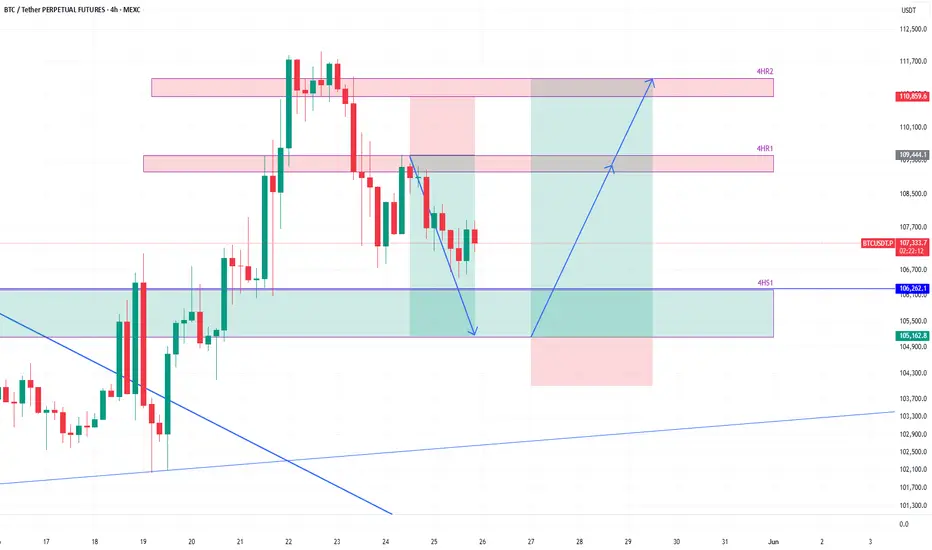
BTCUSDT to bounce from 4h supportHere is an idea for trade on BTCUSDT. The price is coming close to the 4h support zone 4HS1.
It is likely that it will find support there and bounce from there towards 4h resistance 4HR1 and possibly towards 4HR2.
We will take some profit at 4HR1 level if the price reaches there and look to refill the position on any pullback.
We will also reevaluate if the price is really heading towards 4HR2 or likely to go around 96k-97k before fueling up for upward move.