Bitcoin Reaches Close to Death CrossI write to you with a cautious tone as a significant development is occuring in the Bitcoin market: the dreaded "death cross."
As many of you may already know, the death cross is a technical pattern that occurs when an asset's short-term moving average crosses its long-term moving average. In simpler terms, it signifies a potential shift in market sentiment from bullish to bearish. Unfortunately, our beloved Bitcoin has just experienced this ominous event.
While it is crucial to acknowledge that technical analysis is not always an accurate predictor of future price movements, the death cross has historically been associated with increased selling pressure and a potential downtrend. This pattern has caused concern among traders, prompting us to take a momentary step back and reevaluate our strategies.
Considering this development, I encourage you to exercise caution and consider pausing Bitcoin trading. It is essential to reassess your risk tolerance, evaluate your investment goals, and diversify your portfolio to mitigate potential losses. Remember, preserving capital is just as important as generating profits.
As seasoned traders, we understand the allure of cryptocurrencies and the potential for significant returns. However, it is crucial to remember that the market is highly volatile and subject to rapid changes. Taking a momentary pause to analyze the situation and gather more information can be wise.
I urge you to stay informed about the latest market trends, news, and expert opinions. Consult financial advisors or trusted sources to gain insights and make informed decisions. Remember, knowledge is power in the world of trading.
While feeling uncertain during such times is natural, it is also important to remain level-headed and disciplined. As the saying goes, "The market is always right." By exercising caution and adapting our strategies accordingly, we can navigate through these challenging times and position ourselves for future opportunities.
In conclusion, I encourage you to pause Bitcoin trading, reevaluate your approach, and gather more information before making any hasty decisions. Let's take this moment to reflect, learn, and adapt our strategies to the current market conditions. Together, we can navigate these uncertain times and emerge stronger.
Btcusdtrade

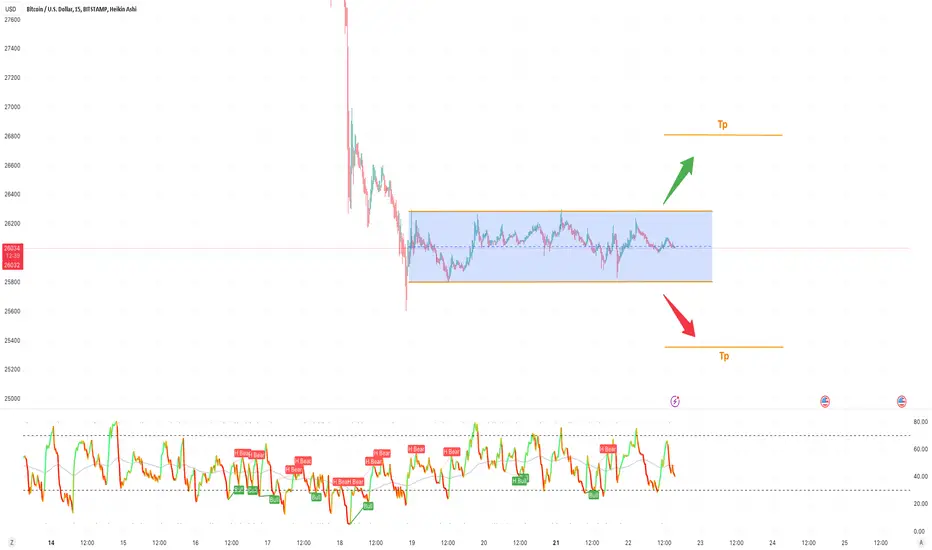
BTCUSD Breakout TradeBTCUSUD wait for breakout and trade in the direction of breakout or place your but and sell stop.
Manage your risk according to account size!

BTCUSDT, Long from a crucial supporttBTCUSDT has been a bearish trend since it rose to $28,143 on 29th August 2023. The bears have been able to bring down the price to equal lows since 22nd August at $25,331.
Price is currently reacting on a month support ($25,836) and a break below this level could further plunge the price to $21.410.6
What do I expect?
The current price is exactly reacting at the base of the trendline support of the ascending channel since 19th January 2023 and the bears are losing momentum at this level which is the reason why the bulls will overtake the bears to drive up the price to $26,606 and further to $27,601 in the coming days.

Don't worry, we're still on an uptrend in the long run!Hi guys, This is CryptoMojo, One of the most active trading view authors and fastest-growing communities.
Consider following me for the latest updates and Long /Short calls on almost every exchange.
I post short mid and long-term trade setups too.
Let’s get to the chart!
I have tried my best to bring the best possible outcome to this chart, Do not consider financial advice.
BTC is breaking through the 26700 support and the MA-200, producing a strong bearish momentum, but it is not breaking through the bullish channel. In terms of the global picture, the price remains on the rise.
Take note of the weekly chart to the left. Price is gaining pace and making a strong distributive move into the significant support level of 25000. The level is crucial to us since it includes two confirmations, one from the seller and one from the customer. I believe that another retest, particularly following the distributive movement, will result in a reversal or, at the very least, a significant bullish reaction.
Traders are waiting for fundamental confirmation before taking action on cryptocurrency. At the moment, it is the SEC's approval of BTC-ETF futures applications. This will breathe new life into the market.
Most likely, this movement within the uptrend was initiated in order to purchase the asset at a cheaper price before continuing rapid rise.
Moving averages are functioning as a barrier. The market is in a period of correction.
Levels of support: 25000, 24819
Levels of resistance: 26707, 28474, 30575
The market is in a positive trend, and a correction within the upward channel on the garfish is building, which may conclude near support.
Levels of support: 25000, 24819
Levels of resistance: 26707, 28474, 30575
The market is in a positive trend, and a correction within the upward channel on the garfish is building, which may conclude near support.
This chart is likely to help you make better trade decisions if it does consider upvoting it.
I would also love to know your charts and views in the comment section.
Thank you

#BITCOIN= SHOW SUPPORT TO OUR FIRST IDEA.Hey Everyone,
Price have accumulated since last few weeks and now we are expecting price to continue the bullish trend until $62000 which is our primary target, it is worth noticing that price have potential to reach that target as economic and other factors are supporting the idea.
Thanks for your support in advance :)

Inverse H&S that sends $BTC to $42k-48k?The price action today changed my bias from bearish to bullish.
Here's why:
- We're forming an inverse head and shoulders
- We got a green flat bottom Heikin candle on the 1D (this could change by close) but still usually signals a reversal in trend
- On the 2D chart, we went higher on a Demark buy 9
- Ichimoku looks bullish, with price on high timeframes still above the clouds
- RSI 1D bounced at my 32 bullish level
- Double bottom on the 4H OBV
- We flipped the $28.6k level as resistance as support (for now)
The bearish case now is lesser than the bullish case looking at the chart structure. The bearish case would be:
- Still have a weekly red heikin ashi candle with a demark count of 2 (bearish trend)
- Price is below the cloud (12hr) as you can see from the chart
But being we bounced at previous resistance, my bias has flipped bullish for the time being.
I still think we'll chop around in this area until Sunday before making a larger move, but I'm now scouting entries instead of looking to buy lower.
In terms of where to buy, there's a support at $29.5k, the one at $28.6k and $28.3k. If this is the start of the impulse, oftentimes, you get 3 tests of support before the leg up begins (to make people think that support is breaking before a move higher).
I'm going to bid half of my position at $28.6k and the other half at $28.3k to see if those two get filled. If you wanted to take a more aggressive entry, you could bid $29.3-29.5k. The bottom support on the chart hasn't gotten tested yet as support, so it would make sense that we'd get the final 3rd wick and test of that support before the move up (my logic for bidding lower).
Let's see how it plays out. A loss of that lower $28.3k level is bearish. Any price action above that is now bullish.
This lines up more with my previous idea outlined here:

Good Time for Trading Bitcoin.It is too early to succumb to emotions, since there are still many stops under the lows. Most likely, this is a short-term trap, but if the price goes out and fixes above the red zones, it will become a more bullish sign.
When the minimum is updated, the fifth wave of the lower order will be placed, after which we can expect a rebound in order to close the gap.

BTCUSDT TradeAfter taken liquidity of the buyside and change of character wa take fvg OF 5 MIN AN ENTRY POINT we will see a drop of the price to taken liquidity of the sellside ( 5 time frame analysis)
- Trading is probability control your risk management
Good luck!

BTCUSD Breakout Trade IdeaBTCUSD wait for breakout and trade in the direction of breakout or place your but and sell stop.
Manage your risk according to account size!
BTC/USDT D ( downtrend & longterm ) BINANCE:BTCUSDT
Hey there dear attendants
It will be a pleasure if you could brace me with your supportive likes & comments if you would have tested my strategies
According to my analysis the downtrend of btc has been started and we should wait for 17000
is not financial advice

BTCUSDT Daily Analysis After fill FVG of downtrend and rejection of a key level we will see a retournement of the price to retest breaker block

Btc/Usdt UpdateBTC/USDT
Daily Chart:
If you've been keeping up with us, you'll know we said 32k would likely be BTC's peak this year. Now, BTC has broken down and is testing a horizontal support. There might be a slight bounce towards 29k to retest the breakdown level. Overall, I have a bearish view.
Please note: This is just an idea, not financial advice. Research before making decisions.
Wishing you luck! And if you're pleased with our work, please consider supporting us.
Happy trading!
Crypto by Ghazi

Bitcoin Falling! Read for Entry!!CME:BTC1!
CRYPTOCAP:BTC has followed my analysis from a while back.
Yesterday I cautioned traders to watch for the Bearish Retest.
Congratulations to those that played this ... 18.23% down and in profit!
At 25.2k zone, my thought are looking for a fakeout to long back to 31.8K.
200 Daily is potential support at 25.2k.
If this does not happen then short ideas are to ~21.4k and ~19.7k zones.
Don't panic that you have missed any move. Prepare now with Plan A Plan B scenarios as I always point out.

📈Bitcoin, right time for a bullish rally? 📉BINANCE:BTCUSDT
COINBASE:BTCUSD
Hello dear traders
Continuing our analysis of Bitcoin, the price is trying to use its support level within the fork structure to start a bullish rally.
In the next few days, Bitcoin is expected to return to the $31,000 range if it holds above the indicated areas (29600-29800).
If the price breaks below the mentioned areas, botcoin will drop to the level of 28,460 and then 26,500.
✌💥If you are satisfied with my analytical content, please share my ideas💥✌
✍🐱👤Otherwise, make sure you leave comments and let me know what you think.🐱👤✍
🤑🍾Thank you for your support. I hope you will gain profit by following my analyses.🍾🤑

BTC current price direct short
After BTC fell from the daily high of 31800
Now there is a shock rise
The next wave will continue to fall
Trend line 29600-29700 first layout a wave of short selling
The current price of 29400 is directly short
This wave of empty orders is best to deviate from the bottom of the daily line level
Below the target of 28500, we are considering doing more

BTCUSD Breakout TradeBTCUSD wait for breakout and trade in the direction of breakout.
Manage your risk according to account size!

Bitcoin pushing towards 31K - BTCUSDHello traders,
BINANCE:BTCUSDT is trading in a range that we identified on May 2022 as a liquidity gap.
As predicted trading turned into this box to fill te previous liquidity gap.
At the moment we need a validation to confirm a break below or above this box.
There are good chances of a break as there is a large bullish flag pattern on the daily timeframe.
In the short term we will see bulls pushing bitcoin around 31K.
I will update this idea in the next few days.
Upvote and comment with your idea.
Thank you all for the support over the years.

BTCUSDT TRADE after taken liqudity of the buyside and change of character and Break of strucrute we will see a drop of the price to fill FVG '' Fare Value Gap '' we consider mitigation block an entry point
- Trading is probability control your risk management
Good luck!

BTCUSD I Corrective wave in process and bullish accumulationWelcome back! Let me know your thoughts in the comments!
** BTCUSD Analysis - Listen to video!
We recommend that you keep this pair on your watchlist and enter when the entry criteria of your strategy is met.
Please support this idea with a LIKE and COMMENT if you find it useful and Click "Follow" on our profile if you'd like these trade ideas delivered straight to your email in the future.
Thanks for your continued support!

BTCUSD Breakout TradeBTCUSD wait for breakout and trade in the direction of breakout or place your but and sell stop.
Manage your risk according to account size!

#Bitcoin Current Update ( Daily Time Frame )Hi guys, This is CryptoMojo, One of the most active trading view authors and fastest-growing communities.
Consider following me for the latest updates and Long /Short calls on almost every exchange.
I post short mid and long-term trade setups too.
Let’s get to the chart!
I have tried my best to bring the best possible outcome to this chart, Do not consider financial advice.
#BTC Everyone is focused on the Major Trendline
On the daily timeframe Chart, the Major Trendline is being zealously defended by Bitcoin Bulls.
- We might see another 15–18% bullish rally if Bitcoin holds above the Trendline Support (28.4k) and breaks the Wedge upward.
- We might test the Crucial Support around 24.9k, though, if the daily candle closes below the Major Trendline.
This chart is likely to help you make better trade decisions if it does consider upvoting it.
I would also love to know your charts and views in the comment section.
Thank you

📈LONGING BTC 📈📈LONGING BTC 📈
🔰Purchase levels:
$29,023-$29,200 (Market price)
$28,485-$28,714
$27,534-$27,756
📉Selling:
$35,500-$36,500
I'm accumulating equal portions in each of the zones.
Wishing everyone successful trades! 😎💸

How will the Candle of the current 6 Months be Closed❗️❓Hi everyone👋 (Reading time less than 5 minutes⏰) .
Today I want to show you the 🎯 target 🎯 of Bitcoin for the next 5 months using the 6-month Bitcoin candles.
⚖️Bitcoin has created 6-month candles in the last 7 years, and if we look closely at these candles, we can see similar movements in them.⚖️
⚖️I divided the 6-month candles into 5 similar movements.⚖️
⚖️The first movement consists of three candles, which showed an upward movement before the start of the correction, which are similar in both periods of the first movements.⚖️
⚖️In the same way, the next candles had similar movements.⚖️
⚖️If the fifth movement wants to be similar to the fifth movement of the previous movement, the candle of the current 6 months has to close in red, and 50% of the fourth movement should have a minimum decline (about $22,780) .⚖️
🔔As a result, I expect Bitcoin to drop to at least $22,780 in the next 6 months.
It is interesting to know that this analysis is similar to my previous post on "Bitcoin 🗺️Road map🗺️for 300 Days Before Halving 2024❗️"It is compatible; I recommend you to read the following post as well.👇
Bitcoin Analyze ( BTCUSD ), 6-months time frame ⏰.
Do not forget to put Stop loss for your positions (For every position you want to open).
Please follow your strategy, this is just my Idea, and I will be glad to see your ideas in this post.
Please do not forget the ✅' like '✅ button 🙏😊 & Share it with your friends; thanks, and Trade safe.
