Shorting Analysis on Bitcoin - Fxdollars- {15/04/2025}Educational Analysis says that BTCUSD may give countertrend opportunities from this range, according to my technical analysis.
Broker - BITSTAMP
So, my analysis is based on a top-down approach from weekly to trend range to internal trend range.
So my analysis comprises of two structures: 1) Break of structure on weekly range and 2) External pushback to fill the remaining fair value gap
Let's see what this pair brings to the table for us in the future.
Please check the comment section to see how this turned out.
DISCLAIMER:-
This is not an entry signal. THIS IS ONLY EDUCATIONAL PURPOSE ANALYSIS.
I have no concerns with your profit and loss from this analysis.
I HAVE NO CONCERNS WITH YOUR PROFIT OR LOSS,
Happy Trading, Fx Dollars.
Btcusdtrade

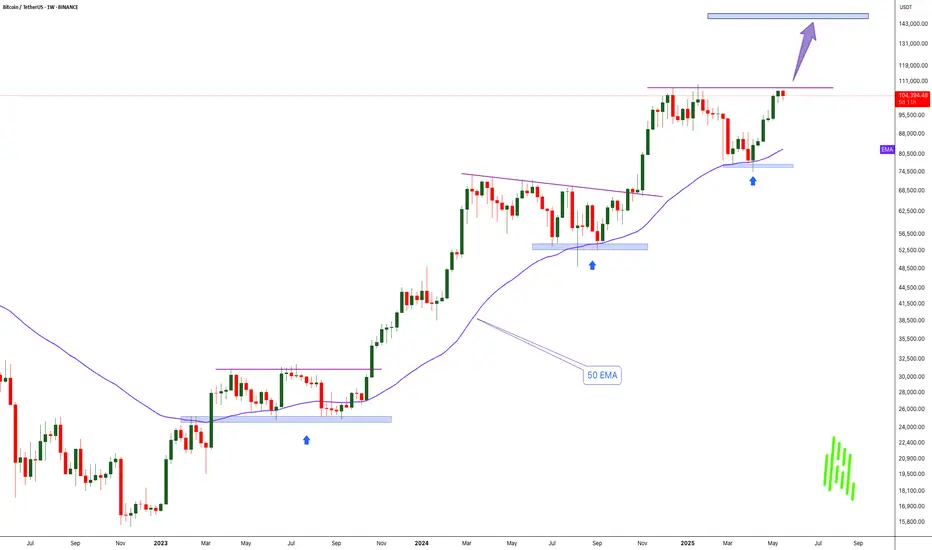
History Repeats: Bitcoin Bounces from Weekly 50 EMA-$150K Next!!MARKETSCOM:BITCOIN continues to show exceptional strength and bullish momentum. If we look back at the charts from 2023 and 2024, a clear pattern emerges — every time BINANCE:BTCUSDT touched the 50 EMA on the weekly chart, it led to a significant rally and eventually new all-time highs. That same setup seems to be unfolding again right now.
Recently, COINBASE:BTCUSD tested the 50 EMA around the $75,000 level and has since bounced strongly. The price has reclaimed the $100,000 mark and is now challenging previous all-time high resistance. Historically, after a successful bounce from this key moving average, Bitcoin hasn’t just recovered — it’s exploded to new highs.
Based on this repeating pattern, our current cycle target is set at $150,000. A clean breakout above the current resistance zone could be the catalyst that propels BYBIT:BTCUSDT Bitcoin into uncharted territory once again. The structure remains bullish, momentum is building, and the trend clearly favors the upside.
This is a classic “Buy and HODL” moment. The technicals are aligning, the market psychology is shifting, and all signs point toward a continued bull run. Buckle up — it looks like we’re in for another legendary Bitcoin rally.
Still bullish, it is recommended to focus on going long.Earlier, Bitcoin reached a weekly high of $106,518 before pulling back due to market liquidation, with total market liquidations exceeding $669 million. Bitcoin has closed higher for five consecutive weeks on the weekly chart, forming a "higher highs and higher lows" upward pattern, rising nearly 43.75% from its recent low. However, it encountered resistance near the all-time high of $109,588 and failed to break through. Currently, Bitcoin is trading in the $100,000-$110,000 range, with strong support at $100,000 and $90,000, and key resistance at $110,000.👉👉👉
After Bitcoin previously broke through $105,500, the moving averages showed an upward trend, and the RSI was in the overbought zone, indicating strong bullish momentum.
Overall, under the combined influence of news and technical factors, the Bitcoin market on May 19th showed a short-term volatile but long-term optimistic trend. Investors need to closely monitor changes in key support and resistance levels, as well as the impact of market news, and make investment decisions cautiously.
BTCUSD Trading Strategy
buy @ 102500-102700
sl 101000
tp 103800-104000
If you think the analysis helpful, you can give a thumbs-up to show your support. If you have different opinions, you can leave your thoughts in the comments. Thank you for reading!👉👉👉

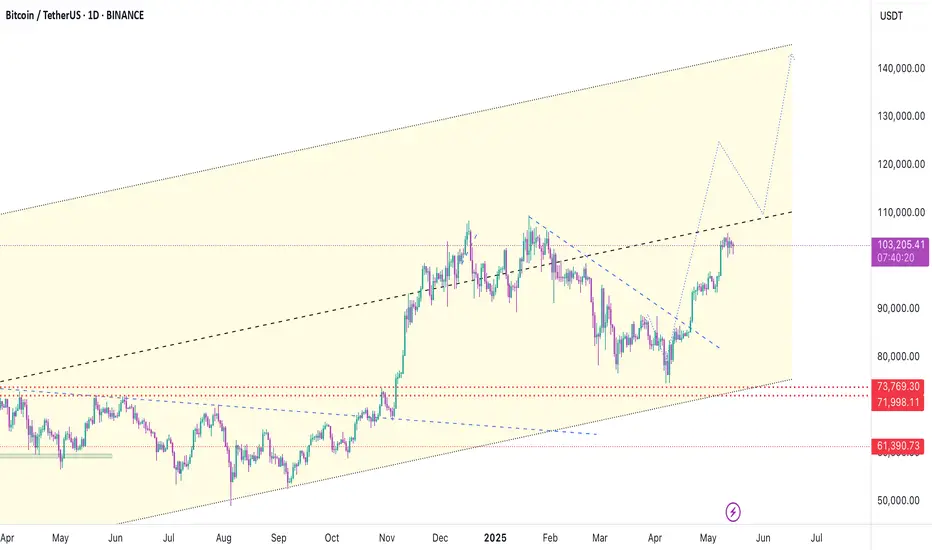
Bitcoin still has strong supportThe RSI index is in a neutral-to-strong zone but has retreated from earlier levels, indicating that short-term upward momentum has weakened. The MACD indicator still maintains a bullish pattern, though the height of the bars has decreased. The price remains well above both the 50-day and 200-day moving averages, with the medium-to-long-term upward channel intact, keeping the overall structure in a strong bull market. However, there are signs of a potential short-term pullback.👉👉👉
On the daily chart, the Bitcoin price remains above the long-term trend breakout point since April. The 20-day moving average is at $103,260, forming a direct resistance level, while the 50-day moving average at $101,904 coincides with a key support level. As long as the Bitcoin price stays above this dynamic range, bulls still have opportunities.
In view of the current market conditions, short-term trading is recommended for investors to closely monitor the breakthrough of key support and resistance levels. If the price pulls back to the $100,000-$101,000 range and finds support, while forming daily K-line doji or long lower shadow patterns, appropriate position increases can be considered, with targets set at $105,000. After a breakthrough, the target can be further adjusted to $110,000. At the same time, due to market uncertainties and short-term pullback risks, investors should control their position sizes and avoid excessive leverage and blind chasing of gains or panic selling.
BTCUSD Trading Strategy
buy @ 102500-102700
sl 101000
tp 103800-104000
If you think the analysis helpful, you can give a thumbs-up to show your support. If you have different opinions, you can leave your thoughts in the comments. Thank you for reading!👉👉👉

BTCUSDT, We are in Up TrendHello everyone
According to the chart that you can see the price movement was moved exactly to the route the we analysed and shown weeks ago and according to this time , that analysed is valid
If you need some help you can send us messages
Good Luck
AA
Bitcoin remains in high-level fluctuationsThe price of Bitcoin has generally remained above $103,000 today, demonstrating strong support. In the short term, after experiencing previous fluctuations, Bitcoin is currently in a relatively stable upward trend and continues to move towards higher prices.👉👉👉
Global economic events have contributed to the rise of Bitcoin. The decision between China and the U.S. to temporarily reduce tariffs has improved investor confidence and encouraged market risk appetite, making funds more willing to flow into risky assets like Bitcoin.
From a technical perspective, Bitcoin is in a strong upward trend. The RSI is above 70, indicating that Bitcoin may be in an overbought state in the short term. This could lead to a slight pullback or sideways consolidation in the upcoming market to digest excessive buying pressure. Investors need to pay attention to potential pullback risks, while closely monitoring factors such as macroeconomic data, policy changes, and market capital flows to adjust investment strategies in a timely manner.
BTCUSD Trading Strategy
buy @ 102700-103000
sl 101000
tp 104000-104200
If you think the analysis helpful, you can give a thumbs-up to show your support. If you have different opinions, you can leave your thoughts in the comments. Thank you for reading!👉👉👉

BTCUSDT hit take profit.Although the trade took a bit longer to play out, as always, BTC delivered solid profits. This will be my first and last trade of the day.
I'll be back to share new opportunities tomorrow if the market presents them, traders.
Wishing you all profitable days — much love to each of you! 🙂

BTCUSDTHere is your translated and polished English version with a professional and data-driven tone:
Hello traders.
Today's first trade comes from BTC. Currently, BTC’s delta value is very close to turning negative (currently at +0.72%). In addition to that, we’re seeing the Activity and Volume Order Flow Profile positioned at a highly critical level.
For these reasons, I’ve opened a sell position on BTC. You can find the full trade details below:
🔍 Criteria:
✔️ Timeframe: 15M
✔️ Risk-to-Reward Ratio: 1:1.50 / 1:2
✔️ Trade Direction: Sell
✔️ Entry Price: 103,796.33
✔️ Take Profit: 103,428.49
✔️ Stop Loss: 103,979.65
🔔 Disclaimer: This is not financial advice. It’s a trade I’m personally taking based on my own system, shared purely for educational purposes.
📌 If you're also interested in systematic and data-driven trading strategies:
💡 Don’t forget to follow the page and subscribe to stay updated on future analyses.

SHARE THE IDEA ABOUT BTCUSD BEARISH PATTERNCurrent Market Overview:
Price Action: Bitcoin has rallied approximately 40% from its April lows, reaching a high near $105,525 today.
Support Levels: Key support is identified around $100,000, with additional support near $92,000.
Resistance Levels: Immediate resistance is observed around $107,000, with a potential upside target near $120,000 if bullish momentum continues.
Bearish Pattern Analysis:
While the broader trend remains bullish, certain patterns indicate possible short-term bearish movements:
Head and Shoulders Formation: Some analysts have noted a potential head and shoulders pattern forming, which could signal a reversal if confirmed.
Momentum Indicators: The Relative Strength Index (RSI) is above 70, suggesting overbought conditions that might precede a pullback.

BTCUSDTHello traders.
The first trade of the week will be from BTCUSDT.
The pair drew a lot of attention over the weekend with strong bullish momentum. Some analysts are even suggesting it could rise to 106,000 USD during the week.
However, the crypto market is currently very volatile. Despite that, I'm activating a trade based on my system.
🔍 Criteria:
✔️ Timeframe: 15M
✔️ Risk-to-Reward Ratio: 1:2
✔️ Trade Direction: Buy
✔️ Entry Price: 104000.00
✔️ Take Profit: 104596.14
✔️ Stop Loss: 103702.15
🔔 Disclaimer: This is not financial advice. It's a trade I’m taking based on my own system, shared purely for educational purposes.
📌 If you're also interested in systematic and data-driven trading strategies:
💡 Don’t forget to follow the page and subscribe to stay updated on future analyses.

BTCUSDT: Drops Towards $53000 region may help us hitting $80000.BINANCE:BTCUSDT price currently in making of AB=CD pattern, it is likely to touch and reject at the $53000 which area remain crucial for most of the swing investors. The following news we can significant impact in the crypto market also 50k to 53k area remain extremely bullish. With accurate entry at 530000 area when we can target 80-100k possibly.

BTCUSDT: Safe Zone Vs Risk Zone, Which one would you choose? Dear Traders,
WE have possible buying opportunities, with the first entry, the only reason that we think that price would reverse is, possible end of year bullish push which may take price to another record higher high. Although, since the price already has rejected we think price is unlikely to reject at the level, and may drop to 75k region.
good luck.

#BITCOIN: Another drop and then Swing Bounce $125,000The current market sentiment is bearish, indicating a potential further decline towards the 65k price point. However, we anticipate a rebound towards the 125k region. As we approach the 65k threshold, we expect a substantial price increase.
To make informed investment decisions, it is crucial to observe a strong bullish trend before considering any bullish entries.
For more insights and market analysis, please like and comment.🚀❤️
Team Setupsfx_

#BITCOIN: $130,000 Is Where Price Headed To? BINANCE:BTCUSDT consolidated at 75k and reversed from the region as predicted in our previous chart. We now have strong confirmation that price will likely break through the daily bearish trendline. We can enter when it retests the identified area.
We have two major targets. Do your own research and analysis, and use this as secondary bias.
Good luck trading.
❤️
Hope you’re having a great weekend.
Team Setuspfx_

#BTCUSDT:Price Moving Well From $88,000 to $96,000,Next $128,000Bitcoin has moved well from our last idea of $88,000 to $96,000. However, a small correction is expected, which could be a good point to enter a swing trade. This could take the price to a new record high of around $128,000.
We have three targets, but each can be set based on your overview. The last three candles are not clear, so it’s best to wait for price to have a clearer indication of its next move.
We wish you the best and good luck in your trading journey. Thank you for your unwavering support! 😊
If you’d like to contribute, here are a few ways you can help us:
- Like our ideas
- Comment on our ideas
- Share our ideas
Team Setupsfx_
❤️🚀

#BTCUSDT: Will Bitcoin Make Any Correction To $90,000?Hey Everyone,
Happy Sunday
Currently, Bitcoin’s price is consolidating within a shorter timeframe, which has heightened the likelihood of it reaching the $90,000 ‘FVG’ region. However, this could be attributed to the hectic week we experienced, with numerous significant market announcements that have heightened uncertainty in the cryptocurrency market. At present, there are two opportunities for Bitcoin: one is riskier, while the other is considerably safer. You can utilise this analysis as a secondary bias.
We extend our best wishes and good luck in your trading endeavours. Your unwavering support is greatly appreciated.
If you wish to contribute, here are several ways you can assist us:
- Like our ideas
- Comment on our ideas
- Share our ideas
Team Setupsfx_🚀❤️

Scenario #BTCUSDT long📉 LONG BYBIT:BTCUSDT.P from $104,353.0
🛡 Stop loss: $103,572.0
🕒 Timeframe: 1H
✅ Market overview:
➡️ The price confidently broke above $103,729 and held, confirming the uptrend.
➡️ The next target zone is $104,720–$105,090 — nearest movement objectives.
➡️ Volume increased during the impulse, indicating strong buyer presence.
➡️ A local support level formed around $103,729 — on a pullback, this zone may hold the price.
➡️ POC at $94,479 remains far below — the market has left the balance zone and is trading in an impulsive phase.
🎯 TP Targets BYBIT:BTCUSDT.P :
💎 TP1: $104,720.0
💎 TP2: $105,090.0
💎 TP3: $105,275.0
⚠️ Important: current structure BYBIT:BTCUSDT.P suggests possible correction (wedge breakdown), requiring caution or exit on key level loss.
⚠️ Despite the initial long from $104,353, a breakdown below $103,572 (stop loss) invalidates the long setup.
📢 If H1 closes below $103,572 — better to exit, scenario invalid.
🚀 Scenario BYBIT:BTCUSDT.P valid while holding above $103,729 — below that, correction likely toward lower targets!

BTCUSDT Take ProfitThe BTCUSDT trade I shared 44 minutes ago has just hit take profit. Hope you took advantage of the opportunity 🙂

btcusd sell signal. Don't forget about stop-loss.
Write in the comments all your questions and instruments analysis of which you want to see.
Friends, push the like button, write a comment, and share with your mates - that would be the best THANK YOU.
P.S. I personally will open entry if the price will show it according to my strategy.
Always make your analysis before a trade

Bitcoin is likely to rise after its declineFrom the perspective of historical trends and technical indicators, when the short-term moving averages show a bullish arrangement, it is usually a relatively strong signal. However, the previously mentioned signs of a bearish divergence in the MACD indicator imply the risk of a pullback. If Bitcoin can break through the recent resistance level, such as $95,000, it may trigger a new round of upward trend. Conversely, if it fails to break through and the selling pressure continues to increase, there may be a certain degree of decline.👉👉👉
From the demand side, although the inflow of ETF funds is still lower than the level in 2024, the apparent demand has turned positive since the end of February, indicating a certain purchasing power. If this kind of demand continues to grow, it will provide support for the price of Bitcoin. On the supply side, the total amount of Bitcoin is fixed, and the increase in mining difficulty has slowed down the growth rate of new currency supply, which is conducive to price stability or increase to a certain extent.
BTCUSD Trading Strategy
buy @ 93500-9370
sl 925000
tp 94800-95000
If you approve of my analysis, you can give it a thumbs-up as support. If you have different opinions, you can leave your thoughts in the comments.Thank you!👉👉👉

BTCUSD short-term view.It is a good opportunity to sell BTCUSD in real time. Short-term is based on the right side of the swing trading, with a target of 93000-92500. In addition, the uncertainty of the news on BTCUSD. It is a good time to sell now.

BTCUSDTHello traders! A potential short signal is forming on BTCUSDT. However, it's not ideal to open the sell position right now — we need to wait for the price to reach a specific level. Once it does, we can execute the trade.
So, what are the entry, TP, and SL levels for this setup?
If you’ve just started following me, let’s get started!
🔍 Criteria:
✔️ Timeframe: 15M
✔️ Risk-to-Reward Ratio: 1:1.50 / 2
✔️ Trade Direction: Sell
✔️ Entry Price: 95828.00
✔️ Take Profit: 95507.18
✔️ Stop Loss: 95988.00
🔔 Disclaimer: This is not financial advice. It's a trade I’m taking based on my own system, shared purely for educational purposes.
📌 If you're also interested in systematic and data-driven trading strategies:
💡 Don’t forget to follow the page and subscribe to stay updated on future analyses.

BTC/USD) Trend channel analysis setup Read The ChaptianSMC Trading point update
technical analysis of Bitcoin (BTC/USD) on the 1-hour timeframe. It showcases a potential breakout continuation vs. pullback scenario, depending on how price reacts around a key short-term resistance area.
---
Key Observations:
1. Current Price:
$93,754 — Price is consolidating just below a local high.
2. Support and Resistance Zones:
Support BOS (Break of Structure): Around the $87,351 level, highlighted in yellow.
Upper Target Zone: $98,954–$98,983
200 EMA: Near $86,926, offering dynamic support.
3. Two Possible Scenarios:
A. Bullish Continuation:
If the price holds above the immediate structure and breaks out of the short-term consolidation near the top:
It may surge toward the upper target zone ($98,983).
This aligns with the ascending channel and continuation pattern.
B. Bearish Pullback:
If the price fails to sustain above the resistance area:
A correction down to the support BOS zone (~$87,351) is likely.
This pullback may be temporary, potentially offering a re-entry zone for bulls.
4. RSI Analysis (Bottom of Chart):
RSI is showing signs of bearish divergence (price making higher highs while RSI makes lower highs).
This suggests momentum is weakening, and a short-term pullback could occur.
---
Trade Ideas:
Long Setup (Breakout):
Entry: Above recent high (~$94,500).
Target: ~$98,950
Stop Loss: Below ~$92,000
Short Setup (Rejection):
Entry: Rejection near ~$94,000–$94,500
Target: ~$87,350
Stop Loss: Above ~$94,800
Mr SMC Trading point
---
Summary:
This analysis reflects a critical decision point for BTC/USD. Price is nearing a local high with RSI divergence suggesting a pullback may come first — but if buyers remain strong and break resistance, a continuation toward GETTEX:98K is likely. Wait for confirmation of direction before entering.
Pales support boost 🚀 analysis follow)
