"Bitcoin’s Big Heist – Are You In or Out?"🚨 BTC/USDT HEIST MISSION – SWIPE THE BULL RUN BEFORE THE BEARS WAKE UP 💰💣
🌟Hi! Hola! Ola! Bonjour! Hallo! Marhaba!🌟
Money Makers & Robbers, assemble! 🤑💰✈️💸
Here’s your decoded BTC/USDT “Bitcoin vs Tether” Crypto Market Heist Plan, fully loaded with Thief Trading Style 🔥 TA + FA combo. We’re prepping for a bullish breakout loot – eyes on the vault, ignore the noise.
🎯 PLAN OF ATTACK:
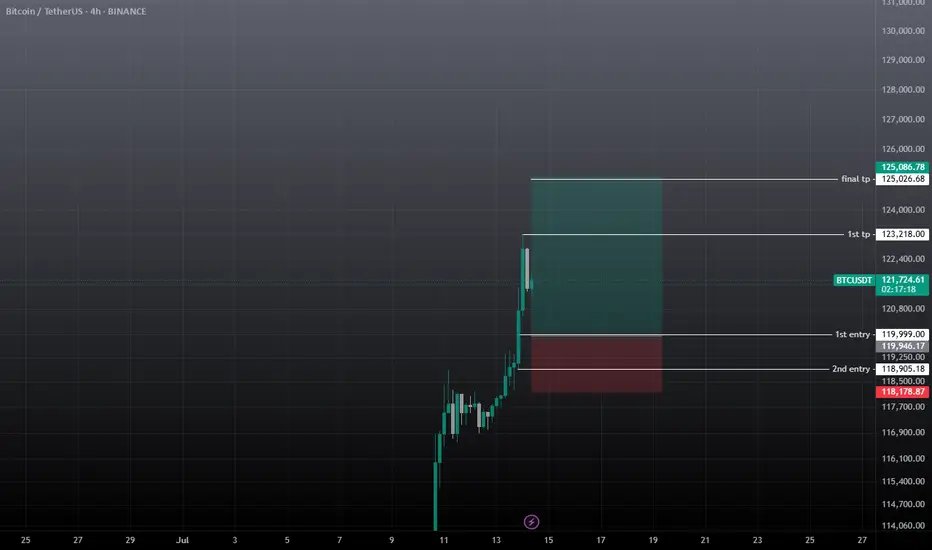
🎯 ENTRY (BUY ZONE):
💥 “The vault’s open—time to sweep!”
DCA/Layer your buy limit orders near the 15–30 min swing lows/highs for sniper pullback entries.
Use multi-entry method to stack positions (layering / DCA) as per your ammo (capital 💵).
🛑 STOP LOSS:
Set SL at the nearest swing low wick (4H TF) — around 115000.00, adjust based on your risk/load.
SL = insurance. Not optional.
🏁 TARGET:
Lock sights on 125000.00
🎉 Or… vanish with profits before the bear cops arrive.
🔎 MARKET BACKDROP & ANALYSIS:
📈 BTC/USDT currently signals bullish vibes on the swing/day horizon — fueled by:
Macro Fuel & Fundamentals
Sentiment Radar
COT Reports
On-Chain Pulse
Intermarket Clues
🚀 Connect the dots. The smart money's already prepping a breakout move.
🧲 Scalpers Note:
Stick to the long side only. No shorting the beast — unless you’re made of diamonds.
Secure your bag with trailing SLs.
⚠️ NEWS TRIGGER ZONE – TRADE WITH TACT:
📢 Upcoming high-volatility news events can spike charts.
Avoid new entries during releases and guard open trades with trailing SLs.
Protect the loot. Always.
💖 SUPPORT THE HEIST GANG: BOOST IT!
Smash that ❤️ to boost our thief squad’s momentum!
Every click powers this underground mission – making money with style, one pip at a time. 🎯💣💵
🚀 See you in the next heist drop.
Until then – Stay stealthy. Stay profitable. Stay legendary. 🐱👤💸🏆
Btcusdtrading

BTCUSD IdeaWe are waiting for our asset to reach our action zone, and based on the reaction, we’ll decide on our next moves.ALWAYS WAIT FOR A CONFIRMATION TO SEE IF THE PRICE VALIDATES THE ZONE.and you what is your vision of the EURUSD its interests me! i wait you in the commentary

Bitcoin - The cycles are playing out!⚔️Bitcoin ( CRYPTO:BTCUSD ) just repeats another cycle:
🔎Analysis summary:
Following all of the previous all time high breakouts, Bitcoin will now further extend the rally. After some simple calculation, we can see that Bitcoin will rally another +50% in order to reach the overall price target. However there will be volatility along the way so make sure to remain calm.
📝Levels to watch:
$200.000
SwingTraderPhil
SwingTrading.Simplified. | Investing.Simplified. | #LONGTERMVISION

BTCUSD BTCUSD still expecting some good run within to the up side as there’s a new higher price that’s not been touched
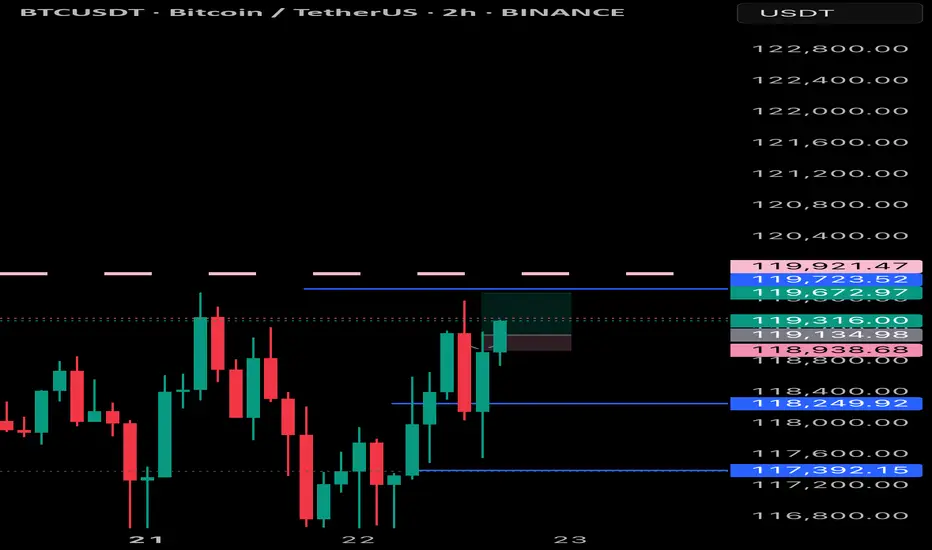
Btcusd:Huge trading opportunities and ideasBTCUSD's rebound after touching the position near 116180 this time is fast. From the trend observation. BTCUSD is still in a high consolidation stage. It has not broken the oscillation range for the time being. It can maintain selling near 120k. Buying near 11600 for range trading. It is expected that there will not be many trading opportunities in the London market. It will take until the New York market opens to see better trading opportunities.

BTCUSDBTCUSD also fell from a high level, reaching a high of around 119700, only 300 points away from the target of 120k. The price after the decline is now around 118600. Buying at a low level is the main focus. The reference buying point is 118500-118000. The target is above 120k. Stop loss 117300
#BTCUSDT(BITCOIN): Another Small Correction And Bounce Straight Bitcoin reached a record high of 125k, but then its price started to drop and is currently trading at 115k. We expect the price to reverse from the 110k area and continue its bull move towards the potential next target of 150k. Keep an eye on the price to see if it falls below our area of interest.
Good luck and trade safely!
Team Setupsfx_
btcusdt buy / long scalp setupWait for the entry and must use sl on all trades, if tp achieves first then ignore it.
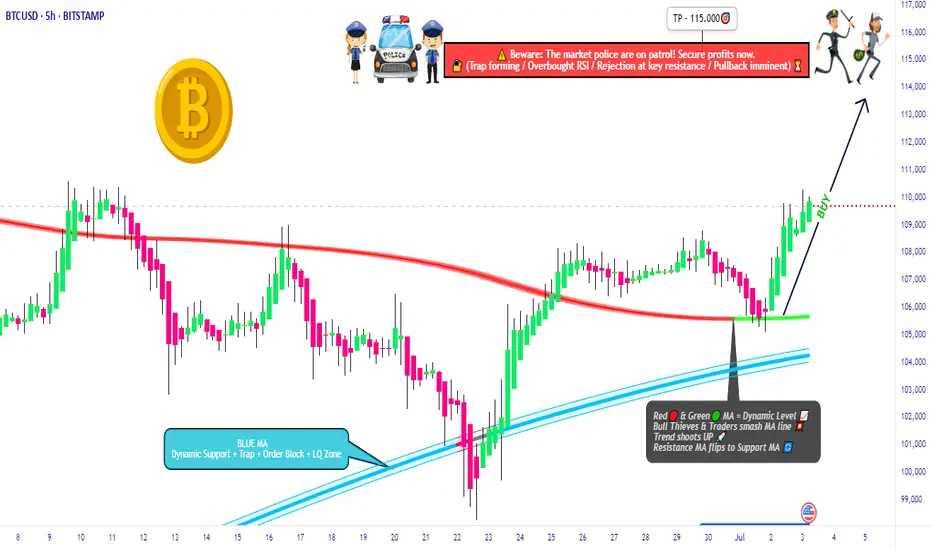
BTC/USD Heist Mode: Buy Low, Escape Rich🔓 BTC/USD Crypto Vault Breach: Thief Strategy for Long Entry Robbery (Swing/Day Setup) 🔓
🌟Hi! Hola! Ola! Bonjour! Hallo! Marhaba!🌟
Dear Money Makers & Robbers, 🤑💰💸✈️
🚨 Welcome to our next Thief Trading-style breakout mission — this time targeting the mighty BTC/USD vault. Using a fusion of technical precision and macro-level insight, we're charting a long entry blueprint for a profitable heist.
🔑 Entry Plan
"The vault is open!" 💥
Buy at current price or set Buy Limit near swing lows (15–30min timeframe pullback entries). We're timing the entry with stealth—precision over panic.
🛑 Stop Loss Setup
SL set near recent swing low (4H TF reference: ~104.000).
Adjust based on position sizing, risk appetite & multi-order tactics.
🎯 Take Profit Target
Targeting 115.000—or exit earlier if price action stalls. Get in, get out. Efficiency is the code.
👀 Scalpers' Notice
Only work the Long side. If your bag’s heavy, strike instantly. If light, ride with swing robbers. Use trailing SLs to protect your bag.
📈 Why We’re Bullish
Market momentum favors the bulls:
Overbought zones acting as lures
Bearish traps ready to flip
Key confluences from sentiment, COT, on-chain & macro analysis
➡️ Full supporting breakdown available 👉👉🔗🔗.
📢 Risk Note – Stay Sharp
Major news events = increased volatility ⚠️
Avoid entries during news. Trail stops to protect running profit. Rob smart.
💖 Boost the Crew
If this blueprint aligns with your mission, hit that Boost button. It fuels the team, and together, we profit like pros. One heist at a time. 💪🎉
🧠 Stay ready—next plan drops soon. Until then, rob safe, rob smart. 🐱👤
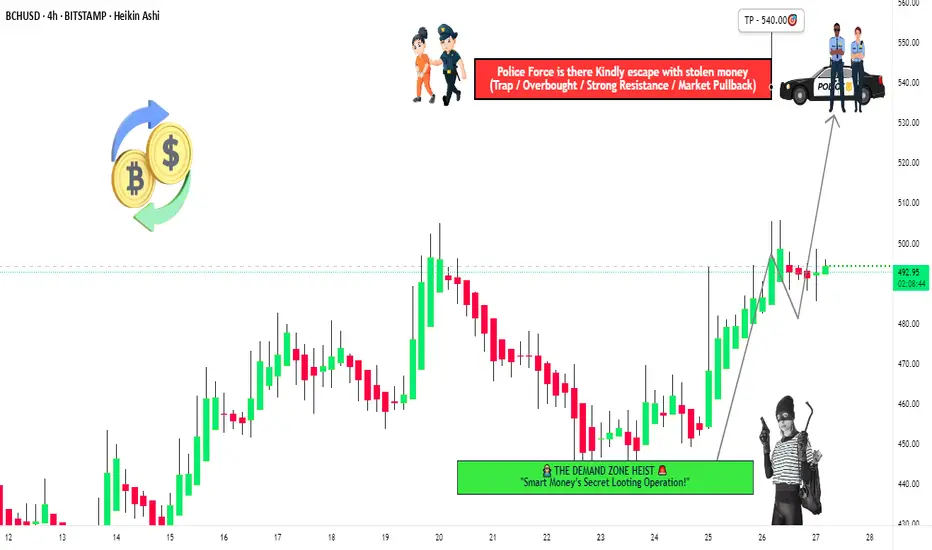
"BCH/USD Heist Mode: Enter Long, Exit Before Bears Strike!🚨 BCH/USD HEIST ALERT: Bullish Loot & Escape Plan! (Thief Trading Style) 🚨
🌟 Greetings, Market Bandits & Profit Pirates! 🌟
(Hola! Oi! Bonjour! Hallo! Marhaba!)
🔥 Mission Briefing:
Based on Thief Trading tactics (TA + FA), we’re plotting a bullish heist on BCH/USD. Time to swipe the loot & escape before the cops (bears) show up!
🔓 ENTRY: "The Vault is Open!"
📈 Buy Zone: Retest of recent low/high (15-30min timeframe).
💡 Pro Tip: Use limit orders for precision—don’t chase!
🛑 STOP LOSS: Live to Steal Another Day
📍 Thief SL: Recent swing low (~440.00 on 4H TF).
⚠️ Adjust based on your risk, lot size, & multi-order strategy.
🎯 TARGET: 540.00 (or Bail Early!)
🏴☠️ Escape before the red zone (overbought, reversal risk, bear traps!).
💰 "Take profit & treat yourself—you earned it!"
📢 WHY THIS HEIST? (Bullish Catalysts)
✅ Fundamentals: Strong macro + sentiment.
✅ Technicals: Pullback entry + bullish structure.
✅ Intermarket trends: Crypto momentum favors bulls.
(For full intel—COT reports, on-chain data, sentiment—check 👉🔗🔗!)
🚨 NEWS ALERT: Avoid the Police (Volatility Traps!)
🔹 Avoid new trades during high-impact news.
🔹 Trailing stops to lock profits & dodge reversals.
💥 BOOST THIS HEIST! (Let’s Get Rich Together!)
👍 Smash that "Like" & "Boost" button to fuel our next robbery!
🚀 Follow for daily heist plans—easy profits await!
See you at the next heist, bandits! 🤑💎
BTCUSDT[BITCOIN]:Price is Likely to be Heading Towards $144,000.Recently, Bitcoin has shown extreme bullish price behaviour, and there’s no sign of bearish influence in the market. After monitoring the price since May 4th, we believe there’s a high possibility of price hitting the 120k region first. This could be followed by a small correction around 105k, where a strong bullish price influence will lead the price to our final target at 140k. Both fundamental and technical factors support this view, but it doesn’t guarantee the price will follow our expectations.
Before investing or trading cryptocurrencies, do your own research as they carry significant financial risk. This chart analysis is for educational or secondary purposes only.
Good luck and trade safely.
If you want to support and encourage us, you can do the following: ❤️
-Like the idea
-Comment the idea
-Share ;)
Team Setupsfx_

#BITCOIN: Accumulated Volume, Time For $150,000Bitcoin has accumulated nicely, but we don’t expect the price to distribute strongly towards $150k. We have set two targets: 125k and a swing target at 150k. Remember to have a confirmation before entering.
Good luck and trade safely,
Team Setupsfx_

#BTCUSDT: Major Bearish Correction?Bitcoin is currently undergoing a correction following its recent peak. While the initial price decline appeared insignificant, it has since experienced a substantial drop, suggesting a substantial volume of selling activity in the market.
We anticipate two potential areas where the price could reverse and resume its upward trajectory. These areas could lead to a price of 110,000, followed by 120,000, and ultimately reaching 150,000.
We strongly recommend that you implement rigorous risk management measures and conduct your own analysis before making any investment decisions.
Best regards,
Team Setupsfx_

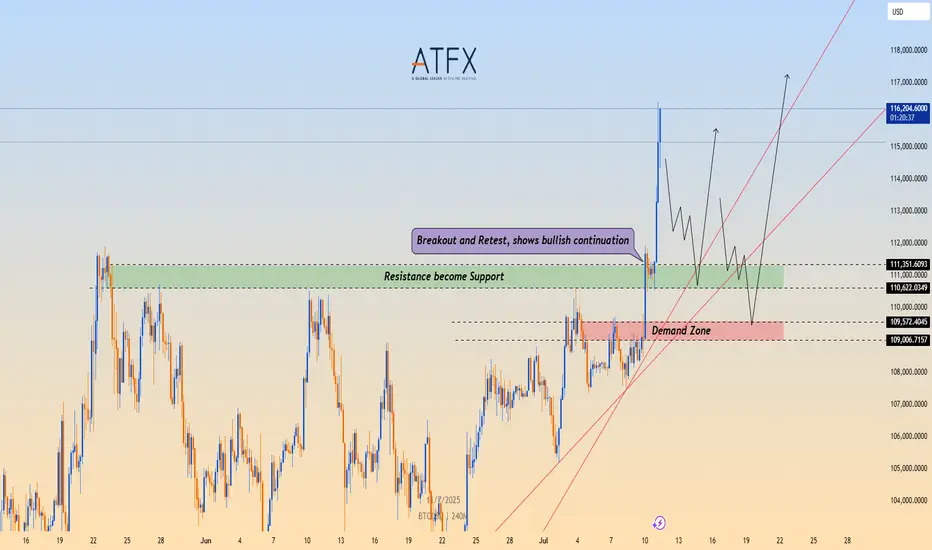
BTC/USD Breaks Out, Eyes Fresh Highs Above $116,000📉 Technical Structure
BITSTAMP:BTCUSD BTC/USD confirmed a bullish breakout above the $111,000–$111,350 resistance zone, which has now flipped into support. Price action shows a clean retest and bounce from this level, indicating a bullish continuation. Key support lies at the $110,600–$109,000 demand zone. If the price clears $116,800, bulls may target $118,000–$120,000 next.
📈 Long Trade Setup
Entry: $111,350
Stop Loss: $109,000
Take Profit 1: $116,800
Take Profit 2: $118,000
Invalidation: Break below $109,000 and trendline
🌐 Macro Background
BINANCE:BTCUSD Bitcoin rallied above $116,000 to a new all-time high after clearing the $111,000 resistance. The breakout was supported by strong momentum and optimism following a technical trendline breach. Despite some selling pressure and rising funding rates, the broader trend remains bullish. A sustained move above $116,800 could open the door toward $120,000.
📌 Key Technical Zones
Resistance: $116,800 / $118,000
Support: $110,622–$111,350, $109,006–$109,572
📘 Trade Summary
As long as BTC/USD remains above $111,350, the bullish structure is valid. Short-term pullbacks into the $109,006–$109,572 zone may offer buying opportunities.
⚠️ Disclaimer
This analysis is for informational purposes only and does not constitute investment advice.
#BTCUSDT: First $120,000 Then $140,000 Swing Move.Bitcoin has accumulated successfully and is currently on the verge of entering the next price zone, which is 120k, followed by 150k. There’s only one entry zone to consider. We’re confident that the price will move as planned, but it’s not guaranteed. Before taking entry, please conduct your own analysis.
If you like our work, please like, comment, and share.
Team Setupsfx_
❤️🚀

BTCUSDT:Sharing of the Latest Trading StrategyAll the trading signals last week have resulted in profits!!! Check it!!!👉👉👉
Bitcoin Technical Analysis (4-Hour Chart):
Price remains within an ascending channel. The MACD above the zero line with expanding red histograms indicates bullish dominance. After firmly breaking above the key resistance at $105,000, price is testing $110,000.
Caution: The RSI near 70 has entered overbought territory, increasing short-term pullback risks.
Support levels: $106,000 and $105,000.
Trading Recommendation for Aggressive Traders
Consider light long positions near $106,000 on pullbacks, with stop-loss set below $105,000.
Trading Strategy:
buy@105000-106000
TP:108000-110000

Thief Trader Setup: Robbing the BTC/USD Market Reversal🏴☠️💰 Bitcoin Heist Blueprint: BTC/USD Robbery Plan by the Thief Trader Crew 💰🏴☠️
(Swing & Day Trade Outlook – Clean Entry, Clean Exit, No Fingerprints Left Behind)
🌟 Hi! Hola! Ola! Bonjour! Hallo! Marhaba! 🌟
To All Market Raiders & Silent Money Makers 🤑💸💰✈️
This isn't your average BTC/USD analysis — this is a strategic market heist, crafted from the Thief Trading Playbook.
We're planning a clean operation based on both technical setups and fundamental awareness.
Let’s enter smart, exit faster, and leave no trace — just profit. 🏆
🎯 THE GAME PLAN: Unlocking the BTC/USD Vault
📈 Entry – “The Vault’s Cracked Open!”
The plan kicks off with retest entries on the 15 or 30-minute chart.
Sell limits should be placed around recent highs or lows where market momentum pulls back.
Precision and patience are your tools.
🛑 Stop Loss – Backup Escape Route
Use the 1D swing high/low (e.g., 104.500) as your SL zone.
Position size smartly, factoring in risk %, lot size, and number of active orders.
🏁 Target – 94.000 (Or Bail Out Before It Gets Hot)
Don’t stick around too long — cash out near the zone or before if price slows or traps emerge.
Secure the bag, vanish before resistance bites back.
🧲 Scalpers – Quick In, Quick Out!
Stick to the short side only — short the bounces, trail your SL, and move with stealth.
Big players can strike straight; others can shadow the swing crew and trail behind with protection.
🧠 Why This Works – Market Pulse
BTC/USD is facing overbought pressure, consolidation traps, and is nearing a critical MA Zone where reversals tend to form.
Momentum shows signs of weakening, and the bears are regrouping — that’s where we slip in and out.
Supporting Factors Include:
Macro trends
Fundamental sentiment
COT positioning
On-Chain signals
Intermarket flow
Key psychological levels
🔍 All these build the narrative behind this bearish setup. This is more than just price action — it's a calculated move.
⚠️ Trading Risk Alert: Stay Off the Radar During News Drops 📰🚨
Avoid new entries during major news events — increased volatility = increased risk.
Use trailing stop-losses to lock in profits while staying protected during spikes.
❤️ Like the Plan? Power the Crew!
If this setup helped you see the market differently, hit the 💥Boost Button💥.
Every like supports the effort and helps sharpen our future plans.
Trade with style, move with purpose — Thief Trader Style.
🚀 Stay tuned for the next setup from the shadows. Until then — stay sharp, stay strategic, and always protect your profits. 🐱👤💰📉📈

BTC/USD Technical Outlook – Potential Bearish Continuation BelowBTC/USD Technical Outlook – Potential Bearish Continuation Below Resistance 📉🧊
Chart Overview:
The chart illustrates a clear bearish rejection from a major resistance zone (⚠️ 110,000–111,000 USD), followed by the emergence of a bearish engulfing candle 🔻 marked in orange. This move suggests selling pressure has returned after a short-term bullish rally.
Key Zones & Levels:
🔵 Resistance Zone: 110,000–111,000 USD
Price was rejected from this region with a strong bearish reaction.
🟣 Mid-level Support: 105,531 USD
Currently acting as an interim level — if broken, it may lead to deeper declines.
🔵 Support Zone: 100,500–101,500 USD
This is the next strong demand area — price previously rebounded strongly from here.
Technical Signals:
✅ Double Top Structure formation at the resistance zone, indicating trend exhaustion.
❌ Bearish Engulfing Candle near resistance, confirming reversal strength.
📉 Downward Momentum Arrow suggests possible continuation toward support.
🔻 Lower Highs Formation reinforces bearish sentiment after failed breakout attempts.
Projection 🎯:
If the price closes below 105,531, a bearish continuation is likely, targeting the support zone at 101,000–100,500.
Conversely, a strong bounce above this level could delay the drop, but upside is capped below 110,000 unless a breakout occurs.
Summary:
🧭 Bias: Bearish below 105,531
📍 Targets:
Immediate: 105,531 (key level)
Bearish Target: 101,000
Invalidated if: price reclaims and closes above 110,000 with strength
📊 Trader's Note: Look for confirmation of breakdown with volume or candle close before short entry. Set tight risk management due to volatility.

Technical Analysis – BTC/USD Technical Analysis – BTC/USD
📅 Date: June 11, 2025
🔍 Key Observations:
🔴 Resistance Zone – $110,000 to $111,800
Price has tested this resistance block twice (🔴 red arrows) and rejected both times, indicating strong selling pressure in this zone.
Rejection candles show long upper wicks, suggesting failed attempts by bulls to break above.
🟢 Support Zone – $101,800 to $103,500
This demand zone has been respected multiple times (🟢 green arrows), showing a solid base for potential bounces.
Price action previously rallied strongly after touching this level.
📦 Supply to Demand Play
Price made a sharp bullish move from support to resistance (📘 blue box shows the impulsive move).
After reaching resistance, the price is failing to break above, indicating possible exhaustion of bullish momentum.
📉 Potential Move:
🔽 Short-Term Bearish Bias
If price fails to hold current levels and breaks below the small consolidation (after blue box), we may see a drop to ~$105,583 (🔵 purple line = key level).
If that breaks, next likely destination is the support zone around $102,000 (⬇️ downward arrow path).
⚠️ Risk Notes:
🔁 Watch for any false breakouts or liquidity grabs above resistance.
📉 If bearish momentum increases below $105,583, sellers may take control in the short term.
✅ Trade Idea (Hypothetical):
Sell/Short near resistance (⚠️ confirmation needed like bearish engulfing or failed breakout)
Target 1: $105,583
Target 2: $102,000 zone
Stop-loss: Above $111,800 (invalidates setup)
📌 Summary:
BTC/USD is currently stuck between a well-defined resistance and support range. Unless bulls break above $111,800 with strong momentum, the structure favors a potential pullback toward the demand zone. ⚖️

BTCUSD: 1M turned overbought and that's not alarming at all! Bitcoin has turned bullish even on its 1M technical outlook (RSI = 70.030, MACD = 16,156.720, ADX = 38.100) but that's not a reason to expect any strong corrections as this is the part were it technically rises more during Bull Cycles. The basic structure of the Cycle is an Ascending Triangle which breaks when the parabolic rallies begin. Based on the ratio of the last two Cycles, the new rally should be around +130% from the top of the Ascending Triandle. That gives a $160,000 fair estimate as far as the Cycle top is concerned.
## If you like our free content follow our profile to get more daily ideas. ##
## Comments and likes are greatly appreciated. ##

BTCUSD: 1D Golden Cross signals more upside to 155k.Bitcoin dropped below the overbought barrier on its 1D technical outlook (RSI = 69.592, MACD = 4447.700, ADX = 32.855) following today's Trump led pullback. On the long term though, this is nothing but a technical reaction to fundamentals and not enough to invalidate the bullish trend as not only did we make new ATH this week but also just completed a 1D Golden Cross. This is the first such pattern since October 27th 2024, which validated the previous bullish wave that peaked on the 2.0 Fibonacci extension. According to that, Bitcoin should extend the current uptrend with TP = 155,000.
## If you like our free content follow our profile to get more daily ideas. ##
## Comments and likes are greatly appreciated. ##

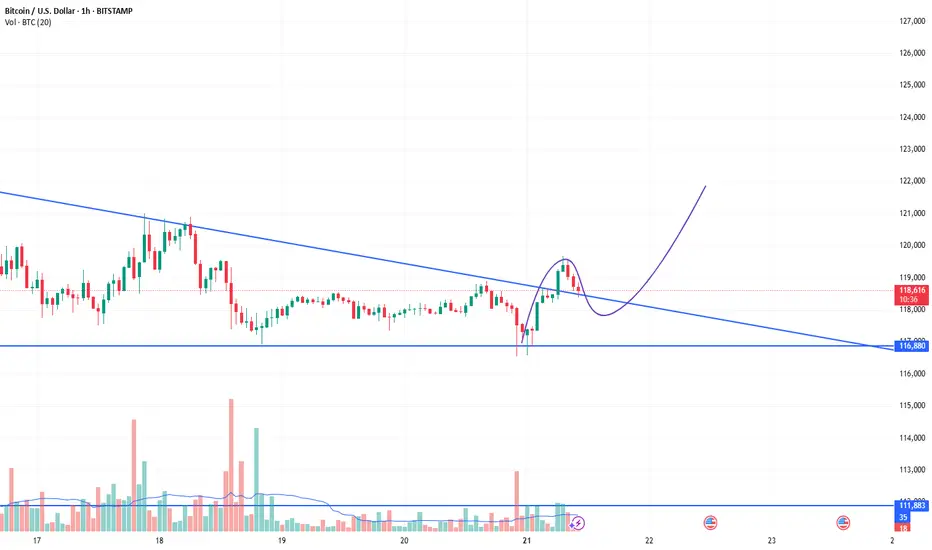
BTCUSD: Going for the decisive breakout that opens path to 155,0Bitcoin is almost overbought on its 1D technical outlook (RSI = 69.391, MACD = 3884.400, ADX = 20.801), which during rallies is the starting condition that fuels bullish breakouts and continuations. Such a breakout is about to take place right now as the price is on the LH trendline coming from the ATH. As this chart shows, once Bitcoin breaks over a LH trendline on this Cycle, it has always delivered (much) more upside. Assuming we are currently on the 0.5 Fibonacci level of that breakout, the pattern gives a TP = 155,000.
## If you like our free content follow our profile to get more daily ideas. ##
## Comments and likes are greatly appreciated. ##

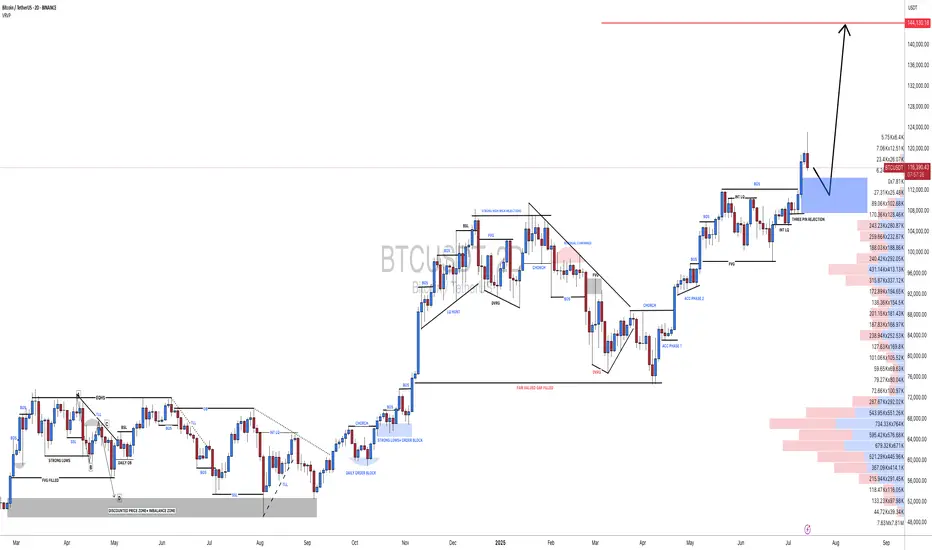
BTCUSD: is far away from its Sell Zone.Bitcoin remains overbought on its 1D technical outlook (RSI = 70.017, MACD = 4154.600, ADX = 16.535) but still in the middle of the Cycle's Channel Up. After a 1W MA50 rebound (April 7th) on the bottom quarter, it is aiming for the blue Sell Zone of the top quarter of the Channel Up where the last two tops were priced. A +93.64% rise has been the most common inside this pattern. Based on that the minimum TP for this run is 140,000.
## If you like our free content follow our profile to get more daily ideas. ##
## Comments and likes are greatly appreciated. ##
