Million challenge: Buy BTC @27K
In the short term, the rise of Bitcoin has been hindered and there has been a slight correction as the upward pressure is capped at 28,500. It has been emphasized in previous articles that 25K has become a short-term bottom, and the operation still considers buying on dips as the main strategy, with a target of 30K in mind.
I have already started a million-dollar challenge, where I will operate an account and aim to earn a profit of 10 million within a month. A viewing account will be provided to allow everyone to experience how large capital positions can generate profits in the market. Let's witness it together!
Btcusdtrading

BTCUSD- Upcoming Big Reversal on Bitcoin!!! hey everyone, BITCOIN spiked up due to collapsed of SVB BANK alongside gold, this is due to the uncertainty that market created. As we are looking for upcoming moves we are expecting prices to be bullish until 28k after we have where we believe that price will reject.
GOOD LUCK AND HAPPY TRADING.

BTC Bearish Market Continuation As expected, after the FED's meeting Bitcoin and the crypto market as a whole is now bearish. BTC hit the first target I had which was $26,940. Now with it retracing I'm waiting for a trend line break to the downside to enter into the market. My next target for Bitcoin will be at the FIB D Extension at $25,214 . Will update once target is hit. Happy Trading!

BTC/USD 4HBitcoin hanging on by a thread on the 4H time frame. I'm expecting further downside on the 4H but accumulation on higher time frames resulting in a lower high. Expect the alts to follow the trend even YFI looks like it's ready to drop.

Has the BTC's decline finally ended?
Following the release of the US NFP and unemployment rate data on Friday, BTC saw a small rebound and is currently trading steadily above 20K. In the short term, it tested support near 19500, and institutional orders continue to suppress BTC prices. Market sentiment remains bearish, and overall trend is sluggish. Some predict that the future trend will fall below 10K, but we will not comment much on these predictions.
As I mentioned in a previous article, I have been buying BTC continuously below 20K, and I am currently making a small profit. However, many traders who are bearish on BTC have questioned my strategy. Unfortunately, currently, 80% of the market does not expect BTC to rise in the future due to the large decline that has caused many to lose confidence and shift their outlook from bullish to bearish. However, what I want to say is that the market can only show you what it wants you to see.
The significant decline is obviously a large-scale sell-off and washout by the main players, hoping to clear out all long positions and wait until the market believes that there will be no more increase before starting to rebound. My strategy is to continue to build up my position at low levels. However, it is clear that the current decline has not ended yet, and there may be another wave of decline to make more people believe in the strength of the bears before ultimately forming a reversal and catching most people off guard. I will continue to update my long-term strategy, which requires a significant amount of capital and a good mindset to follow the main players. You may have a different opinion, but we let time witness the outcome. Please stay tuned, and I will update my strategy in a timely manner.

Bitcoin: Short first, then long.
Despite the fact that the Bitcoin (BTC) price trend should have been boosted last week from the perspective of the US dollar and risk appetite, unfortunately, the cryptocurrency market experienced negative news. According to reports, cryptocurrency bank Silvergate announced that it will postpone the submission of its annual 10-K report for the 2022 fiscal year, stating that "the company is currently analyzing certain regulatory inquiries and investigations related to the company." Shortly after, many cryptocurrency companies and trading platforms, including Coinbase, Circle, and Tether, urgently announced the termination of their business dealings with Silvergate. The news caused panic in the cryptocurrency market and put pressure on Bitcoin prices.
This week's risk events are also relatively frequent, and I think the likelihood of short-term Bitcoin prices rising above 25000 is small. From the 4-hour chart, we can see that the starting point of the last rebound has been breached, so the support level is expected to move down to around 21460. Therefore, the short-term trading range is around 22040-21460.
In terms of operation strategy, investors can trade within this range of 22040-21460.
Liking, commenting, and subscribing are your greatest encouragement to me. Follow me to make trading easier! You are also welcome to read other ideas below.
BINANCE:BTCUSDT COINBASE:BTCUSD

BTCUSDTBINANCE:BTCUSDT
Although I am an investor in Bitcoin, but my experience in technical analysis says that Bitcoin in fundamental analysis and technical analysis also, unfortunately, is bearish.

BTC:Wait for the turning point
Bitcoin is currently in its third consecutive week of decline and has fallen below the 22,000 support level. Given Federal Reserve Chairman Powell's suggestion that interest rates are likely to continue to rise in the foreseeable future, Bitcoin's price has broken below its previous resistance and hit a low of 21,598 US dollars.
As the semi-annual monetary policy statement continues to affect market sentiment, both fundamental and technical factors have contributed to the price trend of Bitcoin. Higher interest rates have a negative impact on risk assets, including major cryptocurrencies, because holding cryptocurrencies does not generate interest income.
As the commodity channel index (CCI) falls into negative territory, technical indicators suggest that Bitcoin may already be oversold. However, as Bitcoin's price lingers around the next psychological support level of 22,000, breaking below this level could further tilt the price downward. The 21,376 US dollar support level from February lows could become the next support level, but it may also be a new turning point. Nevertheless, it must be admitted that breaking this level could bring market attention back to the 20,000 US dollar level. Therefore, it is advisable to maintain a light position in trading.
I have in-depth research on futures products such as cryptocurrencies, foreign exchange, stocks, gold, and crude oil, and I also update some daily trading layouts. Thank you for your attention and likes. If you have any questions, feel free to leave me a message, and I will give you the most prudent advice. I hope I can help you.

BTCUSDT Must Have Run! Despite everyone, I am thinking of Short!According to classical analysis we reached the bottom of ascending channel and we should look for upward run!
But as you see in chart, my own developed indicator based on blocks, support and resistance and some other data which is showing the probability of next movement ; indicates that we should face downward for future prices and I believe in what I was developed and coded based on my experience and knowledge of market analysis which I want to share it with you also!
Anyway,
Max upward price : 23200 - 23300 and reaching more than these prices means going to break 25500 and 26000
Break Bullish Block : 21700 - 21500 means going down to 18800 and if more 16600 and even more 15300
Not a special advice for trading just as student of financial market experienced ...

BTCUSD SHORT TERM VIEW BTCUSD Short Term View is given
Entry is on 24,853
SL is at 25,243
Target is at 23,865
This view is based on pure technical analysis and is for educational purpose only.

Intraday SELL Bitcoin (21 FEB 2023)BTCUSD intraday trading alert
3 simple steps to find a quality setup !
Risk Reward Ratio 1: 2
Anyone same idea with me?
SELL Bitcoin
Good luck traders..

BTCUSD 5mins scalping long entryHello traders,
This is my second post today. Now we will look at COINBASE:BTCUSD . After waiting for a long time today, I finally missed the 5mins shorting opportunity as I was away from the system. But it met my profit target as I expected. But even if that opportunity is gone, now there is another opportunity to take a long entry from 24079.50 to 24291.00 . If this entry is suitable for you then analyze and get down to the long trade.
Trade according to your qualifications
Thanks & Regards,
Alpha Trading Station
Disclaimer: This view is for educational purpose only & any stock mentioned here should not be taken as a trading/investing advice. We may or may not have position in the stocks mentioned here. Please consult your financial advisor before investing. Because Price is the "King of Market".

BTC - Short strategyBYBIT:BTCUSDT.P
4h time frame
-
BTC did a pump after announcing CPI, but still faces the structural resistance (22350~22500)
According to last BTC analysis, we can set final TP at 20900 which is a nice support level to form an inverse HS.
-
Entry: 22350~22500
TP: 21200, 20900
SL: if successfully break up this DC(Descending channel)

BTC - Reached our targets! What's next?4h time frame / 1D time frame
-
BTC perfectly hit the 2nd target that we posted on Feb 9th
-
The important thing is taking partial profits here.
Next, the structural is around 20850~21200, if we can get valid support there, then an inverse HS is forming.

Bitcoin Healthy retracement before the next leg higherLooking for a pullback between the next monthly & weekly closure supports around
$20905 & $20490
Beautiful 0.382 fib support as well !

#BTC BREKOUT BULLISH FLAG PATTERN!Hi guys, This is CryptoMojo, One of the most active trading view authors and fastest-growing communities.
Consider following me for the latest updates and Long /Short calls on almost every exchange.
I post short mid and long-term trade setups too.
Let’s get to the chart!
I have tried my best to bring the best possible outcome to this chart, Do not consider financial advice.
#BTC
In the shorter time frame, BTC breakout this bullish flag pattern add retested it also according to the pattern Tactically we can expect a 10% bounce.
We have 21, 500 as strong resistance
Let’s see how the market reacts in a few hours.
Analysis in the higher time frame
- I have taken fractals from the past, 2019, from historical price action that we refer to as an 'echo bubble'.
- According to the fractals, one possible scenario is that we tap $14k, before making a 100% move up to $28k.
- This would be a completely reasonable trajectory to have in mind, considering that we have seen a case for Bitcoin moving from $4k to $14k
- Eventually, we would peak around the summer of 2023, with everyone thinking that the macro bull market has resumed.
- Personally, if this speculative scenario plays out, I would revert back to holding a massive cash position until the dust settles again.
- People, including myself, thought we'd never get back below 20k, and here we are now, with people calling for $7k.
Comment your view in the comment section and stay tuned, I will keep updating BTC in the different time frames.
This chart is likely to help you make better trade decisions if it does consider upvoting it.
I would also love to know your charts and views in the comment section.
Thank you

BTC HTF levels for 2023BTC HTF levels for 2023 and beyond. Gonna be a rough year imo but I wanna see a sweep of red to really go all in on crypto.

Btcust Wyckoff Accumulation Setup bull run 14k+ or 13.5k+Btcust Wyckoff Accumulation Setup
bitcoin also completed Accumulation Phases A,B, so now we are in Are Of Accumulation Phase C ..
our spring Area will be 14k or 13.6k+
after retest we can Buy or hold Bitcoin ..
PS—preliminary support, where substantial buying begins to provide pronounced support after a prolonged down-move. Volume increases and price spread widens, signaling that the down-move may be approaching its end.
SC—selling climax, the point at which widening spread and selling pressure usually climaxes and heavy or panicky selling by the public is being absorbed by larger professional interests at or near a bottom. Often price will close well off the low in a SC, reflecting the buying by these large interests.
AR—automatic rally, which occurs because intense selling pressure has greatly diminished. A wave of buying easily pushes prices up; this is further fueled by short covering. The high of this rally will help define the upper boundary of an accumulation TR.
ST—secondary test, in which price revisits the area of the SC to test the supply/demand balance at these levels. If a bottom is to be confirmed, volume and price spread should be significantly diminished as the market approaches support in the area of the SC. It is common to have multiple STs after a SC.
Note: Springs or shakeouts usually occur late within a TR and allow the stock’s dominant players to make a definitive test of available supply before a markup campaign unfolds. A “spring” takes price below the low of the TR and then reverses to close within the TR; this action allows large interests to mislead the public about the future trend direction and to acquire additional shares at bargain prices. A terminal shakeout at the end of an accumulation TR is like a spring on steroids. Shakeouts may also occur once a price advance has started, with rapid downward movement intended to induce retail traders and investors in long positions to sell their shares to large operators. However, springs and terminal shakeouts are not required elements: Accumulation Schematic 1 depicts a spring, while Accumulation Schematic 2 shows a TR without a spring.
Test—Large operators always test the market for supply throughout a TR (e.g., STs and springs) and at key points during a price advance. If considerable supply emerges on a test, the market is often not ready to be marked up. A spring is often followed by one or more tests; a successful test (indicating that further price increases will follow) typically makes a higher low on lesser volume.
SOS—sign of strength, a price advance on increasing spread and relatively higher volume. Often a SOS takes place after a spring, validating the analyst’s interpretation of that prior action.
LPS—last point of support, the low point of a reaction or pullback after a SOS. Backing up to an LPS means a pullback to support that was formerly resistance, on diminished spread and volume. On some charts, there may be more than one LPS, despite the ostensibly singular precision of this term.
BU—“back-up”. This term is short-hand for a colorful metaphor coined by Robert Evans, one of the leading teachers of the Wyckoff method from the 1930s to the 1960s. Evans analogized the SOS to a “jump across the creek” of price resistance, and the “back up to the creek” represented both short-term profit-taking and a test for additional supply around the area of resistance. A back-up is a common structural element preceding a more substantial price mark-up, and can take on a variety of forms, including a simple pullback or a new TR at a higher level.

BTCUSDT ShortThe price is currently forming a ranging pattern.
I anticipate that the bearish momentum is still building up, and the price will break out forming a bearish pattern.
My entry price is 17000, with Targets at 16500, 16000, 15500 and 15000.
My stop loss is at 17500 and target R:R is 1:4
Remember, risk only 1-2 % of your account.

BTCUSDT analysis crypto 28/11/2022Market respect our yellow correction LVL for the yellow sequence , also the market interact with the green correction LVL for the bearish green sequence , we will keep waiting the market for setting the bullish way for trading


BTCUSDT
Bitcoin support levels - 20500$ and 20000$ strong Support (is Ka Matlab yahan buyers hain)
Bitcoin resistance - $21300$ and 21900$ strong resistance (is Ka Matlab k yahan sell karney walay hain, sell hoga bitcoin)
Bitcoin per market depend karti hain tu ap ko update de di hai - is k according plan apko khud karna hai AB kiya karna hai apna funds k sath.
———————————————————————
After getting rejection from 50 EMA on daily timeframe, Bitcoin is trying to test the resistance again therefore we need to see bitcoin's upcoming movement, Bitcoin would have higher probabilities to move to the upside if Bitcoin closes above 50 EMA on daily chart. Bitcoin dominance is going down which was the reason altcoins performed better than bitcoin.
#BTC UPDATE Hi guys, This is CryptoMojo, One of the most active trading view authors and fastest-growing communities.
Consider following me for the latest updates and Long /Short calls on almost every exchange.
I post short mid and long-term trade setups too.
Let’s get to the chart!
I have tried my best to bring the best possible outcome to this chart, Do not consider financial advice.
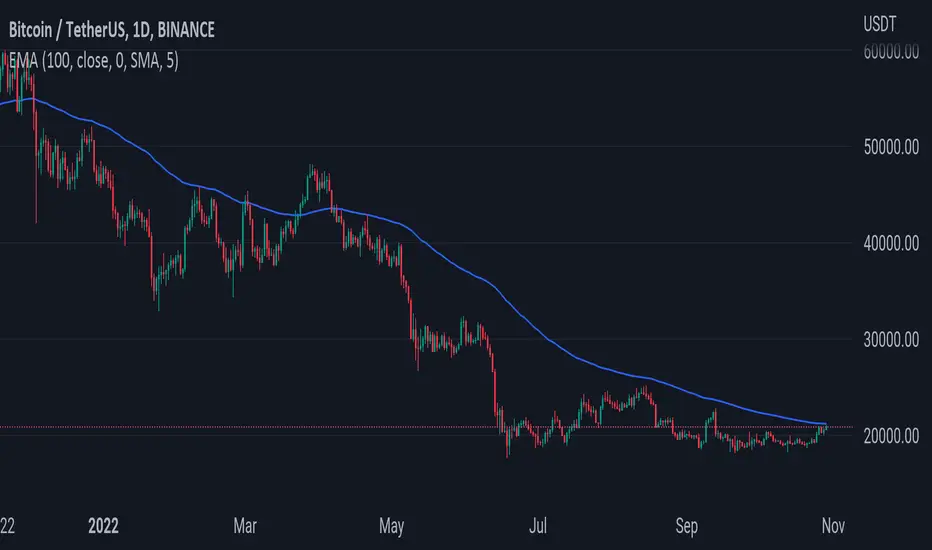
#BTC Update
BTC breakout this local support which is around the $20300 level and currently BTC facing 100 ma as resistance
if we break out this 100 ma resistance and closer the daily candle above it then the price of BTC may rise to 24.7K$.
This chart is likely to help you make better trade decisions if it does consider upvoting it.
I would also love to know your charts and views in the comment section.
Thank you
