BTC:Today's Profit-making StrategyThe price of BTCUSDT has been moving steadily for many days and is now forming a potential bullish continuation setup.
A retracement to the 86,500 area is expected. If the price respects this area and shows a bullish reaction, a long - position opportunity emerges.
BTC Trading strategy:
buy@86500
TP:87500-88500
Get daily trading signals that ensure continuous profits! With an astonishing 90% accuracy rate, I'm the record - holder of an 800% monthly return. Click the link below the article to obtain accurate signals now!
Btcusdtrading

BTC:Today's trading strategyBitcoin is currently in a continuous fluctuating situation. Yesterday's temporary rally also indicates that it is still unable to break through the resistance level of 89,000 for the time being, and there is a downward extension trend.
The strategy of shorting at the high level yesterday has already yielded profits. Today, on the rebound at a high level, continue to take short positions.
BTC Trading strategy:
Sell@88000-88500
TP1:85500
TP2:84000
Get daily trading signals that ensure continuous profits! With an astonishing 90% accuracy rate, I'm the record - holder of an 800% monthly return. Click the link below the article to obtain accurate signals now!

BTCUSD:BTCUSD: SHORT, TP86600-85600BTCUSD now has an obvious double-head pattern, and the short opportunity is worth a try. There is support near 86600, followed by 85800. These can be used as two targets. If the support is strong during the fluctuation process, the order can be closed in advance.

BTCUSD: ShortToday's bulls have won a great victory. After completing the target of 86K, the targets near 87K and 88K have also been achieved. The current indicator forms a short position. It should fluctuate and fall near 88K, so the transaction can be mainly short.

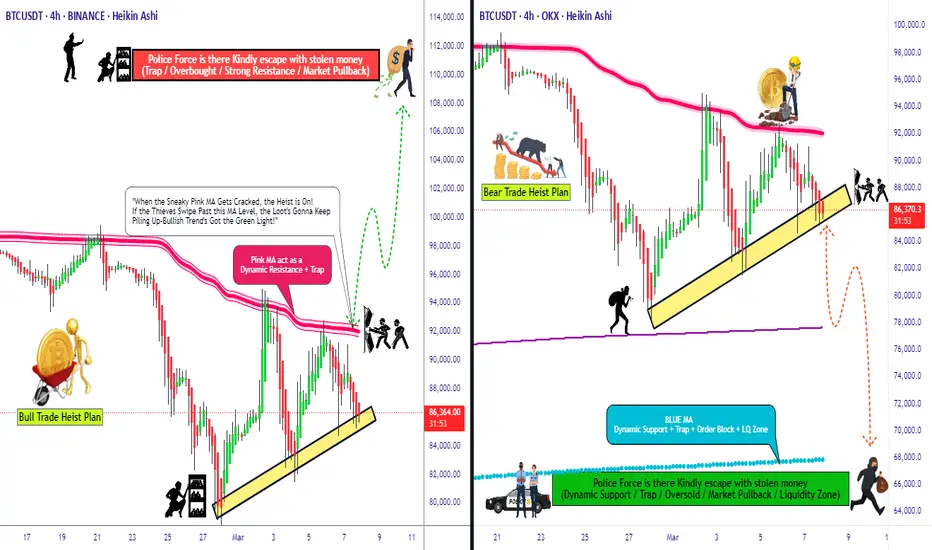
BTC/USDT "Bitcoin vs Tether" Crypto Market Bearish Heist Plan🌟Hi! Hola! Ola! Bonjour! Hallo!🌟
Dear Money Makers & Robbers, 🤑 💰🐱👤🐱🏍
Based on 🔥Thief Trading style technical and fundamental analysis🔥, here is our master plan to heist the BTC/USDT "Bitcoin Tether" Crypto Market. Please adhere to the strategy I've outlined in the chart, which emphasizes short entry. Our aim is the high-risk Green Zone. Risky level, oversold market, consolidation, trend reversal, trap at the level where traders and bullish robbers are stronger. 🏆💸Book Profits Be wealthy and safe trade.💪🏆🎉
Entry 📈 : The heist is on! Wait for the breakout of (80000) then make your move - Bearish profits await!"
however I advise placing Sell stop below the MA line or Sell limit orders within a 15 or 30 minute timeframe. Entry from the most recent or closest low or high level should be in swing/retest.
📌I strongly advise you to set an alert on your chart so you can see when the breakout entry occurs.
Stop Loss 🛑: Thief SL placed at (84000) swing Trade Basis Using the 4H period, the recent / swing high or low level.
SL is based on your risk of the trade, lot size and how many multiple orders you have to take.
Target 🎯: 68000 (or) Escape Before the Target
🧲Scalpers, take note 👀 : only scalp on the Short side. If you have a lot of money, you can go straight away; if not, you can join swing traders and carry out the robbery plan. Use trailing SL to safeguard your money 💰.
📰🗞️Fundamental, Macro, COT Report, On Chain Analysis, Quantitative Analysis, Intermarket Analysis, Sentimental Outlook:
The BTC/USDT "Bitcoin Tether" Crypto Market is currently experiencing a Neutral trend (there is a higher chance for Bearishness).., driven by several key factors.
⭐Fundamental Analysis
Fundamental analysis assesses Bitcoin's core metrics and market position. Here are the key factors:
Market Capitalization: Approximately 1.68 trillion USD, calculated using the circulating supply of 19.83 million BTC multiplied by the current price of 85,000 USDT. This reflects Bitcoin’s significant presence in the crypto market.
Trading Volume (24h): Around 31.44 billion USD, indicating robust liquidity and active trading activity over the past day.
Circulating Supply: 19.83 million BTC, out of a maximum supply of 21 million BTC, meaning 94.4% of the total supply is already in circulation.
Price Context: Bitcoin’s current price of 85,000 USDT is below its all-time high of 109,356 USD (reached on January 20, 2025), suggesting it is in a corrective phase but still well above historical lows (e.g., 2 USD on October 20, 2011).
Key Insight: Bitcoin’s fundamentals remain strong with a high market cap and active trading volume, but the price being below its recent peak indicates potential vulnerability or a consolidation period.
⭐Macroeconomic Factors
Macroeconomic conditions influence Bitcoin’s price as a global asset. Here are the relevant factors:
Global GDP Growth: Forecasted at 3.0% to 3.3% for 2025, suggesting moderate economic expansion worldwide. This level of growth may support risk assets like Bitcoin but isn’t strong enough to trigger significant inflation concerns.
Commodity Prices: Expected to decline by 5% in 2025, potentially reducing Bitcoin’s appeal as an inflation hedge since falling commodity prices signal lower inflationary pressure.
Stock Market Performance: U.S. stock indices are up 5% year-to-date (YTD) as of early 2025, reflecting a positive risk-on sentiment that often correlates with Bitcoin’s performance as a speculative asset.
Interest Rate Policies: The U.S. Federal Reserve is anticipated to cut interest rates in 2025, which could weaken the USD and make Bitcoin more attractive relative to USDT (a USD-pegged stablecoin). Conversely, the Bank of Japan may raise rates, though this has a limited direct impact on BTC/USDT.
Key Insight: Macroeconomic conditions are mixed—declining commodity prices may dampen Bitcoin’s inflation-hedge narrative, but stock market gains and potential Fed rate cuts could bolster its price.
⭐Global Market Analysis
Global market trends and events provide context for BTC/USDT’s performance:
Geopolitical Events: No significant geopolitical tensions are currently reported as of March 5, 2025. This reduces demand for Bitcoin as a safe-haven asset, unlike during periods of global unrest.
Central Bank Policies:
Federal Reserve: Expected rate cuts could weaken the USD, potentially driving BTC/USDT higher as investors seek alternatives.
Bank of Japan: Anticipated rate hikes may strengthen the JPY, but this has minimal direct influence on BTC/USDT unless it triggers broader currency shifts.
Commodity Trends: A projected 5% decline in commodity prices may ease inflation fears, indirectly reducing Bitcoin’s appeal as a store of value.
Global Risk Sentiment: Mixed stock market performance globally suggests a neutral stance on risk assets, with no strong directional push for Bitcoin.
Key Insight: Without major geopolitical catalysts, Bitcoin’s price may hinge on central bank actions, particularly Fed rate cuts that could weaken the USD and support BTC/USDT.
⭐Commitment of Traders (COT) Data
COT data offers insights into large trader positions, though specific BTC/USDT COT reports are not directly available. Here’s an inferred analysis:
Technical Ratings: Current indicators for BTC/USDT show a “sell” signal, with oscillators (e.g., RSI, MACD) and moving averages (e.g., 50-day, 200-day) trending strongly bearish.
Trader Positioning: The bearish technical outlook suggests large traders (e.g., speculators) are likely net short, anticipating further price declines.
Market Implications: This positioning could amplify downward pressure if selling continues, though a reversal in sentiment could trigger a short squeeze.
Key Insight: The inferred COT data points to bearish sentiment among large traders, aligning with technical signals and suggesting a downward bias.
⭐On-Chain Analysis
On-chain data reflects Bitcoin’s blockchain activity and holder behavior:
Unmoved BTC: Approximately 151,000 BTC, acquired at an average price of 97,800 USDT, has not moved despite recent volatility. This indicates strong conviction among holders at higher levels, potentially acting as resistance.
Accumulation Patterns: Some accumulation occurred near 83,000 USDT, suggesting buying interest at lower levels. However, rapid selling has dominated, with one-third of BTC accumulated between 96,000–97,500 USDT redistributed during the recent decline.
Supply Concentrations: Thin supply exists between 93,000 and 83,000 USDT, with notable clusters at 84,200 USDT (23,000 BTC), 86,900 USDT (25,800 BTC), and 88,900 USDT (46,000 BTC), indicating key price levels where holders may act.
Key Insight: On-chain data shows a mix of strong holding at higher prices and selling pressure at current levels, hinting at capitulation but also potential support forming near 83,000–85,000 USDT.
⭐Market Sentiment Analysis
Market sentiment reflects trader and investor psychology:
Social Media Sentiment: Posts on platforms like X reveal a split outlook—some traders predict a drop to 75,000–73,000 USDT, citing technical weakness, while others see a potential bullish reversal if support holds.
Sentiment Index: Total positive sentiment is estimated at 0.75 (on a scale from -1 to 1), suggesting moderate optimism despite recent declines.
Fear and Greed Index: Specific data is unavailable, but the mixed sentiment aligns with a neutral-to-slightly bullish stance.
Key Insight: Sentiment is mixed but leans slightly bullish, indicating cautious optimism amid uncertainty.
⭐Positioning
Positioning reflects how traders are aligned in the market:
Speculative Positions: Likely net short, inferred from bearish technical signals and COT-like trends, suggesting traders are betting on a decline.
Institutional Positioning: Hedge funds have increased exposure to Bitcoin ETFs, indicating growing long-term interest that could counterbalance short-term selling.
Market Dynamics: Short positions may dominate near-term price action, but institutional buying could stabilize or reverse the trend.
Key Insight: Short-term bearish positioning contrasts with potential long-term bullish institutional interest.
⭐Next Trend Move
The next likely price movement is based on current data:
Direction: Downward pressure is favored, driven by technical sell signals and bearish positioning.
Key Levels:
Support: 80,000 USDT; if breached, 75,000–73,000 USDT becomes the next target.
Resistance: 95,000 USDT, a level that would need to be overcome for a bullish reversal.
Triggers: A break below 80,000 USDT could accelerate selling, while holding above 85,000 USDT might signal stabilization.
Key Insight: The next trend move likely tests lower support levels, with a potential drop to 75,000–73,000 USDT if momentum persists.
⭐Other Data
Additional factors impacting BTC/USDT:
Institutional Adoption: Hedge funds are increasing exposure to Bitcoin ETFs, a bullish signal for long-term price support as institutional capital flows in.
Regulatory Changes: The SEC’s employee buyout program in 2025 could lead to shifts in crypto regulation, introducing uncertainty and potential volatility.
Market Trends: Bitcoin’s limited supply (21 million BTC cap) and growing mainstream acceptance bolster its long-term value proposition.
Key Insight: Institutional interest is a positive wildcard, but regulatory uncertainty could shake confidence in the near term.
⭐Overall Summary Outlook
Overview: On March 5, 2025, BTC/USDT at 85,000 USDT exhibits a cautiously bearish outlook. Technical sell signals, bearish trader positioning, and recent on-chain selling pressure point to downside risks. However, strong holding behavior at higher levels (e.g., 97,800 USDT), potential institutional support via ETF exposure, and a slightly bullish market sentiment suggest a reversal is possible if support holds. Macroeconomic factors like expected Fed rate cuts could weaken the USD and provide tailwinds, though declining commodity prices may temper Bitcoin’s inflation-hedge appeal. Risks include a drop below 80,000 USDT or volatility from regulatory shifts.
📌Keep in mind that these factors can change rapidly, and it's essential to stay up-to-date with market developments and adjust your analysis accordingly.
⚠️Trading Alert : News Releases and Position Management 📰 🗞️ 🚫🚏
As a reminder, news releases can have a significant impact on market prices and volatility. To minimize potential losses and protect your running positions,
we recommend the following:
Avoid taking new trades during news releases
Use trailing stop-loss orders to protect your running positions and lock in profits
💖Supporting our robbery plan 💥Hit the Boost Button💥 will enable us to effortlessly make and steal money 💰💵. Boost the strength of our robbery team. Every day in this market make money with ease by using the Thief Trading Style.🏆💪🤝❤️🎉🚀
I'll see you soon with another heist plan, so stay tuned 🤑🐱👤🤗🤩

BTC/USD "Bitcoin vs Tether" Crypto Market Heist Plan🌟Hi! Hola! Ola! Bonjour! Hallo! Marhaba!🌟
Dear Money Makers & Robbers, 🤑💰✈️
Based on 🔥Thief Trading style technical and fundamental analysis🔥, here is our master plan to heist the BTC/USD "Bitcoin vs Tether" Crypto market. Please adhere to the strategy I've outlined in the chart, which emphasizes long entry and short entry. 🏆💸Be wealthy and safe trade.💪🏆🎉
Entry 📈 :
"The loot's within reach! Wait for the breakout, then grab your share - whether you're a Bullish thief or a Bearish bandit!"
🏁Buy entry above 93000
🏁Sell Entry below 84000
📌However, I recommended to place buy stop for bullish side and sell stop for bearish side.
Stop Loss 🛑:
🚩Thief SL placed at 88000 (swing Trade Basis) for Bullish Trade
🚩Thief SL placed at 92000 (swing Trade Basis) for Bearish Trade
Using the 4H period, the recent / swing low or high level.
SL is based on your risk of the trade, lot size and how many multiple orders you have to take.
Target 🎯:
🏴☠️Bullish Robbers TP 11000 (or) Escape Before the Target
🏴☠️Bearish Robbers TP 68000 (or) Escape Before the Target
📰🗞️Fundamental, Macro, COT Report, On Chain Analysis, Sentimental Outlook, Intermarket Analysis, Future Prediction:
BTC/USD "Bitcoin vs Tether" Crypto market is currently experiencing a Neutral Trend (slightly Bearish🐼),., driven by several key factors.
1. Fundamental Analysis⭐⚡🌟
Fundamental analysis evaluates Bitcoin’s intrinsic drivers:
Adoption Trends:
Institutional inflows via Bitcoin ETFs remain strong, with $1.5 billion added in Q1 2025. MicroStrategy holds 300,000 BTC, reinforcing corporate adoption—bullish.
Regulatory Environment:
The U.S. signals a pro-crypto stance with talks of a strategic Bitcoin reserve, boosting confidence—bullish. However, global regulatory uncertainty (e.g., EU tax proposals) adds mild bearish pressure.
Halving Impact:
Post-2024 halving (April), supply issuance dropped to 450 BTC/day. Historical patterns suggest price appreciation 12-18 months later, supporting a bullish outlook for 2025.
Network Usage:
Transaction volume is up 10% year-over-year, driven by Layer 2 solutions (e.g., Lightning Network)—bullish for utility and value.
Inflation Hedge Narrative:
With U.S. inflation at 3.0%, Bitcoin’s appeal as a store of value grows—bullish, though tempered by short-term risk-off sentiment.
Detailed Explanation: Fundamentals are strongly bullish long-term due to adoption, supply scarcity, and macro trends. Short-term bearish pressures from regulatory uncertainty and profit-taking explain the current dip to 87,000.
2. Macroeconomic Factors⭐⚡🌟
Macroeconomic conditions influencing BTC/USD:
U.S. Economy:
Fed rates at 3.0% with no immediate cuts signal tighter conditions—bearish short-term as capital favors yield-bearing assets.
Unemployment steady at 4.2% supports economic stability—neutral.
Global Growth:
China’s GDP growth slows to 4.2%, reducing demand for risk assets like Bitcoin—bearish.
Eurozone PMI at 47.8 indicates contraction, pressuring global markets—bearish.
Currency Markets:
USD strength (DXY at 106) weighs on BTC/USD, as a stronger dollar reduces Bitcoin’s appeal—bearish short-term.
Commodity Prices:
Oil at $68/bbl and gold at $2,950 reflect a mixed risk environment—neutral for Bitcoin.
Geopolitical Risk:
Middle East tensions elevate safe-haven demand, but Bitcoin’s correlation with gold is weakening—neutral to mildly bearish.
Detailed Explanation: Macro factors tilt bearish short-term due to USD strength and global slowdown, countering Bitcoin’s long-term bullish fundamentals. This tension explains the current downward trend from higher levels.
3. Commitments of Traders (COT) Data⭐⚡🌟
COT data reflects futures positioning:
Speculative Traders:
Net long positions at 15,000 contracts, down from 25,000 at the 95,000 peak. Reduced bullishness suggests caution—bearish signal.
Commercial Hedgers:
Net short at 20,000 contracts, stable. Hedgers locking in gains indicate no panic—neutral.
Open Interest:
45,000 contracts, down 10% from February highs. Declining participation hints at fading momentum—bearish.
Detailed Explanation: COT data supports a bearish short-term view. Speculators unwinding longs and falling open interest align with the downward trend, though hedgers’ stability prevents a sharper collapse.
4. On-Chain Analysis⭐⚡🌟
On-chain metrics provide insights into Bitcoin’s network activity:
Exchange Balances:
2.6 million BTC on exchanges, up 5% in March. Rising supply suggests selling pressure—bearish.
Transaction Volume:
Daily volume at $10 billion, flat month-over-month. Lack of growth signals reduced buying interest—neutral to bearish.
HODLing Behavior:
70% of BTC unmoved for over a year (13.8 million coins). Strong holder conviction limits downside—bullish long-term.
Miner Activity:
Miners hold 1.8 million BTC, with minimal outflows. Stable miner behavior supports price floors—mildly bullish.
Realized Price Levels:
Realized cap indicates a cost basis of 78,000 for recent buyers, acting as support—bullish if held.
Detailed Explanation: On-chain data is mixed. Short-term bearish signals from exchange inflows contrast with long-term bullishness from HODLing and miner stability, suggesting a correction rather than a collapse.
5. Intermarket Analysis⭐⚡🌟
Correlations with other markets:
USD Strength:
DXY at 106 pressures BTC/USD inversely—bearish short-term.
S&P 500:
At 5,900, down 2% this week, reflecting risk-off sentiment. Bitcoin’s 0.6 correlation with equities adds downward pressure—bearish.
Gold:
At $2,950, gold rises as a safe haven, decoupling from Bitcoin—neutral to bearish.
Bond Yields:
U.S. 10-year yields at 3.8% attract capital away from risk assets—bearish.
Altcoins:
ETH/BTC ratio at 0.035, with altcoins underperforming Bitcoin, reinforcing BTC’s relative strength—mildly bullish.
Detailed Explanation: Intermarket signals are bearish short-term due to USD strength, equity declines, and yield competition. Bitcoin’s resilience versus altcoins offers some support, but broader risk-off trends dominate.
6. Market Sentiment Analysis⭐⚡🌟
Investor and trader mood:
Retail Sentiment:
Social media analysis shows 45% bullish sentiment, down from 60% at 95,000. Fear of further drops prevails—bearish.
Analyst Views:
Consensus targets range from 80,000 (short-term support) to 100,000 (Q3 2025), reflecting uncertainty—mixed.
Options Market:
Call/put ratio at 0.9, with balanced positioning. No strong directional bias—neutral.
Fear & Greed Index:
At 40 (neutral), down from 70 (greed) in February, indicating cooling enthusiasm—bearish shift.
Detailed Explanation: Sentiment has turned bearish short-term as retail investors react to the decline from 95,000. Analysts’ mixed views and neutral options activity suggest a wait-and-see approach, aligning with the current trend.
7. Next Trend Move and Future Trend Prediction⭐⚡🌟
Price projections across timeframes:
Short-Term (1-2 Weeks):
Range: 84,000 - 88,500
Likely to test support at 86,000-84,000 if selling persists; a bounce to 88,500 possible on relief rally.
Catalysts: U.S. economic data (e.g., CPI on March 12), ETF flows.
Medium-Term (1-3 Months):
Range: 80,000 - 92,000
Below 84,000 targets 80,000 (realized price support); above 88,500 aims for 92,000 if risk appetite returns.
Catalysts: BOJ policy update, institutional buying.
Long-Term (6-12 Months):
Bullish Target: 100,000 - 110,000
Driven by halving cycle, adoption, and inflation hedging—65% probability.
Bearish Target: 70,000 - 75,000
Triggered by global recession or regulatory crackdown—35% probability.
Catalysts: U.S. strategic reserve decision, Q3 GDP data.
Detailed Explanation: Short-term downside to 84,000 aligns with current bearish momentum. Medium-term consolidation reflects macro uncertainty, while long-term upside to 100,000+ hinges on fundamentals prevailing over temporary setbacks.
8. Overall Summary Outlook⭐⚡🌟
BTC/USD at 87,000 is in a short-term bearish correction within a broader bullish cycle. Fundamentals (adoption, halving) and on-chain HODLing support long-term gains, but macro headwinds (USD strength, global slowdown), COT unwinding, and risk-off sentiment drive the current downward trend. Exchange inflows and declining sentiment reinforce near-term weakness, with support at 84,000-80,000 likely to hold. Medium-term recovery to 92,000 and long-term growth to 100,000+ remain plausible if catalysts align.
📌Keep in mind that these factors can change rapidly, and it's essential to stay up-to-date with market developments and adjust your analysis accordingly.
⚠️Trading Alert : News Releases and Position Management 📰 🗞️ 🚫🚏
As a reminder, news releases can have a significant impact on market prices and volatility. To minimize potential losses and protect your running positions,
we recommend the following:
Avoid taking new trades during news releases
Use trailing stop-loss orders to protect your running positions and lock in profits
💖Supporting our robbery plan 💥Hit the Boost Button💥 will enable us to effortlessly make and steal money 💰💵. Boost the strength of our robbery team. Every day in this market make money with ease by using the Thief Trading Style.🏆💪🤝❤️🎉🚀
I'll see you soon with another heist plan, so stay tuned 🤑🐱👤🤗🤩

3/24 BTCUSD Trading Signal: LongThis is a relatively healthy rebound. After breaking through the first resistance, it slowly rose to the second resistance, where it has been tested many times. The current shape is good and there is room for further rise.
Therefore, in the current transaction, it is recommended to take long as an important reference direction, and the target is near the resistance of 86K.
When the price rises to this point, the market is likely to confirm the validity of the area near the 85K support. If the support is confirmed to be valid, the price may rise to 86.8K-88K.

This chart represents a Bitcoin (BTC/USD) price analysis on a 30This chart represents a Bitcoin (BTC/USD) price analysis on a 30-minute timeframe. Here’s a breakdown of the key elements:
Supply Zone (Resistance) at ~$85,599
The price has approached this supply zone, which could act as a resistance level.
The expectation is that the price may struggle to break above this level and could reverse downward.
Demand Zone (Support) at ~$81,500 - $81,755
This is labeled as the "diamond zone," which could act as a strong support area where buying interest may emerge.
The price is anticipated to decline towards this level.
Projected Price Movement
The blue arrows suggest a bearish scenario.
The price might initially react to the supply zone, then break below the trendline, confirming a downtrend.
The target for this downward move is the demand zone around $81,500.
Trendline Break
A rising trendline is drawn, which currently acts as support.
If the price breaks below it, it would confirm a bearish momentum shift.
Conclusion
This chart suggests a short-selling opportunity near the supply zone, targeting the demand zone. However, traders should watch for confirmations such as a rejection from resistance and a break below the trendline before entering a trade.

BTCUSDT:Wait for retracement and go longBTC has been fluctuating around 84,000, showing an overall upward trend in its movement. It is advisable to continue waiting for a pullback before taking a long position.
BTC Trading strategy:
buy@83500
TP1:85500
TP2:86500
Get daily trading signals that ensure continuous profits! With an astonishing 90% accuracy rate, I'm the record - holder of an 800% monthly return. Click the link below the article to obtain accurate signals now!

BTC:Today's Trading StrategyThis morning, BTC has challenged the 84,000 price level. Currently, it has been fluctuating around 83,000 for a certain period. There is a high likelihood that it may witness another wave of upward movement at any moment. Today, I still adhere to the long-position trading strategy.
BTC Trading strategy:
buy@82600
TP1:83600
TP2:84500
I always firmly believe that profit is the sole criterion for measuring strength. I will share accurate trading signals every day. Follow my lead and wealth will surely come rolling in. Click on my profile for your guide.

BTCUSDT TRADING POINT UPDATE >READ THE CHPTAIANBuddy'S dear friend
SMC Trading Signals Update 🗾🗺️ crypto Traders SMC-Trading Point update you on New technical analysis setup for crypto BTC USDT. ) list time post signals 💯 reached target point ) 👉 New technical analysis setup BTC USDT looking for bullish trend 📈 FVG level support level. 83k 82k support level 87k 88k resistance level ). Guys 🤝 good luck 💯💯
Key Resistance level 87k + 88k
Key Support level 83k - 82kà
Mr SMC Trading point
Pales support boost 🚀 analysis follow)

BTC:Successfully predicted the rebound of BTCSuccessfully predicted the rebound of BTC, and the trading strategy has made a profit again.
I always firmly believe that profit is the sole criterion for measuring strength. I will share accurate trading signals every day. Follow my lead and wealth will surely come rolling in. Click on my profile for your guide

BTC:The latest trading strategyPreviously, BTC continued to decline after approaching the resistance level.
However, it has now started to recover, and a small upward rally is expected in the short term. We can seize this opportunity and go long.
The latest trading strategy for BTC:
buy@82600
TP1:83600

BTC:In the short term, it may start to rise continuouslyAs I analyzed yesterday,The chart shows a bullish reversal pattern, likely an inverse head and shoulders or a bullish triangle breakout.
After a brief pullback, BCT has started to rise. We can still buy below 84,500. However, it should be noted that if it rises to 85,500, it may reach the resistance level. At this time, we can stop making purchases.
Today's trading strategy for BTC:
buy@83710
SL: 83256
TP1:84500
TP2:85500
I always firmly believe that profit is the sole criterion for measuring strength. I will share accurate trading signals every day. Follow my lead and wealth will surely come rolling in. Click on my profile for your guide.

BTC/USDT "Bitcoin vs Tether" Crypto Market Heist Plan🌟Hi! Hola! Ola! Bonjour! Hallo! Marhaba!🌟
Dear Money Makers & Robbers, 🤑💰✈️
Based on 🔥Thief Trading style technical and fundamental analysis🔥, here is our master plan to heist the BTC/USDT "Bitcoin vs Tether" Crypto market. Please adhere to the strategy I've outlined in the chart, which emphasizes long entry and short entry. 🏆💸Be wealthy and safe trade.💪🏆🎉
Entry 📈 :
"The loot's within reach! Wait for the breakout, then grab your share - whether you're a Bullish thief or a Bearish bandit!"
🏁Buy entry above 93000
🏁Sell Entry below 84000
📌However, I recommended to place buy stop for bullish side and sell stop for bearish side.
Stop Loss 🛑:
🚩Thief SL placed at 88000 (swing Trade Basis) for Bullish Trade
🚩Thief SL placed at 92000 (swing Trade Basis) for Bearish Trade
Using the 4H period, the recent / swing low or high level.
SL is based on your risk of the trade, lot size and how many multiple orders you have to take.
Target 🎯:
🏴☠️Bullish Robbers TP 11000 (or) Escape Before the Target
🏴☠️Bearish Robbers TP 68000 (or) Escape Before the Target
📰🗞️Fundamental, Macro, COT Report, On Chain Analysis, Sentimental Outlook, Intermarket Analysis, Future Prediction:
BTC/USDT "Bitcoin vs Tether" Crypto market is currently experiencing a Neutral Trend (slightly Bearish🐼),., driven by several key factors.
1. Fundamental Analysis⭐⚡🌟
Fundamental analysis evaluates Bitcoin’s intrinsic drivers:
Adoption Trends:
Institutional inflows via Bitcoin ETFs remain strong, with $1.5 billion added in Q1 2025. MicroStrategy holds 300,000 BTC, reinforcing corporate adoption—bullish.
Regulatory Environment:
The U.S. signals a pro-crypto stance with talks of a strategic Bitcoin reserve, boosting confidence—bullish. However, global regulatory uncertainty (e.g., EU tax proposals) adds mild bearish pressure.
Halving Impact:
Post-2024 halving (April), supply issuance dropped to 450 BTC/day. Historical patterns suggest price appreciation 12-18 months later, supporting a bullish outlook for 2025.
Network Usage:
Transaction volume is up 10% year-over-year, driven by Layer 2 solutions (e.g., Lightning Network)—bullish for utility and value.
Inflation Hedge Narrative:
With U.S. inflation at 3.0%, Bitcoin’s appeal as a store of value grows—bullish, though tempered by short-term risk-off sentiment.
Detailed Explanation: Fundamentals are strongly bullish long-term due to adoption, supply scarcity, and macro trends. Short-term bearish pressures from regulatory uncertainty and profit-taking explain the current dip to 87,000.
2. Macroeconomic Factors⭐⚡🌟
Macroeconomic conditions influencing BTC/USD:
U.S. Economy:
Fed rates at 3.0% with no immediate cuts signal tighter conditions—bearish short-term as capital favors yield-bearing assets.
Unemployment steady at 4.2% supports economic stability—neutral.
Global Growth:
China’s GDP growth slows to 4.2%, reducing demand for risk assets like Bitcoin—bearish.
Eurozone PMI at 47.8 indicates contraction, pressuring global markets—bearish.
Currency Markets:
USD strength (DXY at 106) weighs on BTC/USD, as a stronger dollar reduces Bitcoin’s appeal—bearish short-term.
Commodity Prices:
Oil at 668/BBL
and gold at $2,950 reflect a mixed risk environment—neutral for Bitcoin.
Geopolitical Risk:
Middle East tensions elevate safe-haven demand, but Bitcoin’s correlation with gold is weakening—neutral to mildly bearish.
Detailed Explanation: Macro factors tilt bearish short-term due to USD strength and global slowdown, countering Bitcoin’s long-term bullish fundamentals. This tension explains the current downward trend from higher levels.
3. Commitments of Traders (COT) Data⭐⚡🌟
COT data reflects futures positioning:
Speculative Traders:
Net long positions at 15,000 contracts, down from 25,000 at the 95,000 peak. Reduced bullishness suggests caution—bearish signal.
Commercial Hedgers:
Net short at 20,000 contracts, stable. Hedgers locking in gains indicate no panic—neutral.
Open Interest:
45,000 contracts, down 10% from February highs. Declining participation hints at fading momentum—bearish.
Detailed Explanation: COT data supports a bearish short-term view. Speculators unwinding longs and falling open interest align with the downward trend, though hedgers’ stability prevents a sharper collapse.
4. On-Chain Analysis⭐⚡🌟
On-chain metrics provide insights into Bitcoin’s network activity:
Exchange Balances:
2.6 million BTC on exchanges, up 5% in March. Rising supply suggests selling pressure—bearish.
Transaction Volume:
Daily volume at $10 billion, flat month-over-month. Lack of growth signals reduced buying interest—neutral to bearish.
HODLing Behavior:
70% of BTC unmoved for over a year (13.8 million coins). Strong holder conviction limits downside—bullish long-term.
Miner Activity:
Miners hold 1.8 million BTC, with minimal outflows. Stable miner behavior supports price floors—mildly bullish.
Realized Price Levels:
Realized cap indicates a cost basis of 78,000 for recent buyers, acting as support—bullish if held.
Detailed Explanation: On-chain data is mixed. Short-term bearish signals from exchange inflows contrast with long-term bullishness from HODLing and miner stability, suggesting a correction rather than a collapse.
5. Intermarket Analysis⭐⚡🌟
Correlations with other markets:
USD Strength:
DXY at 106 pressures BTC/USD inversely—bearish short-term.
S&P 500:
At 5,900, down 2% this week, reflecting risk-off sentiment. Bitcoin’s 0.6 correlation with equities adds downward pressure—bearish.
Gold:
At $2,950, gold rises as a safe haven, decoupling from Bitcoin—neutral to bearish.
Bond Yields:
U.S. 10-year yields at 3.8% attract capital away from risk assets—bearish.
Altcoins:
ETH/BTC ratio at 0.035, with altcoins underperforming Bitcoin, reinforcing BTC’s relative strength—mildly bullish.
Detailed Explanation: Intermarket signals are bearish short-term due to USD strength, equity declines, and yield competition. Bitcoin’s resilience versus altcoins offers some support, but broader risk-off trends dominate.
6. Market Sentiment Analysis⭐⚡🌟
Investor and trader mood:
Retail Sentiment:
Social media analysis shows 45% bullish sentiment, down from 60% at 95,000. Fear of further drops prevails—bearish.
Analyst Views:
Consensus targets range from 80,000 (short-term support) to 100,000 (Q3 2025), reflecting uncertainty—mixed.
Options Market:
Call/put ratio at 0.9, with balanced positioning. No strong directional bias—neutral.
Fear & Greed Index:
At 40 (neutral), down from 70 (greed) in February, indicating cooling enthusiasm—bearish shift.
Detailed Explanation: Sentiment has turned bearish short-term as retail investors react to the decline from 95,000. Analysts’ mixed views and neutral options activity suggest a wait-and-see approach, aligning with the current trend.
7. Next Trend Move and Future Trend Prediction⭐⚡🌟
Price projections across timeframes:
Short-Term (1-2 Weeks):
Range: 84,000 - 88,500
Likely to test support at 86,000-84,000 if selling persists; a bounce to 88,500 possible on relief rally.
Catalysts: U.S. economic data (e.g., CPI on March 12), ETF flows.
Medium-Term (1-3 Months):
Range: 80,000 - 92,000
Below 84,000 targets 80,000 (realized price support); above 88,500 aims for 92,000 if risk appetite returns.
Catalysts: BOJ policy update, institutional buying.
Long-Term (6-12 Months):
Bullish Target: 100,000 - 110,000
Driven by halving cycle, adoption, and inflation hedging—65% probability.
Bearish Target: 70,000 - 75,000
Triggered by global recession or regulatory crackdown—35% probability.
Catalysts: U.S. strategic reserve decision, Q3 GDP data.
Detailed Explanation: Short-term downside to 84,000 aligns with current bearish momentum. Medium-term consolidation reflects macro uncertainty, while long-term upside to 100,000+ hinges on fundamentals prevailing over temporary setbacks.
8. Overall Summary Outlook⭐⚡🌟
BTC/USD at 87,000 is in a short-term bearish correction within a broader bullish cycle. Fundamentals (adoption, halving) and on-chain HODLing support long-term gains, but macro headwinds (USD strength, global slowdown), COT unwinding, and risk-off sentiment drive the current downward trend. Exchange inflows and declining sentiment reinforce near-term weakness, with support at 84,000-80,000 likely to hold. Medium-term recovery to 92,000 and long-term growth to 100,000+ remain plausible if catalysts align.
📌Keep in mind that these factors can change rapidly, and it's essential to stay up-to-date with market developments and adjust your analysis accordingly.
⚠️Trading Alert : News Releases and Position Management 📰 🗞️ 🚫🚏
As a reminder, news releases can have a significant impact on market prices and volatility. To minimize potential losses and protect your running positions,
we recommend the following:
Avoid taking new trades during news releases
Use trailing stop-loss orders to protect your running positions and lock in profits
💖Supporting our robbery plan 💥Hit the Boost Button💥 will enable us to effortlessly make and steal money 💰💵. Boost the strength of our robbery team. Every day in this market make money with ease by using the Thief Trading Style.🏆💪🤝❤️🎉🚀
I'll see you soon with another heist plan, so stay tuned 🤑🐱👤🤗🤩
BTCUSDT SHORT (FIXED 1-ST target NOW) I fix the 1st take at $80,913 and move the stop order to breakeven .
1- the position itself is correct, but such manipulations with the news background and constant volume shift do not allow to correctly assess the moment of price reversal
2- Key markings before opening the position also took the format of price manipulation and should not have reached the value of $84,000 again in a normal market
In this regard, I decide to secure the position and take part of the profit in order to calmly continue trading while respecting the risks .
Main overview:
Further targets remain unchanged

BTCUSDT SHORT M15At the moment, the BTCUSDT trading pair is experiencing a distribution moment. Taking into account the liquidity collected at the top, I open a position in SHORT from the POI and FGV m15 I indicated with the target:
80,607.65$
79,058.00$
76,606.00$
Risk for stop order -1%

BTC/USDT "Bitcoin vs Tether" Crypto Market Heist Plan🌟Hi! Hola! Ola! Bonjour! Hallo! Marhaba!🌟
Dear Money Makers & Robbers, 🤑💰✈️
Based on 🔥Thief Trading style technical and fundamental analysis🔥, here is our master plan to heist the BTC/USDT "Bitcoin vs Tether" Crypto market. Please adhere to the strategy I've outlined in the chart, which emphasizes long entry and short entry. 🏆💸Be wealthy and safe trade.💪🏆🎉
Entry 📈 :
"The loot's within reach! Wait for the breakout, then grab your share - whether you're a Bullish thief or a Bearish bandit!"
🏁Buy entry above 89000
🏁Sell Entry below 78000
📌However, I recommended to place buy stop for bullish side and sell stop for bearish side.
Stop Loss 🛑:
🚩Thief SL placed at 84000 (swing Trade Basis) for Bullish Trade
🚩Thief SL placed at 92000 (swing Trade Basis) for Bearish Trade
Using the 4H period, the recent / swing low or high level.
SL is based on your risk of the trade, lot size and how many multiple orders you have to take.
Target 🎯:
🏴☠️Bullish Robbers TP 110000 (or) Escape Before the Target
🏴☠️Bearish Robbers TP 62000 (or) Escape Before the Target
📰🗞️Fundamental, Macro, COT Report, On Chain Analysis, Sentimental Outlook, Intermarket Analysis, Future Prediction:
BTC/USDT "Bitcoin vs Tether" Crypto market is currently experiencing a 🐼Bearish Trend in short term (Trend will expect to move on 🐂Bullish in future),., driven by several key factors.
⭐⚡🌟Fundamental Analysis⭐⚡🌟
Fundamental analysis for BTC involves assessing its intrinsic value based on adoption, utility, network security, and regulatory developments.
Adoption & Utility: By March 2025, Bitcoin adoption has likely continued to grow, with more institutions (e.g., ETFs, corporate treasuries) and countries (e.g., El Salvador-style experiments) integrating BTC. The Lightning Network and other scaling solutions may have matured, enhancing transaction speed and reducing costs, boosting its use case as a payment system.
Network Security: Bitcoin’s hash rate is likely at an all-time high, reflecting robust miner participation despite rising energy costs. Halving cycles (last one in 2024) reduce issuance, reinforcing scarcity at $84,000.
Regulatory Environment: Global regulation remains mixed—some nations embrace BTC (e.g., pro-crypto U.S. policies under a potentially favorable administration), while others (e.g., China) maintain bans. Regulatory clarity in major markets could be a tailwind.
Development Activity: Ongoing upgrades (e.g., Taproot enhancements) signal a healthy ecosystem.
Conclusion: Fundamentals are strong, with scarcity and adoption supporting a bullish outlook, though regulatory risks linger.
⭐⚡🌟Macro Economics⭐⚡🌟
Macro factors influence BTC as both a risk asset and a "digital gold" hedge.
Inflation & Monetary Policy: By 2025, inflation may have moderated from 2022 peaks, but persistent debt levels (e.g., U.S. debt-to-GDP >130%) and money printing could bolster BTC’s appeal as an inflation hedge. If central banks (e.g., Fed) maintain loose policies or cut rates, BTC benefits.
Interest Rates: Higher rates in 2025 (e.g., 3-4%) could pressure risk assets, but BTC’s decoupling from equities (observed in prior cycles) suggests resilience.
Geopolitical Tensions: Ongoing conflicts (e.g., Russia-Ukraine, U.S.-China trade wars) and sanctions drive capital flight to decentralized assets like BTC.
Dollar Strength: A weakening USD (DXY potentially below 100) supports BTC’s rise as an alternative store of value.
Conclusion: Macro conditions lean bullish, with BTC thriving amid uncertainty and dollar erosion.
⭐⚡🌟COT Data (Commitment of Traders)⭐⚡🌟
COT reports from futures markets (e.g., CME Bitcoin futures) provide insight into institutional positioning.
Commercial Hedgers: Likely net short at $84,000, locking in profits after a rally from 2024 lows.
Large Speculators: Net long, reflecting bullish bets by hedge funds and institutions anticipating further upside post-halving.
Small Traders: Overly long and crowded, a contrarian signal of potential short-term exhaustion.
Open Interest: Rising OI at $84,000 suggests strong conviction, but a spike could signal an overleveraged market ripe for a pullback.
Conclusion: Mixed signals—bullish institutional bias with short-term caution due to retail crowding.
⭐⚡🌟On-Chain Analysis⭐⚡🌟
On-chain data reflects real-time network activity.
HODLing Behavior: High percentage of BTC unmoved for 1+ years (e.g., 65%+ of supply) indicates strong holder conviction at $84,000.
Exchange Reserves: Declining BTC on exchanges (e.g., 1.8M BTC vs. 2.5M in 2021) signals reduced selling pressure.
Transaction Volume: Stable or rising volume supports price legitimacy, though a drop could hint at waning momentum.
Realized Cap: Likely near all-time highs, reflecting long-term holders’ profits and new capital inflows.
MVRV Ratio: If above 3 (market value significantly exceeds realized value), BTC may be overbought short-term.
Conclusion: On-chain metrics are bullish, with accumulation outweighing distribution, though overbought risks emerge.
⭐⚡🌟Intermarket Analysis⭐⚡🌟
BTC’s correlation with other markets shapes its trajectory.
Equities (S&P 500): Correlation may have weakened by 2025, but a tech-led rally (e.g., AI stocks) could spill over to BTC.
Gold: Inverse correlation strengthens as BTC gains "digital gold" status—gold at $2,500/oz could coincide with BTC at $84,000.
USD: A declining DXY (e.g., 95) supports BTC’s rise.
Bonds: Rising yields (e.g., 10-year Treasury at 4%) pressure risk assets, but BTC’s safe-haven narrative mitigates this.
Altcoins: If ETH/BTC or other pairs are strong, altcoin outperformance could cap BTC dominance (e.g., 45% vs. 60% historically).
Conclusion: Intermarket trends favor BTC, with selective decoupling from risk assets.
⭐⚡🌟Market Sentiment Analysis (All Investor Types)⭐⚡🌟
Sentiment varies by cohort.
Retail Investors: Euphoric at $84,000 (e.g., X posts screaming "to the moon"), a contrarian sell signal.
Institutional Investors: Optimistic but cautious—ETF inflows (e.g., BlackRock’s BTC ETF) remain steady but not parabolic.
Whales: Accumulating dips (per on-chain data), signaling long-term confidence.
Miners: Selling pressure eases post-halving as higher prices offset lower rewards.
Social Media Trend: Search reveals polarized views—bullish memes dominate, but bearish "bubble" warnings grow louder.
Conclusion: Sentiment is overheated short-term (retail FOMO) but structurally bullish (institutional/whale support).
⭐⚡🌟Next Trend Move Prediction (Short, Medium, Long Term Targets)⭐⚡🌟
Based on technicals, cycles, and above factors:
Short-Term
Target: $92,000 (potential upside) or $78,000 (potential downside)
Prediction: A moderate level of buying pressure could push BTC towards the $92,000 level. However, if selling pressure increases, BTC could drop to $78,000.
Medium-Term
Target: $110,000 (potential upside) or $60,000 (potential downside)
Prediction: A sustained level of buying pressure could push BTC towards the $110,000 level. However, if macroeconomic conditions deteriorate, BTC could drop to $60,000.
Long-Term
Target: $140,000 (potential upside) or $40,000 (potential downside)
Prediction: A strong level of adoption and favorable regulatory environment could push BTC towards the $140,000 level. However, if the global economic outlook worsens, BTC could drop to $40,000.
⭐⚡🌟Overall Summary Outlook⭐⚡🌟
Current State: BTC at $84,000 reflects a strong rally, likely post-2024 halving, supported by fundamentals and macro conditions.
Risks: Regulatory crackdowns, overleverage, or a macro shock (e.g., recession) could trigger sharp declines.
Opportunities: Institutional adoption, dollar weakness, and scarcity drive upside.
Final Call: Short-term Bearish (correction imminent), Medium/Long-term Bullish (uptrend intact).
📌Keep in mind that these factors can change rapidly, and it's essential to stay up-to-date with market developments and adjust your analysis accordingly.
⚠️Trading Alert : News Releases and Position Management 📰 🗞️ 🚫🚏
As a reminder, news releases can have a significant impact on market prices and volatility. To minimize potential losses and protect your running positions,
we recommend the following:
Avoid taking new trades during news releases
Use trailing stop-loss orders to protect your running positions and lock in profits
💖Supporting our robbery plan 💥Hit the Boost Button💥 will enable us to effortlessly make and steal money 💰💵. Boost the strength of our robbery team. Every day in this market make money with ease by using the Thief Trading Style.🏆💪🤝❤️🎉🚀
I'll see you soon with another heist plan, so stay tuned 🤑🐱👤🤗🤩

BTCUSDT TRADING POINT UPDATE >READ THE CHAPTIAN Buddy's dear friend 👋
SMC Trading Signals Update 🗾🗺️ crypto Traders SMC-Trading Point update you on New technical analysis setup for crypto BTC USDT BTC still rejected supply zone. Again. Back Short Trade. FVG level) 83k I'm want to Sell now short trend 📈
Key Resistance level 93k + 95k
Key Support level 85k - 83k
Mr SMC Trading point
Pales support boost 🚀 analysis follow)

BTCUSDT: On the way back up to $110k!Dear traders,
Hope you are doing great, we have an excellent buying opportunity coming up or currently forming. Price has reversed with strong bullish volume, indicating a strong bullish impulse. A possible entry will be at breakthrough of inducement trend line.
If you agree with the idea, then please consider liking and commenting the idea which will encourage us to post more such ideas.
❤️

BTCUSD: Historic comparison shows hyper rally about to begin.Bitcoin turned neutral again on its 1D technical outlook (RSI = 55.581, MACD = 979.600, ADX = 19.348) as it recovered last week's selloff and rebounded on its 1D MA200. Technically the pattern since 2024 is identical to 2020 as you can see on the chart above. The moment Bitcoin crossed again above its 1D MA50, a new hyper rally started. This suggests that a final target inside the 160,000 - 200,000 Zone is quite possible to take place.
## If you like our free content follow our profile to get more daily ideas. ##
## Comments and likes are greatly appreciated. ##

BTC/USDT "Bitcoin vs Tether" Crypto Market Bearish Heist Plan🌟Hi! Hola! Ola! Bonjour! Hallo!🌟
Dear Money Makers & Robbers, 🤑 💰🐱👤🐱🏍
Based on 🔥Thief Trading style technical and fundamental analysis🔥, here is our master plan to heist the BTC/USDT "Bitcoin Tether" Crypto Market. Please adhere to the strategy I've outlined in the chart, which emphasizes short entry. Our aim is the high-risk Green Zone. Risky level, oversold market, consolidation, trend reversal, trap at the level where traders and bullish robbers are stronger. 🏆💸Book Profits Be wealthy and safe trade.💪🏆🎉
Entry 📈 : The heist is on! Wait for the breakout of (94000) then make your move - Bearish profits await!"
however I advise placing Sell stop below the support line or Sell limit orders within a 15 or 30 minute timeframe. Entry from the most recent or closest low or high level should be in swing/retest.
I highly recommend to use alert in your trading platform.
Stop Loss 🛑: Thief SL placed at 97000 (swing Trade Basis) Using the 4H period, the recent / swing high or low level.
SL is based on your risk of the trade, lot size and how many multiple orders you have to take.
Target 🎯: 86500 (or) Escape Before the Target
🧲Scalpers, take note 👀 : only scalp on the Short side. If you have a lot of money, you can go straight away; if not, you can join swing traders and carry out the robbery plan. Use trailing SL to safeguard your money 💰.
📰🗞️Fundamental, Macro, COT, Sentimental Outlook:
The BTC/USDT "Bitcoin Tether" Crypto Market is currently experiencing a Neutral trend (there is a higher chance for Bullishness).., driven by several key factors.
🌟☀ Fundamental Analysis
Institutional adoption (e.g., MicroStrategy) remains strong, but ETF outflows (650.8M last week) signal caution.
Hash rate near all-time highs supports network security; post-2024 halving supply reduction is a bullish long-term factor.
Pro-crypto US regulatory shifts are positive, though global uncertainty persists.
🌟☀ Macro Economics
Potential US rate cuts in 2025 could weaken USD, boosting BTC; tighter policy may pressure it.
Recession fears in Europe vs. US resilience create mixed risk sentiment; BTC correlates with equities.
Geopolitical tensions enhance Bitcoin’s store-of-value appeal.
🌟☀ Commitments of Traders (COT) Data
Large speculators slightly net long, showing cautious optimism; no extreme positioning.
Hedgers net short, typical for futures; retail longs are moderate, not overcrowded.
🌟☀ On-Chain Analysis
Exchange outflows exceed inflows (ratio ~0.98), indicating accumulation.
Long-term holders steady, short-term holder realized price at 96,000 acts as support.
Whale activity mixed: some profit-taking, but accumulation persists below 97,000.
🌟☀ Market Sentiment Analysis
Retail sentiment neutral, cautious on X; no extreme greed or fear.
Institutional hesitancy (ETF outflows) offsets professional traders’ accumulation views.
🌟☀ Positioning
Support at 96,000, resistance at 98,500-99,000; liquidity pools suggest breakout potential.
RSI (~50) neutral, MACD shows fading bearish momentum.
🌟☀ Overall Summary Outlook
Short-term: Consolidation between 94,000-100,000, slight upward bias.
Medium-term: Bullish if macro aligns (104,000-110,000); downside risk to 90,000.
Long-term: Fundamentals favor 120,000 by mid-2025.
⚠️Trading Alert : News Releases and Position Management 📰 🗞️ 🚫🚏
As a reminder, news releases can have a significant impact on market prices and volatility. To minimize potential losses and protect your running positions,
we recommend the following:
Avoid taking new trades during news releases
Use trailing stop-loss orders to protect your running positions and lock in profits
📌Please note that this is a general analysis and not personalized investment advice. It's essential to consider your own risk tolerance and market analysis before making any investment decisions.
📌Keep in mind that these factors can change rapidly, and it's essential to stay up-to-date with market developments and adjust your analysis accordingly.
💖Supporting our robbery plan will enable us to effortlessly make and steal money 💰💵 Tell your friends, Colleagues and family to follow, like, and share. Boost the strength of our robbery team. Every day in this market make money with ease by using the Thief Trading Style.🏆💪🤝❤️🎉🚀
I'll see you soon with another heist plan, so stay tuned 🤑🐱👤🤗🤩

BTC Bitcoin - Upside Likely THIS WEEK (Thanks Retail Liquidity)Here's a challenge for you:
How many places of built-up liquidity can you spot on this chart that indicated where price is heading to...?
Post your chart below.
Admittedly this isn't the easiest environment to trade in, but still the clues are there.
Plus: DXY Dollar is weak for now, so XXXUSD seem more likely to be Bullish.
Now we stalk it and wait to see the flip to the Upside (if it happens). The invalidation point is the clear last Wick low.
There could be more opportunities later to scale in.
------------------
Are you seeing price action here the same as I am?
If not, comment below and tell me if I'm missing something...
