#BTCUSDT: $40,000 Possible Next Target! Major Correction! BINANCE:BTCUSDT
Price has changed, we can now see price dropping towards $40,000 which area can be ideal for swing buyers. Now we are eyeing price to reach and reject at $62,000 where we can swing bearish reversal.
Good Luck and trade safe!
Btcusdtrading

BTCUSD BUY ANALYSIS Here on btc price is likely to retrace back and after that it will rise and continue it uptrend so it expected to go LONG at the area mark .

BTCUSDT: Heading towards $82,000Dear Traders,
Price is currently making correction in daily timeframe, in our view price can drop to 62k to 63k region where we can see strong bullish pressure coming in the market. However, it is also notable that price can just reverse from the current price area that it is trading at, as price already have been dumped once to 54k and there is no strong reason that it would drop to 63k region.
*If you agree with the idea then like and comment, please follow if you want to support us**
Team Setupsfx_

BTCUSDT Long trading ideaOKX:BTCUSDT
Long trading idea
Probable fractal repetition of the previous scenario shown on the graph
In this regard, a correction from the current 38% is likely.
I place limit orders on spot in the order book at prices
48048
47074
47047
46064
45054
45045
44044
43043
43034
42042
42024
41041
41014
Average price 44044
Experimental trading idea
Repetition at your own risk

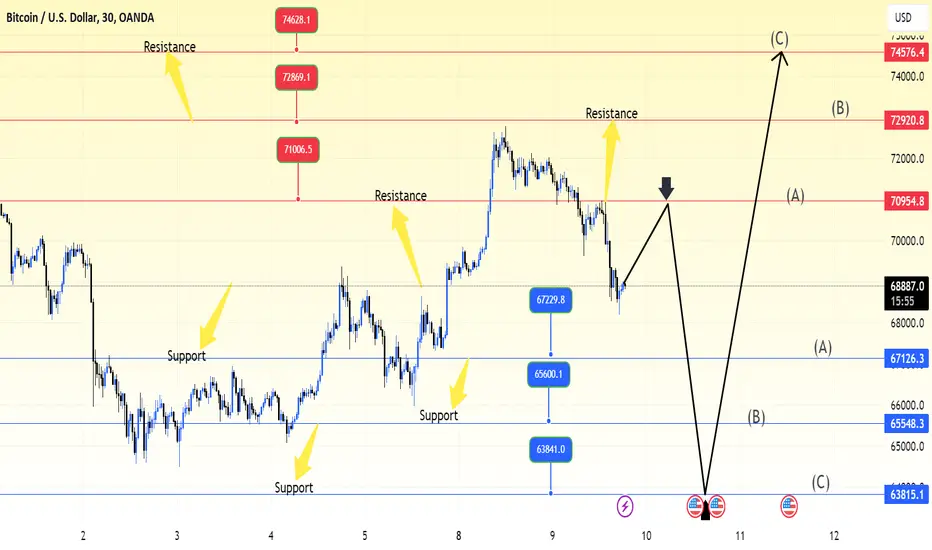
BTCUSD If any hourly closing sustains below that white line then could 📉 📉 to 62865
If it sustains above white line and a daily closing above 66970 then 📈 📈 to 70274
Any daily closing above 70274 is bullish to 📈 📈 to 77559 marked on the chart
Disclaimer:
Its a personal view not a financial advice and I assume no responsibility and liability whatever outcome arises.

BTCUSDT: 80K On The Way! Dear Traders,
BINANCE:BTCUSDT recently ranged between $60000 to $65000, however, price created lower low and then lower high and failed to continue the pattern, in other terms price took our the sell side liquidity and then after price early mitigated. Currently we are expecting price to continue the bullish momentum until it reaches 80k
**If you like our work then please do like and comment, it will encourage us to bring you more ideas. Thanks everyone for your continuous support**

I'm going to break the "Bitcoin"Hello friends, nice to meet you. Here's an amazing Bitcoin chart perspective today
I always support your successful investment.
I hope you do well with safe risk management.
Go for it!
Lowering the highs, the wave is moving in a downward trend.
If you succeed in retesting after breaking the red downward trend line upward, you can think of it as open to 80.4K as a medium wave.
Here we go!!
Now we need to find a moment of rebound. We need to position ourselves in a position where we have good cost-effectiveness and profit-loss ratio so that we have a shorter loss range and a larger loss day.
At the current position, on an hour-long basis, I think the upward divergence is emerging, which is the first condition for a rebound.
The thing to watch out for in the upward divergence shown in the chart above is the push of the candle or the tail end of the candle
In terms of small waves, it showed a form of raising the low point, but if the retest is successful after breaking the blue short-term upward trend line and closing the bell due to the power of the current sell-off, it should be seen that it can reach 57K once again.
Summary:
■60810 The rebound must be achieved after overcoming the price to raise the low point in the sofa statue.
■1 hour-long RSI and upward divergence appeared.
■ If you succeed in retesting after breaking the red downward trend line of the 4-hour rod, it will be open to 80.4K on a medium wave basis.
Bonus Chart
The chart below is my most reliable long-term trend line.
If the adjustment deepens, it could go down to the blue thick upward trend line (56.2K to 56.4K)
Thank you :)

BITCOIN $80,000 by the end of this monthBTCUSD is neutral on its 1D technical outlook (RSI = 49.966, MACD = -901.100, ADX = 24.861) as it is trading inside the 1D MA50 and 1D MA100. This squeeze is taking place while the Inverse H&S is forming its Right Shoulder. The 1D RSI is trading over the MA level, which is the same price action as the Inverse H&S of January. If it crosses over the 1D MA50 (Resistance since April 13th) we will target the 2.0 Fibonacci extension (TP = 80,000).
## If you like our free content follow our profile to get more daily ideas. ##
## Comments and likes are greatly appreciated. ##

BTCUSD: $33000 AND THEN $37000Hope everyone having a great weekend, we need to address few things in here, firstly we expecting price to breakthrough consolidation and create a expansion retracement. Price needs to fill the voided area and as the price is bullish, it is very unlikely for price to drop heavily as there are no major economical data supporting it.
Please Like And Follow for More.

btcusd longBitcoin Price (BTC) Real-Time Live Price
Bitcoin (BTC) is recognised as the world's first truly digitalised digital currency (also known as a cryptocurrency). The Bitcoin price is prone to volatile swings; making it historically popular for traders to speculate on. Follow the live Bitcoin price using the real-time chart, and read the latest Bitcoin news and forecasts to plan your trades using fundamental and technical analysis.

I will let you know the criteria for setting the BTC directionThis is #BTC 4H chart.
If the movement make breakdown the BOX pattern's under line, It can rebound at the RED lines

Btcusd shortBitcoin (BTC) is recognised as the world's first truly digitalised digital currency (also known as a cryptocurrency). The Bitcoin price is prone to volatile swings; making it historically popular for traders to speculate on. Follow the live Bitcoin price using the real-time chart, and read the latest Bitcoin news and forecasts to plan your trades using fundamental and technical analysis.
Bitcoin Price (BTC) Real-Time Live Price
Bitcoin News: Read the Latest Analysis on BTC
btcusd confirm signal buy

Btcusd signal Bitcoin (BTC) is recognised as the world's first truly digitalised digital currency (also known as a cryptocurrency). The Bitcoin price is prone to volatile swings; making it historically popular for traders to speculate on. Follow the live Bitcoin price using the real-time chart, and read the latest Bitcoin news and forecasts to plan your trades using fundamental and technical analysis.
Bitcoin Price (BTC) Real-Time Live Price
Confirm Chart btcusd signal

btcusd signalBitcoin (BTC) is recognised as the world's first truly digitalised digital currency (also known as a cryptocurrency). The Bitcoin price is prone to volatile swings; making it historically popular for traders to speculate on. Follow the live Bitcoin price using the real-time chart, and read the latest Bitcoin news and forecasts to plan your trades using fundamental and technical analysis.
Bitcoin Price (BTC) Real-Time Live Price confirm signal
BTCUSD Gaussian Channel says we're only getting started.Bitcoin is 238 days into green Gaussian Channel territory and highly overbought on the 1W technical outlook (RSI = 81.515, MACD = 8672.400, ADX = 68.211). What would be bad news to buy for any other asset, is actually great for Bitcoin as historically it has seen its biggest gains while deeply overbought. As far as the Gaussian is concerned, every time it has been 238 days past the red zone, the price only rose from there, and as a matter of fact parabolically. This means that we haven't seen the strongest part of this Bull Cycle. In our opinion and based on the HH trendline, $250,000 should be a minimum target for this Cycle.
## If you like our free content follow our profile to get more daily ideas. ##
## Comments and likes are greatly appreciated. ##

BTCUSD DOUBLE TOP SELL Here on BTCUSD price has formed a double top meaning more seller are entrying the market so going for SHORT is expected and targeting profits should be around a 65699 and also use money management

📈Quick Bitcoin Long Setup / 49Min (Updates soon)📉BINANCE:BTCUSDT
BINANCE:BTCUSD
Hello traders.
Bitcoin has a bullish guard above the current support.
Volume management and risk-free strategy are very important in this setup.
Bollinger band midline movement can help you manage your risk.
The divergence of the indicators is shown in the chart.

BTCUSD And Understanding what is RealityHey Guys, filming this one from the South of France before off to Monte Carlo Later!
As we said previously, the rally up to early resistance on BTCUSD was fended away, as we suspected.
If you are sitting on your hands waiting (diamond hands) You may be sat for a long time...
ANY market needs a reason to rise.
Markets tend to take longer amount of time because economic stimulus has to change.
Anyhow, this is what we are looking for now!

BTCUSD: A healthy correction. $250000 isn't at all unrealistic.Bitcoin remains overbought on the 1W timeframe (RSI = 81.582, MACD = 8133.500, ADX = 73.810) despite the recent pullback. On a Cycle basis, this has been nothing but a healthy correction, typical of Bitcoin when it crosses over its ATH. Being overbought on the 1W RSI has been a very bullish attribute during the parabolic rallies of the Bull Cycles and there is no reason to expect anything different this time around.
Last time BTC rose from the prior ATH to the new by +256%. A repeat of that gives as 250,000 target. Ahead of the upcoming Halving in April where the supply is again cut in half, such a target doesn't seem unrealistic now, if the ETF demand stays unchanged. It rose almost +90% since the ETF approval, why shouldn't it accelerate by double if BTC's supply is cut in half?
Stay focused and stay bullish.
## If you like our free content follow our profile to get more daily ideas. ##
## Comments and likes are greatly appreciated. ##

My View Point On Bitcoin today, {6/03/2024}Educational Analysis says BITCOIN BTCUSD may move in this range for some time according to my technical.
Broker - bitstamp
This is not an entry signal. I have no concerns with your profit and loss from this analysis.
Why this range?
Because I think It's going to be short selling for Bitcoin this year or up to the end of this year, There is a lot of liquidity as fvg & volume gaps to the downside.
Bitcoin Institutional traders have built a lot of liquidity when the price was very low, I think it's time to collect it and after that go for an all-time high.
Let's see what this pair brings to the table in the future for us.
Please check the Comment section on how it turned out for this trade.
I HAVE NO CONCERNS WITH YOUR PROFIT OR LOSS,
Happy Trading, Fx Dollars.

BTCUSD Bitcoin Price (BTC) Real-Time Live PriceBitcoin (BTC) is recognised as the world’s first truly digitalised digital currency (also known as a cryptocurrency). The Bitcoin price is prone to volatile swings; making it historically popular for traders to speculate on. Follow the live Bitcoin price using the real-time chart, and read the latest Bitcoin news and forecasts to plan your trades using fundamental and technical analysis.confirm chart

BTCUSD
In the weekly timeframe, BTCUSD exhibits a bullish trend, although it's currently undergoing an Elliott correction wave (ABC), typically retracing between 50% to 61% of the previous move. Waiting for confirmation through bullish price action within this correction zone can provide a strategic entry point for buying opportunities, aligning with the overall upward momentum. This approach combines Elliott Wave Theory with price action analysis to enhance trading decisions.

Btcusd Looking Bullish Long trade Setup Btcusd Break the short time frame Resistance and already Break the main time frame Resistance.
Btcusd looking good for bullish move and must be going For New All Time high.
You can trade on btcusd in the long direction side as strong bullish move expected in the upcoming days as Well
