Evening BTC Trend Analysis and Trading SuggestionsLet's review this afternoon's market performance. The BTC price, as we anticipated, rebounded to around 109,000 in the afternoon before plummeting sharply. Living up to "Black Friday", this violent drop was well within our expectations. In the afternoon's live trading, we also reminded everyone that as long as there was a rebound to the upper zone, it was a good opportunity to go short. This drop has created a space of nearly 1,500 points. Currently, the BTC price has pulled back to around 107,800.
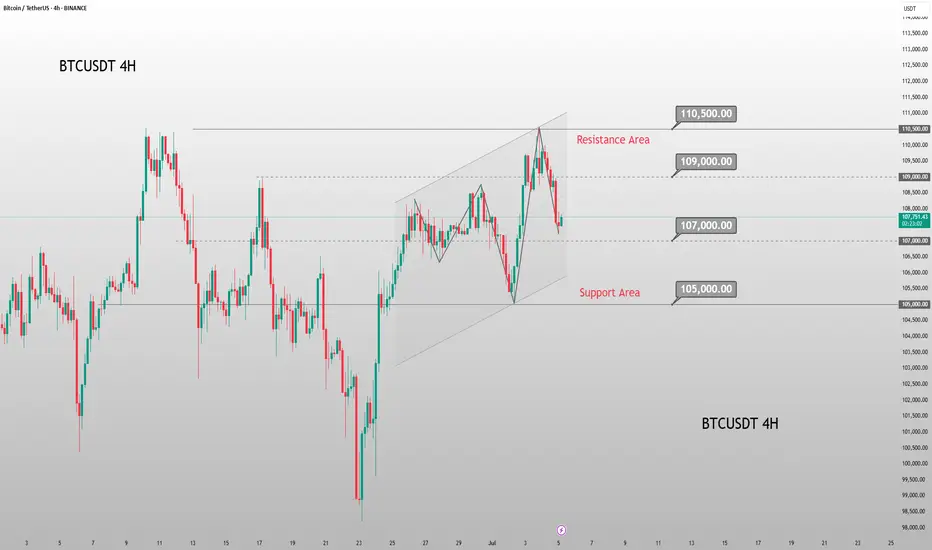
From the current 4-hour K-line chart, after a strong upward surge, the market encountered significant resistance near the upper track of the Bollinger Bands. As bullish momentum gradually faded, the price started to come under pressure and decline, suggesting that the short-term upward trend may come to a temporary halt. At present, the market has recorded multiple consecutive candlesticks with large bearish bodies. The price has not only effectively broken below the key support level of the Bollinger Bands' middle track but also caused the Bollinger Bands channel to switch from expanding to narrowing, indicating that market volatility is decreasing. In terms of trading volume, it showed a moderate increase during the price pullback, which further confirms the authenticity of the bearish selling pressure.
BTCUSD
sell@108000-1085000
tp:107000-106000
Investment itself is not the source of risk; it is only when investment behavior escapes rational control that risks lie in wait. In the trading process, always bear in mind that restraining impulsiveness is the primary criterion for success. I share trading signals daily, and all signals have been accurate without error for a full month. Regardless of your past profits or losses, with my assistance, you have the hope to achieve a breakthrough in your investment.
Btcusdtsell
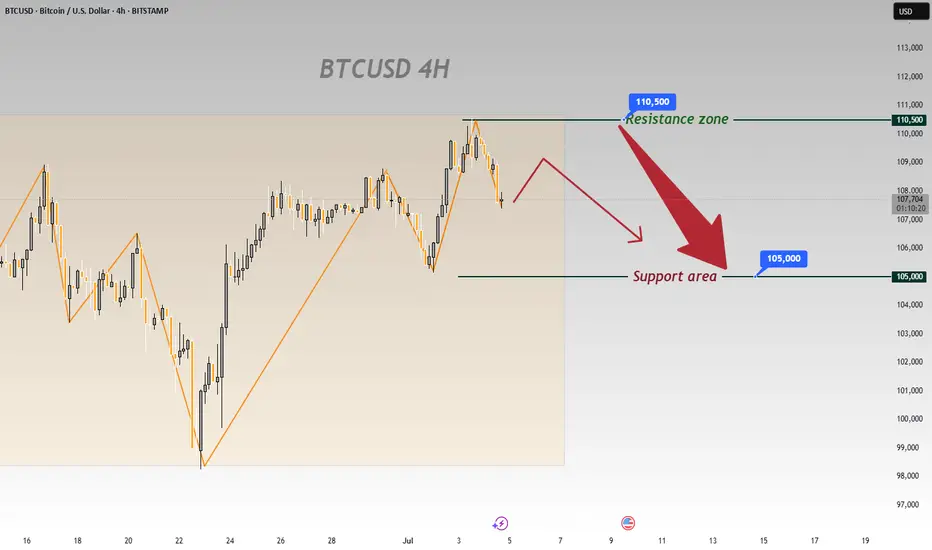
On BTCUSD’s 4 - hour chart, downside risks prevailOn BTCUSD’s 4 - hour chart, downside risks prevail:
Resistance Holds
Price failed to break 110,500, showing strong selling pressure that caps bulls 🚫. A pullback is likely.
Downtrend Signals
Post - resistance, price is retracing. Candlesticks and chart arrows point to a drop toward 105,000 support, fueled by building bearish momentum ⬇️.
Support Test Looms
105,000 is the next key level 🔑. Even if support slows the fall, the setup favors downside—bullish reversals seem unlikely after resistance failure.
Trend Weakness
Orange trendlines show the prior uptrend is fragile 🧊. Failing at 110,500 signals fading bullish force, setting up for a bearish correction.
In short, the 4 - hour chart is bearish. Watch for drops to 105,000; 110,500 will likely block bulls 🛑. Trade cautiously with this bias.
🚀 Sell@108500 - 107500
🚀 TP 106500 - 105500
Accurate signals are updated every day 📈 If you encounter any problems during trading, these signals can serve as your reliable guide 🧭 Feel free to refer to them! I sincerely hope they'll be of great help to you 🌟 👇
Evening BTC Market Analysis and Trading RecommendationsToday, U.S. markets are closed, leading to light trading activity and relatively limited overall market volatility. From a technical analysis perspective, the 4-hour K-line chart currently shows prices trading below the middle band of the Bollinger Bands, exhibiting a classic range-bound consolidation pattern. Bulls and bears are locked in a tug-of-war between key support and resistance levels, with K-line formations alternating between bullish and bearish patterns.
In terms of chart structure, the lower support zone has demonstrated strong buying conviction, while the upper resistance level has exerted clear restrictive force. Multiple failed upward breakouts have formed a short-term top. This box consolidation—characterized by resistance above and support below—is expected to sustain sideways trading through Friday.
Against the backdrop of no major positive catalysts, bearish momentum may gradually dominate if no substantial bullish triggers emerge. Maintain a trading strategy of selling into strength.
BTCUSDT
105000-105500
tp:104000-103000
Investment itself is not the source of risk; it is only when investment behavior escapes rational control that risks lie in wait. In the trading process, always bear in mind that restraining impulsiveness is the primary criterion for success. I share trading signals daily, and all signals have been accurate without error for a full month. Regardless of your past profits or losses, with my assistance, you have the hope to achieve a breakthrough in your investment.

BTCUSDT Trend Analysis and Trading RecommendationsToday's overall BTC market rebounded after hitting a low of 102,614 in the early trading session, with Bitcoin's price maintaining a slow upward trend throughout the day. The intraday high reached 105,912 but encountered resistance. As the weekend approaches, historical market data shows limited volatility during weekends, so range-bound fluctuations are expected for the weekend.
From the current overall market rhythm, the price has rebounded slightly today after the previous decline. The hourly chart shows consecutive upward candles, though the price movement remains relatively slow. As time progresses, the price is expected to sustain an upward trend after pullbacks, and breaking through the short-term resistance level is only a matter of time. In terms of short-term structure and pattern, despite slight resistance and minor pullbacks, the downward momentum has weakened. We can still focus on long positions at lower levels, paying attention to the 106,000 resistance level.
BTCUSD
buy@104000-104500
tp:106000-107000
Investment itself is not the source of risk; it is only when investment behavior escapes rational control that risks lie in wait. In the trading process, always bear in mind that restraining impulsiveness is the primary criterion for success. I share trading signals daily, and all signals have been accurate without error for a full month. Regardless of your past profits or losses, with my assistance, you have the hope to achieve a breakthrough in your investment.


BTCUSDT – Bearish signs emerge below resistanceAfter a strong bullish run, BTCUSDT is now showing clear signs of weakness near the resistance zone around 109,600–112,000. Price action has formed a cluster of rejection candles at the top, failing to break above this key level – signaling that selling pressure is gaining control.
The current structure suggests a potential trend reversal, especially as the latest bearish candle came with rising volume, confirming selling interest from the supply zone. If the price breaks below the 101,500 support, BTC may continue dropping toward the 93,500–84,500 range – a high-liquidity area on the volume profile.
The previous bullish momentum appears to have lost strength, and this pullback may be confirming a shift after reaching its upper limit. As long as BTC remains below the 112,000 resistance, the bearish bias remains dominant.


U.S. Econ Shocks: Bitcoin & Profit SignalsThe latest U.S. economic data has brought significant impacts. The core PCE inflation witnessed a 0.4% month - on - month increase, hitting the highest growth in a year, with a year - on - year rise of 2.8%, exceeding market anticipations. Meanwhile, the long - term inflation expectation from the University of Michigan has soared to a 32 - year high, intensifying market concerns about inflation's resurgence. Currently, the market remains enveloped in macro - risks, pending a softening of market sentiment.
Turning to the Bitcoin market, as depicted in today's price trend (the current BTCUSDT price is $82,338.01, dropping by $2,086.37, a 2.47% decline), the K - line chart analysis indicates a downward trend. The Williams indicator signals an oversold condition. Additionally, trading volume has contracted recently, with both price and volume decreasing, suggesting a sluggish and inactive market.
Nevertheless, if Bitcoin can stabilize above $82,000 and there are signs of capital reflux, gradual position - building may be considered, with a target price set above $90,000. Investors must recognize that the Bitcoin market brims with uncertainties. Variables such as forthcoming U.S. economic data, regulatory policies, and geopolitical scenarios will all sway Bitcoin prices. In this volatile financial landscape, meticulous analysis and judicious decision - making are of utmost importance for investors navigating the Bitcoin market.
BTCUSDT
buy@82000-83000
tp:84500-86500
I will share trading signals every day. All the signals have been accurate for a whole month in a row. If you also need them, please click on the link below the article to obtain them.

Bitcoin Nears Breakout: Can Bulls Push Past $89K?Currently, the key support level for the price of Bitcoin is around $86,000. This level has played a supporting role several times in the recent price fluctuations. If the price can hold this position, it will provide strong support for subsequent upward movements. The key resistance level above is at $89,000. If the price of Bitcoin can break through and firmly stand above this resistance level, it is highly likely to initiate a new round of upward market; if it fails to break through, the price may continue to experience small - scale oscillatory rebounds within the current range.
From a technical indicator perspective, the moving average indicates that Bitcoin has a short - term upward trend. The price has broken through the area where the signal line is located, indicating that the pressure from "digital gold" buyers is relatively high, and the asset value is likely to continue the upward momentum from the current level. However, the MACD indicator experienced a bearish crossover at the beginning of this week. Although the signal line is currently downward, the MACD line has started to move upward. Nevertheless, a trend reversal is unlikely to occur in the short term. In terms of the Relative Strength Index (RSI), this indicator has moved out of the oversold area and is currently in the neutral zone, indicating that the seller's market may have ended. The price of Bitcoin is expected to maintain its current position and may further rise within the next 5 - 7 days.
BTCUSDT
buy@86000-86500
tp:87500-88500
I will share trading signals every day. All the signals have been accurate for a whole month in a row. If you also need them, please click on the link below the article to obtain them.

BTC Rejected at $89K, Uptrend Holds. Bullish Bets?BTC faced rejection at the $89,000 resistance level yesterday, triggering a pullback. However, the overall uptrend remains intact. Investors may consider long positions on signs of stabilization after this corrective move.
BTCUSDT
buy@84500-85500
tp:87000-88000
I will share trading signals every day. All the signals have been accurate for a whole month in a row. If you also need them, please click on the link below the article to obtain them.

BTCUSDT Rally: From $85K to $88K+, What's NextToday, the price of BTCUSDT has shown a robust upward trend. Bullish forces are extremely active, steadily propelling the price to continuously climb, demonstrating a sharp offensive momentum.
From a technical perspective, upon in - depth analysis, the current price is gradually approaching the crucial resistance range of 89,000 - 90,000.
This range has played a significant role in past price movements. Its breakthrough situation will be a pivotal turning point determining the subsequent price trend.
Once a successful breakthrough occurs, it is highly likely to attract more capital inflows, driving the price to initiate a new round of upward price action.
I will share trading signals every day. All the signals have been accurate for a whole month in a row. If you also need them, please click on the link below the article to obtain them.

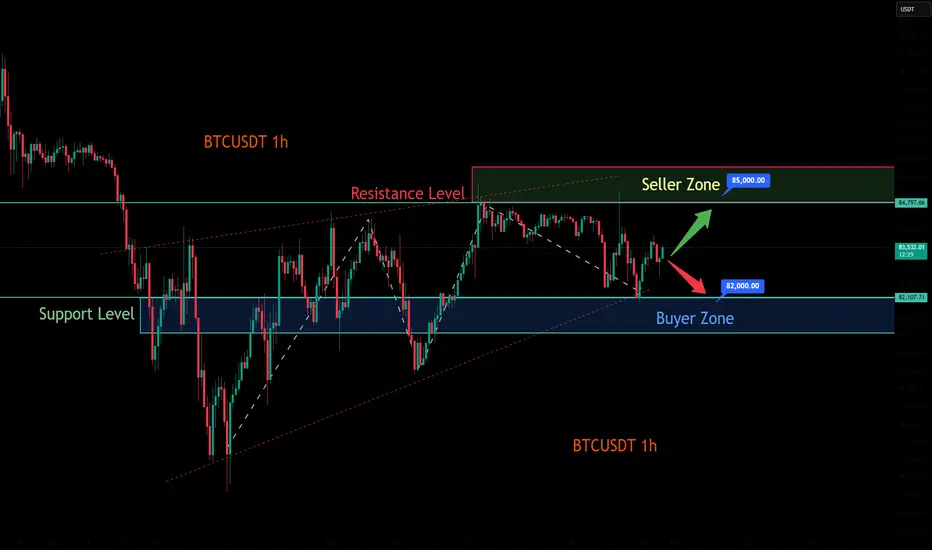
BTC Nears Key Breakout: Can It Push Past 84.5K?Right then, BTC/USDT is at a bit of a crucial point at the moment. The buying range we flagged earlier, 82,000 - 83,500, has been left behind, with the price now sitting at 84,139.51 – up 0.06% on the day.
The target for taking profits is still 84,500 - 86,000, and we’re currently hovering near the lower end of that at 84,500. If it manages to break through that level, there’s a decent chance it could push higher – but it’s worth keeping an eye on whether the rally’s got enough steam to keep going.
Things to watch:
84,500 Breakout: If it cracks this level and holds, we could be in for more upside.
Momentum: Keep tabs on volume and market sentiment to see if this move’s got legs.
Pullback Risk: If it doesn’t break through, don’t be surprised if we see a bit of a dip.
BTCUSDT
Buy82000-83500
tp:84500-86000
I will share trading signals every day. All the signals have been accurate for a whole month in a row. If you also need them, please click on the link below the article to obtain them.

BTCUSDT Long StrategyThe BTC/USDT price is currently consolidating within a range.
You can focus on the 82,000-83,000 zone; if the price retraces to this area and finds support, consider entering a small long position.
The target take-profit levels are between 84,500 and 86,000. If the price reaches 84,500, consider partially closing the position to lock in some profits. If it breaks through this level, the next target is 86,000.
Given the high volatility of the crypto market, it is crucial to manage your position size carefully and avoid overtrading.
BTCUSDT
buy@82000-83000
tp:84500-86000
I will share trading signals every day. All the signals have been accurate for a whole month in a row. If you also need them, please click on the link below the article to obtain them.

BTCUSDT: Key Levels and Trading StrategiesMACD histogram turned positive, indicating emerging short-term bullish momentum despite a $2843 daily drop. RSI (14) at 43.54 shows a neutral-to-weak state, with bears slightly ahead but not in oversold territory, suggesting limited room for further declines. Bitcoin's volatility and recent drop have made investors cautious or even panicked. Some are exiting the market, while others are looking for opportunities to buy the dip or go short. Unstable sentiment is reducing trading activity.
In summary, although BTCUSDT is currently down, bullish signals are strengthening. Key support levels remain crucial. A rebound could occur if prices hold these levels, but a break below may lead to further declines.
BTCUSDT
sell@85000-86000
tp:84000-83500-83000
buy@82000-83000
tp:84000-84500-8500
I will share trading signals every day. All the signals have been accurate for a whole month in a row. If you also need them, please click on the link below the article to obtain them.

Today's Trading Strategy Analysis for BTCUSDTThe uncertainty within the global macroeconomic landscape wields a substantial influence over the trajectory of BTCUSDT.
On one hand, the escalating anticipation of a deceleration in global economic growth has spurred investors' appetite for safe - haven assets. Bitcoin, characterized by its capped supply and decentralized nature, has been singled out by a segment of investors as a viable safe - haven alternative. This perception, to a notable degree, props up its price.
Conversely, the monetary policy maneuvers of central banks globally, including potential interest rate hikes or liquidity - tightening initiatives, can markedly sway the direction of capital flows. Should funds reverse course from the high - volatility cryptocurrency sphere back into the traditional financial domain, Bitcoin's price is likely to encounter downward momentum.
Moreover, the recent upsurge in international trade tensions has thrown the global economic equilibrium into disarray. The consequent spike in market anxiety has compelled investors to re - assess their portfolio allocations, thereby exerting an indirect but significant impact on the price gyrations of BTCUSDT.
BTC trading strategies:
buy@82500-83000
tp:84500
sell@83800-84300
tp:82000
Traders, if this concept fits your style or you have insights, comment! I'm keen to hear.
For those who are seeking professional guidance in trading trend analysis, strategy formulation, and risk management, please click below to get the daily strategy updates.

Today's Strategic Layout for BTC Currently, the price of Bitcoin is fluctuating around $83,000, and the trading activity has declined. At present, the forces of bulls and bears are in an equilibrium state. Looking ahead to the subsequent market conditions, it is necessary to pay close attention to the performance of the support range between $80,000 and $82,000.
BTC trading strategies:
btcusdt sell@85K-86K
tp:82.5K-81K
sl:87K
I firmly believe realized profit and a high win - rate are the best measures of trading skill.
Daily, I share highly precise trading signals. These include clear entry points, stop - loss levels for risk control, and profit - taking targets from in - depth analysis.
Follow me for big financial market returns.
Click my profile for a trading guide on trends, strategies, and risk management.
BTCUSDT, Bearish Scenarios for upcoming days ...Hello Traders, Hope you're great.
for Upcoming days, I anticipate 2 Bearish scenarios :
In First Scenario, I expect price does an upward correction to the nearest broken support level that became to an important supply zone around 91-93K and after that starts to drop.
in Second scenario, I expect price does a further upward correction and goes to the supply zone around 95-97K and after that start a major downward movement.
Targets are 85K, 82K and my final target is 77K.
Don't forget to use proper risk management.
And finally tell me what do you think about BTCUSDT, UP or DOWN ? comment your opinion below this post.

BTC/USDT "Bitcoin Tether" Crypto Market Bearish Heist Plan🌟Hi! Hola! Ola! Bonjour! Hallo!🌟
Dear Money Makers & Robbers, 🤑 💰
Based on 🔥Thief Trading style technical analysis🔥, here is our master plan to heist the BTC/USDT "Bitcoin Tether" Crypto market. Please adhere to the strategy I've outlined in the chart, which emphasizes short entry. Our aim is the high-risk Green Zone. Risky level, oversold market, consolidation, trend reversal, trap at the level where traders and bullish robbers are stronger. 👀 So Be Careful, wealthy and safe trade.💪🏆🎉
Entry 📉 : You can enter a short trade at any point,
however I advise placing sell limit orders within a 15 or 30 minute timeframe. Entry from the most recent or closest high/low level should be in retest.
Stop Loss 🛑: Using the 2H period, the recent / nearest high level.
Goal 🎯: 86,500 (or) Escape before the goal
Scalpers, take note : only scalp on the Short side. If you have a lot of money, you can go straight away; if not, you can join swing traders and carry out the robbery plan. Use trailing SL to safeguard your money 💰.
Warning⚠️ : Our heist strategy is incompatible with Fundamental Analysis news 📰 🗞️. We'll wreck our plan by smashing the Stop Loss 🚫🚏. Avoid entering the market right after the news release.
Take advantage of the target and get away 🎯 Swing Traders Please reserve the half amount of money and watch for the next dynamic level or order block breakout. Once it is resolved, we can go on to the next new target in our heist plan.
💖Supporting our robbery plan will enable us to effortlessly make and steal money 💰💵 Tell your friends, Colleagues and family to follow, like, and share. Boost the strength of our robbery team. Every day in this market make money with ease by using the Thief Trading Style.🏆💪🤝❤️🎉🚀
I'll see you soon with another heist plan, so stay tuned 🫂

#BTC/USDT#BTC
#BITCOIN
The price is moving in a descending channel on the 4-hour frame and is adhering to its limits well. The price has reached the upper limit of the channel
The price also touched the 100 moving average and is expected to rebound from it
The price is now 61,000 $, which is the entry price
Targeting the 56,200 $ area,
which is the lower limit of the channel
We have an upward trend on the RSI indicator, but it is expected to break down

Btcusdt sell Bitcoin (BTC) is recognised as the world’s first truly digitalised digital currency (also known as a cryptocurrency). The Bitcoin price is prone to volatile swings; making it historically popular for traders to speculate on. Follow the live Bitcoin price using the real-time chart, and read the latest Bitcoin news and forecasts to plan your trades using fundamental and technical analysis.
Bitcoin price set up a new all-time high of $69,210 on March 5 on the BitStamp exchange. BTC volatility seems to have dried up, leaving it consolidating above the $61,782 support level. Confirm signal

Btcusdt sell confirm Bitcoin (BTC) is recognised as the world’s first truly digitalised digital currency (also known as a cryptocurrency). The Bitcoin price is prone to volatile swings; making it historically popular for traders to speculate on. Follow the live Bitcoin price using the real-time chart, and read the latest Bitcoin news and forecasts to plan your trades using fundamental and technical analysis. Confirm Chart sell btcusdt

BITCOIN!!!! Future OutlookBITCOIN needs to cool down for the next leg up. Fibonacci golden pocket showing a price decline at a level between 36k to 42k. Would it be possible? Yes, it has high probability. It will make a beautiful cup and handle bullish pattern which will take BITCOIN to 100k in near future.
What do you think guys, will it work?
