BTC Retested and Ready for the Next Leg Up?This CRYPTOCAP:BTC weekly chart shows a clean pattern of breakout → retest → rally.
The 50 EMA has been acting like a strong dynamic support throughout the uptrend, keeping the structure intact. Every time price broke out of a consolidation or resistance zone, it came back, retested it, and then continued moving higher.
Most recently, BTC broke above a key resistance, pulled back to retest it, and now it looks like the breakout has held. This is a classic bullish continuation setup, and historically, it’s led to strong follow-through moves.
As long as BTC stays above the 50 EMA and holds support, the bullish structure remains intact.
Thanks for reading! Stay sharp and trade safe.
Btcusdtshort

BTC/USDT 2H Chart – Updated Bullish Continuation SetupChart Overview: Bitcoin (BTC) continues to show signs of bullish momentum after consolidating within a wedge pattern. The breakout appears more confirmed now, with price holding above the local trendline and forming higher lows.
Key Technical Points:
Pattern: Bullish breakout from descending wedge
Support Zone: Strong demand between 116,000 – 117,000 USDT (highlighted in yellow)
Current Price: ~119,100 USDT
Breakout Confirmation: Retest of breakout area appears successful
Targets:
TP1: 123,075 – 123,341 USDT (intermediate resistance zone)
TP2: 127,465 – 127,642 USDT (final target zone from the wedge breakout projection)

BTCUSD Breakdown Below 116,500 – Watching 61.8% Fib Retracement BTCUSD has broken down below the 116,500 level on the 4-hour timeframe. It’s best to wait for a potential sell entry near the 61.8% Fibonacci retracement of the last bullish wave. Stop-loss and take-profit levels are shown on the chart

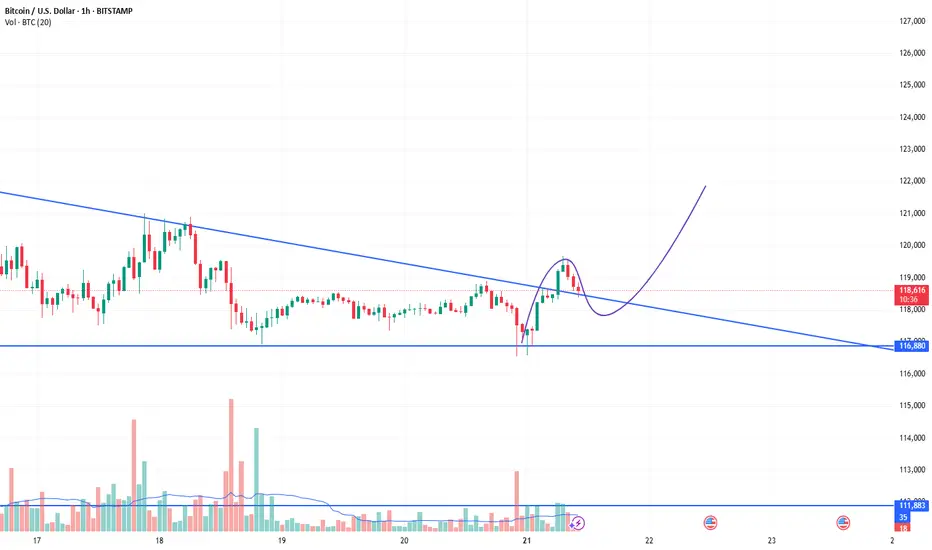
BTC / USDT : Broke down and now going for retestBitcoin Analysis:
Bitcoin has broken down and is now retesting the support zone. As mentioned earlier, a shakeout can happen at any time, and this looks like the potential retest phase.
Bullish Scenario:
Reclaims Resistance: If BTC manages to break through the resistance after the retest, it will stabilize for the short term. This could lead to a move towards higher levels.
Bearish Scenario:
Failure to Break Resistance: If the retest fails and BTC can't reclaim the resistance, further downside could be expected.
Targets: Keep an eye on the CME gap at $114,000 and 92K as key levels to watch for potential price action.
Note:
Manage your risk carefully. The market is volatile, and a shakeout could happen anytime. If BTC fails to break resistance after retest, more pain may be ahead.

Btcusd:Huge trading opportunities and ideasBTCUSD's rebound after touching the position near 116180 this time is fast. From the trend observation. BTCUSD is still in a high consolidation stage. It has not broken the oscillation range for the time being. It can maintain selling near 120k. Buying near 11600 for range trading. It is expected that there will not be many trading opportunities in the London market. It will take until the New York market opens to see better trading opportunities.

BTCUSDBTCUSD also fell from a high level, reaching a high of around 119700, only 300 points away from the target of 120k. The price after the decline is now around 118600. Buying at a low level is the main focus. The reference buying point is 118500-118000. The target is above 120k. Stop loss 117300
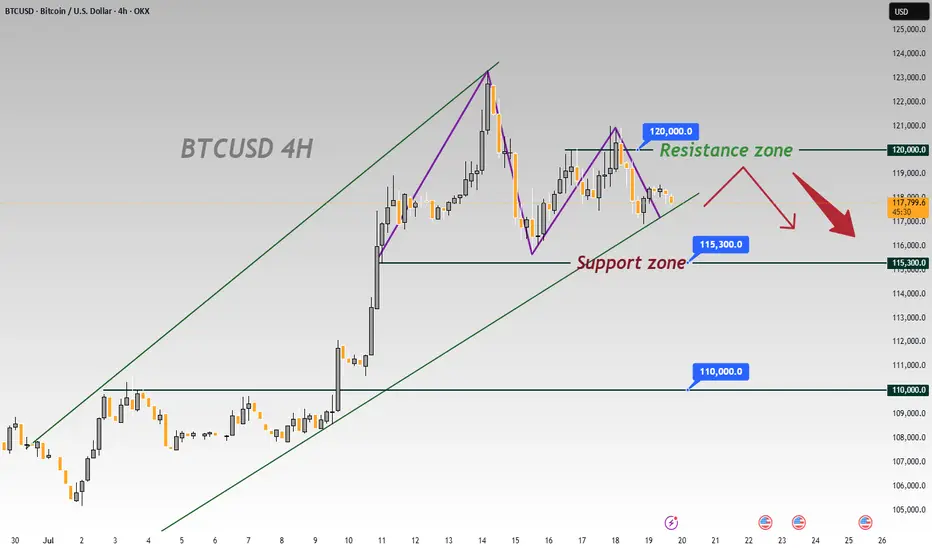
BTCUSD 4-Hour Chart Analysis: Range-Bound Trends & Key LevelsFrom the 4-hour chart of BTCUSD, the recent price movement shows obvious range-bound characteristics 📊. The upper zone around 120000 forms a key resistance level 🛑, where the bullish momentum has waned after encountering resistance 💨.
The lower level of 115300 is a significant support zone 🛡️. Previously, there was some buying support when the price retraced to this zone 👀. However, as the current price is pulling back from the resistance zone ↘️, if the bearish force takes the lead subsequently 🐻, the possibility of breaking below the 115300 support will increase ⬆️. Once it breaks below effectively 💥, the next key support level of 110000 will most likely become the target for the price to decline towards 🎯.
In terms of the short-term trend 📈, due to the obvious suppression from the resistance zone 🚧, the price will most likely continue the rhythm of testing the support downwards 🔽. In operation, one can pay attention to the breakdown situation of the support zone and layout trades accordingly 📝. Meanwhile, be alert to the possibility of a rebound after the price finds support in the support zone 🚀, and further confirmation of the direction needs to be combined with real-time K-line patterns 📊, trading volume 📈
🚀 Sell @119500 - 118500
🚀 TP 116500 - 115500
Accurate signals are updated every day 📈 If you encounter any problems during trading, these signals can serve as your reliable guide 🧭 Feel free to refer to them! I sincerely hope they'll be of great help to you 🌟 👇
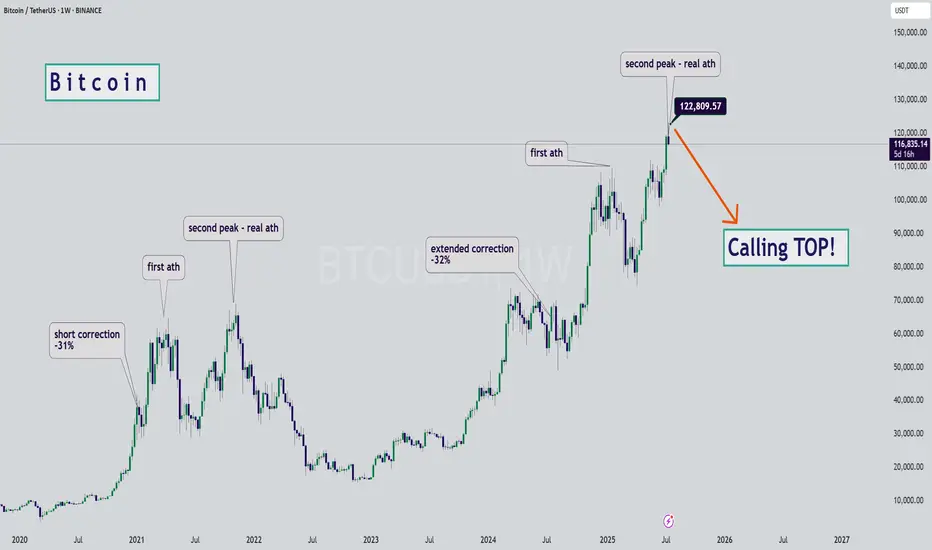
BTC - Calling the Start of the Bearish SeasonHello Watchers ☕
This was my previous Bitcoin update where I had a target of $116K, and also then closed all open positions at $122K:
I'm calling the top here mainly because of the way the chart looks, it really is classic Wyckoff if you look at the duration of the current bullish cycle, which has lasted a whole 973 Days with a 564% increase. What goes up, must come down!
Just for interest sake, the previous bullish cycle ran for 600 days with a 700% increase.
BITCOIN PREDICTION: INSIDER DATA THAT WILL HIT YOU HARD(warning)I am sharing with you my personal insider data of what I know about Bitcoin right now!

BITCOIN ABOUT TO CRASH HARD!!!!? (Be careful with your longs)I am sharing with you in this video the next CRYPTOCAP:BTC important resistances and support levels.
Together with the confirmations, it is said that if triggered, Bitcoin will start crashing hard, so be careful if you have overleveraged long positions opened right now!
Remember to always trade only with professional trading strategies and tactics, and make sure that your money management is tight!

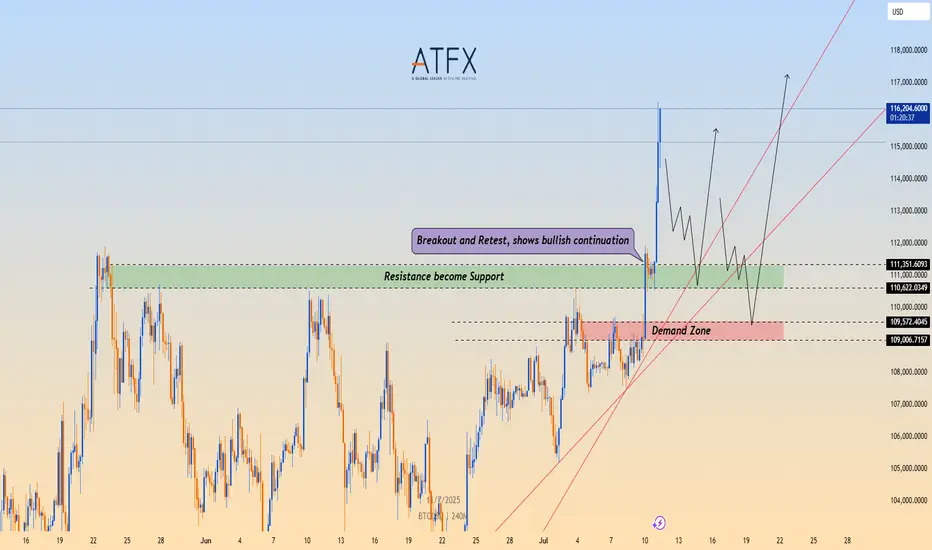
BTC/USD Breaks Out, Eyes Fresh Highs Above $116,000📉 Technical Structure
BITSTAMP:BTCUSD BTC/USD confirmed a bullish breakout above the $111,000–$111,350 resistance zone, which has now flipped into support. Price action shows a clean retest and bounce from this level, indicating a bullish continuation. Key support lies at the $110,600–$109,000 demand zone. If the price clears $116,800, bulls may target $118,000–$120,000 next.
📈 Long Trade Setup
Entry: $111,350
Stop Loss: $109,000
Take Profit 1: $116,800
Take Profit 2: $118,000
Invalidation: Break below $109,000 and trendline
🌐 Macro Background
BINANCE:BTCUSD Bitcoin rallied above $116,000 to a new all-time high after clearing the $111,000 resistance. The breakout was supported by strong momentum and optimism following a technical trendline breach. Despite some selling pressure and rising funding rates, the broader trend remains bullish. A sustained move above $116,800 could open the door toward $120,000.
📌 Key Technical Zones
Resistance: $116,800 / $118,000
Support: $110,622–$111,350, $109,006–$109,572
📘 Trade Summary
As long as BTC/USD remains above $111,350, the bullish structure is valid. Short-term pullbacks into the $109,006–$109,572 zone may offer buying opportunities.
⚠️ Disclaimer
This analysis is for informational purposes only and does not constitute investment advice.
BITCOIN: BULL TRAP???! (Be careful if you are long)Yello! I am breaking down Bitcoin, and sharing with you the Elliot Wave descending Leading diagonal formation, Rising wedge aka contracting triangle where E wave might be forming a corrective mode wave triangle itself and, after that’s formed we might start crashing if we will get the confirmations we are waiting for, and which some of them I shared with you in this video. Enjoy Paradisers!

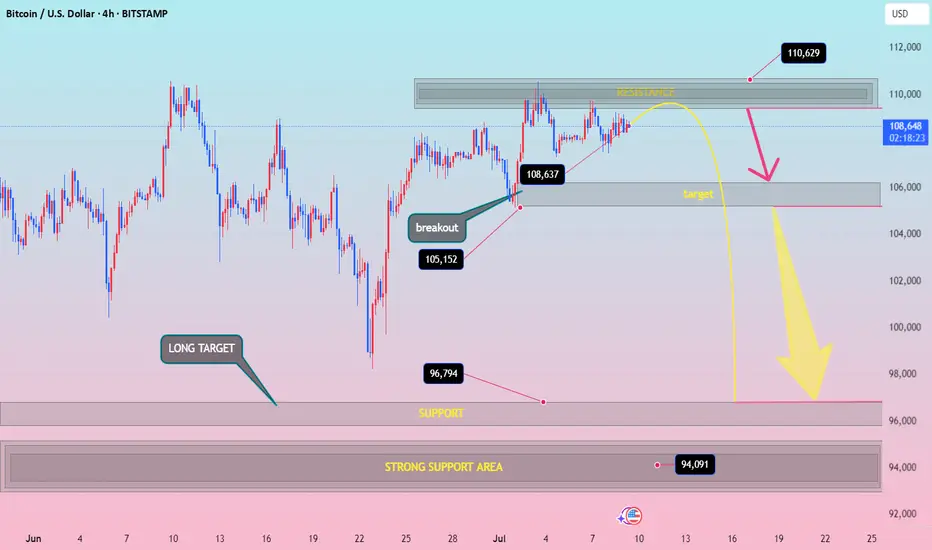
BTCUSD h4 down surelybtcusd down idia Resistance Zone: Around 110,000–111,000
Price Action Expectation:
→ Short-term push to 110,629
→ Then rejection toward 105,000, and potentially all the way down to 96,794 or even 94,091
Bearish bias after resistance is hit
⚡ Disruption Analysis (Contrarian View)
✅ 1. Resistance Flip Possibility
What if the 110,000 resistance breaks cleanly with strong volume?
Invalidates the bearish rejection arrow
Could trigger FOMO buying → Acceleration toward 112,500+
Bullish scenario: formation of a bull flag above resistance = continuation setup
✅ 2. Bear Trap Theory at 105,000 Zone
That “target” zone near 105k could be a fake breakdown zone
Market might dip there briefly, lure shorts, then reverse violently
This creates liquidity for a rapid long squeeze breakout
✅ 3. Market Structure Still Bullish on HTF
Higher lows from June 24 to July 6
Clean breakout at 105,152
Still respecting ascending structure — which is not bearish yet
🚨 Disruption Summary Chart Moves
🔼 Alternate Path 1 (Bullish Disruption):
Price consolidates under resistance → breaks above 110,629 → targets 112,500–115,000
🔄 Alternate Path 2 (Fake Breakdown Disruption):
Drops to 105,000, triggers sell-off → sharp reversal → back above 108,637
🔽 Original Path (Rejection-Based Bearish):
Still possible — but not the only high-probability path anymore
Evening BTC Trend Analysis and Trading SuggestionsLet's review this afternoon's market performance. The BTC price, as we anticipated, rebounded to around 109,000 in the afternoon before plummeting sharply. Living up to "Black Friday", this violent drop was well within our expectations. In the afternoon's live trading, we also reminded everyone that as long as there was a rebound to the upper zone, it was a good opportunity to go short. This drop has created a space of nearly 1,500 points. Currently, the BTC price has pulled back to around 107,800.
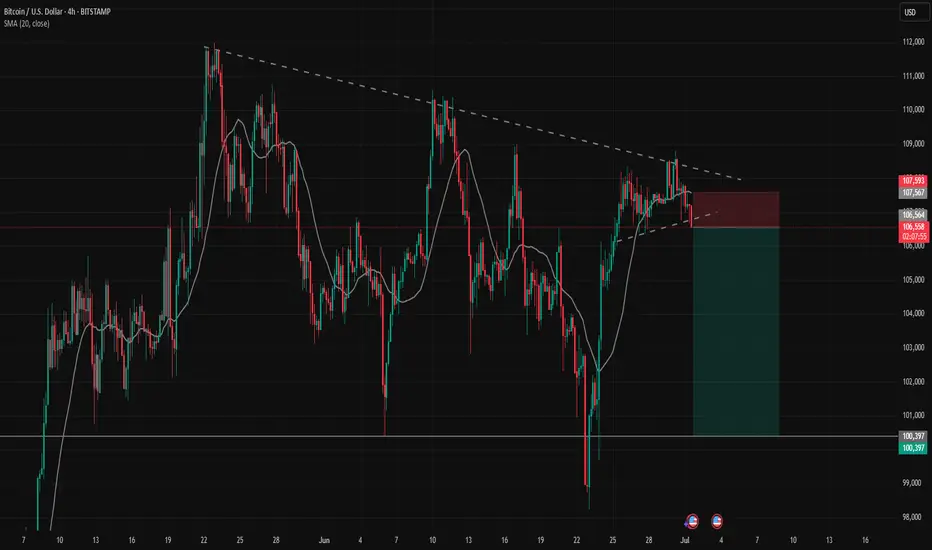
From the current 4-hour K-line chart, after a strong upward surge, the market encountered significant resistance near the upper track of the Bollinger Bands. As bullish momentum gradually faded, the price started to come under pressure and decline, suggesting that the short-term upward trend may come to a temporary halt. At present, the market has recorded multiple consecutive candlesticks with large bearish bodies. The price has not only effectively broken below the key support level of the Bollinger Bands' middle track but also caused the Bollinger Bands channel to switch from expanding to narrowing, indicating that market volatility is decreasing. In terms of trading volume, it showed a moderate increase during the price pullback, which further confirms the authenticity of the bearish selling pressure.
BTCUSD
sell@108000-1085000
tp:107000-106000
Investment itself is not the source of risk; it is only when investment behavior escapes rational control that risks lie in wait. In the trading process, always bear in mind that restraining impulsiveness is the primary criterion for success. I share trading signals daily, and all signals have been accurate without error for a full month. Regardless of your past profits or losses, with my assistance, you have the hope to achieve a breakthrough in your investment.
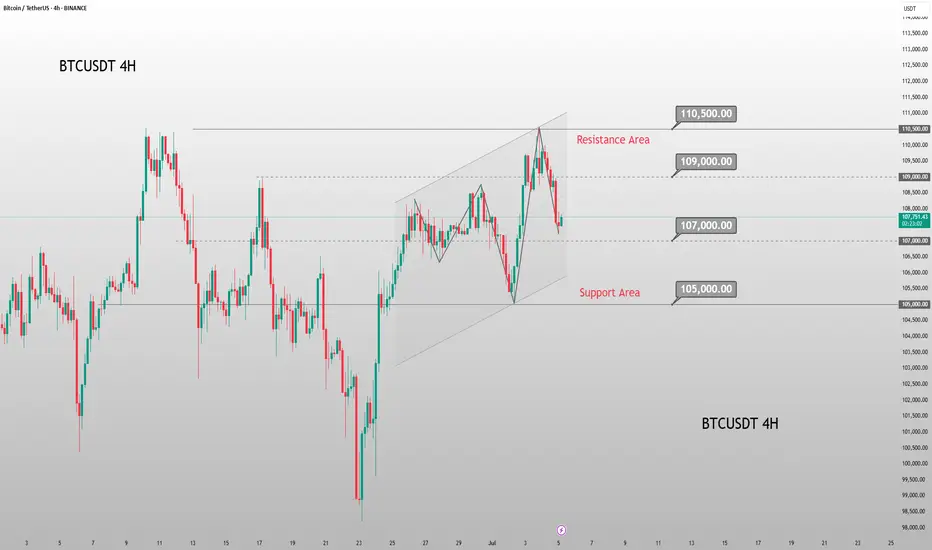
On BTCUSD’s 4 - hour chart, downside risks prevailOn BTCUSD’s 4 - hour chart, downside risks prevail:
Resistance Holds
Price failed to break 110,500, showing strong selling pressure that caps bulls 🚫. A pullback is likely.
Downtrend Signals
Post - resistance, price is retracing. Candlesticks and chart arrows point to a drop toward 105,000 support, fueled by building bearish momentum ⬇️.
Support Test Looms
105,000 is the next key level 🔑. Even if support slows the fall, the setup favors downside—bullish reversals seem unlikely after resistance failure.
Trend Weakness
Orange trendlines show the prior uptrend is fragile 🧊. Failing at 110,500 signals fading bullish force, setting up for a bearish correction.
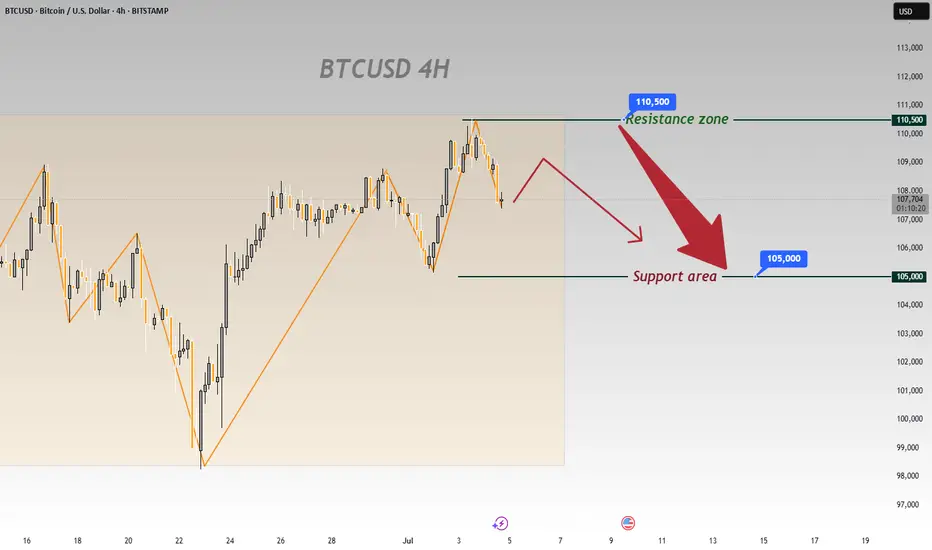
In short, the 4 - hour chart is bearish. Watch for drops to 105,000; 110,500 will likely block bulls 🛑. Trade cautiously with this bias.
🚀 Sell@108500 - 107500
🚀 TP 106500 - 105500
Accurate signals are updated every day 📈 If you encounter any problems during trading, these signals can serve as your reliable guide 🧭 Feel free to refer to them! I sincerely hope they'll be of great help to you 🌟 👇
BTC shorting opportunity comes againBTC climbed above 108000 again, and the short-term bullish power was slightly stronger. According to the current strength, BTC still has room for growth, but it is still under pressure in the 109000-110000 area in the short term; if there is no major positive news, BTC may find it difficult to break through the resistance area in the short term under the current conditions, and may even experience stagflation and retreat again after approaching the resistance area.
Therefore, I think shorting BTC with the help of the resistance area is still the first choice for short-term trading. We can boldly short BTC in the 108500-109500 area and look towards the target area around 106000 again.

SELL BTCUSD trading signalBTCUSD confirmed the weakness at the trendline resistance zone on the h4 time frame.
The h1 time frame price confirmed that the sellers won when the candle closed below the nearest trendline support zone.
In terms of wave structure, there is no strong support zone that is strong enough to keep the BTC price uptrend in the short term. Therefore, the target of the SELL signal can reach 100,400. That is the wick area of the past liquidity candle where the buyers won over the sellers and pushed the price up sharply.
BTC\USD SHORT TRADE SETUP BTC/USDT – Short Trade Setup Breakdown (Technical Outlook
Trade Thesis
The area between 103,800–105,000 serves as a strong supply zone, and we’re seeing signs of exhaustion in bullish momentum. The setup suggests a high-probability short opportunity with tight confirmation.
🔸 Entry: Positioned at 103,800, just below resistance, to capture early weakness and avoid chasing.
🔸 Risk Level: The resistance at 105,000 is critical — any break and close above may invalidate this setup.
🔸 Targets:
🎯 Target 1: 97,000 – conservative exit at mid-range demand zone
🎯 Target 2: 96,000 – full target near bottom of the descending channel

Short BTC, it is about to retrace and test 100000 again!As BTC gradually fell back, the rebound did not stand above 110,000 in the short term, proving that there is strong selling pressure above, and the trend line formed by the technical high point 111,000 and the second high point 110,000 formed an important resistance area, which limited the rebound space of BTC and strengthened the demand for BTC's short-term retracement.
According to the current trend, the short-term oscillation bottom area of 106,000 may be broken at any time. Once it falls below the oscillation area, it may arouse a certain degree of profit-taking chips and stimulate BTC to accelerate its decline. I think BTC will at least test the 105,000-104,000 area again during the retracement, and may even test the 100,000 integer mark again.
Therefore, shorting BTC is still the preferred option for current short-term trading.
Consider shorting BTC in the 108,000-109,000 area, and the target area in the short term is 104,500-103,500. After breaking this area, the target can be extended to 101,000-100,000.
BINANCE:BTCUSDT BINANCE:BTCUSDT BITSTAMP:BTCUSD

Thief Trader Setup: Robbing the BTC/USD Market Reversal🏴☠️💰 Bitcoin Heist Blueprint: BTC/USD Robbery Plan by the Thief Trader Crew 💰🏴☠️
(Swing & Day Trade Outlook – Clean Entry, Clean Exit, No Fingerprints Left Behind)
🌟 Hi! Hola! Ola! Bonjour! Hallo! Marhaba! 🌟
To All Market Raiders & Silent Money Makers 🤑💸💰✈️
This isn't your average BTC/USD analysis — this is a strategic market heist, crafted from the Thief Trading Playbook.
We're planning a clean operation based on both technical setups and fundamental awareness.
Let’s enter smart, exit faster, and leave no trace — just profit. 🏆
🎯 THE GAME PLAN: Unlocking the BTC/USD Vault
📈 Entry – “The Vault’s Cracked Open!”
The plan kicks off with retest entries on the 15 or 30-minute chart.
Sell limits should be placed around recent highs or lows where market momentum pulls back.
Precision and patience are your tools.
🛑 Stop Loss – Backup Escape Route
Use the 1D swing high/low (e.g., 104.500) as your SL zone.
Position size smartly, factoring in risk %, lot size, and number of active orders.
🏁 Target – 94.000 (Or Bail Out Before It Gets Hot)
Don’t stick around too long — cash out near the zone or before if price slows or traps emerge.
Secure the bag, vanish before resistance bites back.
🧲 Scalpers – Quick In, Quick Out!
Stick to the short side only — short the bounces, trail your SL, and move with stealth.
Big players can strike straight; others can shadow the swing crew and trail behind with protection.
🧠 Why This Works – Market Pulse
BTC/USD is facing overbought pressure, consolidation traps, and is nearing a critical MA Zone where reversals tend to form.
Momentum shows signs of weakening, and the bears are regrouping — that’s where we slip in and out.
Supporting Factors Include:
Macro trends
Fundamental sentiment
COT positioning
On-Chain signals
Intermarket flow
Key psychological levels
🔍 All these build the narrative behind this bearish setup. This is more than just price action — it's a calculated move.
⚠️ Trading Risk Alert: Stay Off the Radar During News Drops 📰🚨
Avoid new entries during major news events — increased volatility = increased risk.
Use trailing stop-losses to lock in profits while staying protected during spikes.
❤️ Like the Plan? Power the Crew!
If this setup helped you see the market differently, hit the 💥Boost Button💥.
Every like supports the effort and helps sharpen our future plans.
Trade with style, move with purpose — Thief Trader Style.
🚀 Stay tuned for the next setup from the shadows. Until then — stay sharp, stay strategic, and always protect your profits. 🐱👤💰📉📈

BTC Slumps Below 100000, Rebounds to Test 109500 Short Zone💎 BTC Rebounds After 100000 Drop, Eyes Short at 109500 Resistance 📊
BTC dipped below the 100000 threshold 🔻 before rebounding near 98000 🔺—a move tied to DXY weakness and easing geopolitical tensions. Now challenging the 110000 mark 🔼, it faces stiff resistance at 109500. First-time 110000 tests often spark pullbacks, making shorts the favored play here 📉.
🚀 Sell@108500 - 107500
🚀 TP 106500 - 105500
Accurate signals are updated every day 📈 If you encounter any problems during trading, these signals can serve as your reliable guide 🧭 Feel free to refer to them! I sincerely hope they'll be of great help to you 🌟 👇

BTC's Mid 2025 OutlookBitcoin is currently trading around $107,000 on the 4-hour 4H timeframe, navigating a consolidation phase following a sharp rally that culminated in a new all-time high of $111,900 in May 2025. Despite recent price corrections, BTC remains up 3% on the week, reflecting underlying bullish momentum. This sustained strength hints at continued confidence in the market, particularly among larger players.
A notable development supporting this view is the increase in the number of Bitcoin wallets holding at least 10 BTC, which has surged to a three-month high of 152,280. This metric is widely regarded as a proxy for whale activity and may indicate renewed institutional interest, especially amid accelerating inflows into spot Bitcoin ETFs.
On the 4H chart, Bitcoin appears to be consolidating within a tight range, hovering just beneath a key supply zone at $107,000, which could act as short-term resistance.
Several potential outcomes are currently in play:
Bullish scenario:
A breakout above the $107,000–$108,000 range could clear the path toward the critical resistance at $115,000. A successful move above this threshold would likely signal resumption of the broader uptrend, with some technical analysts eyeing a potential cup and handle formation that could project long-term targets up to \$180,000
Bearish scenario:
If BTC fails to hold above the current level, it may correct toward the first major support at $102,800, with further downside risk to $98,500. In a more pessimistic setup, price could extend losses toward $96,000, especially if macroeconomic or geopolitical pressures intensify
Key levels to watch:
Resistance: $107,000 - $115,000
Support: $102,800 - $98,500 - $96,000
Market Sentiment and External Drivers:
Bitcoin's price is being shaped not only by technical dynamics but also by powerful external forces
Spot Bitcoin ETFs:
The US regulatory greenlight for spot ETFs has dramatically altered market dynamics. With projections of $190 billion in assets under management AUM for these products by the end of 2025, institutional access to BTC has become more streamlined, providing strong tailwinds for long-term accumulation
Geopolitical risk and macro conditions:
Global uncertainty, particularly due to escalating tensions in the Middle East and potential US military involvement, has introduced volatility. At the same time, rising inflation and economic instability in developed markets is a double-edged sword, either undermining risk assets or conversely boosting Bitcoin’s narrative as digital gold and a hedge against fiat devaluation
Forward-Looking Outlook:
Bitcoin is at a critical juncture. The ability to sustain above $107,000 and reclaim the $115,000 resistance will be pivotal. A confirmed breakout could open the door to price discovery and possibly a surge toward $130,000 to $150,000, with $180,000 as an extended target in more bullish scenarios
However, a failure to hold key support levels could shift momentum toward the bears, prompting a deeper correction toward the $96,000 zone. Traders should monitor:
- Price reaction around $107,000 and $115,000
- ETF inflow data and AUM growth
- Macro news especially inflation reports and central bank commentary
- Developments in global conflict zones impacting risk appetite
Conclusion:
Bitcoin’s medium-term direction hinges on a delicate interplay of technical consolidation institutional flow and macro geopolitical signals. While the bullish structure remains intact for now a decisive move in either direction above $115,000 or below $98,000 could set the tone for the next major trend.

BTC Rebounds After 100000 Drop, Eyeing Short at 109500 Resistanc📈 BTC Rebounds After 100000 Drop, Eyeing Short at 109500 Resistance
BTC dropped below the 100000 threshold 🔻 and then rebounded near 98000 🔺. This movement is related to the decline of DXY and the reduction of geopolitical risks. Now, BTC is challenging the 110000 level 🔼. The overhead resistance is around 109500. First - time tests of the 110000 level typically trigger pullbacks, so we favor short positions here 📉
🚀 Sell@109500 - 108500
🚀 TP 107500 - 106500 - 105500
Accurate signals are updated every day 📈 If you encounter any problems during trading, these signals can serve as your reliable guide 🧭 Feel free to refer to them! I sincerely hope they'll be of great help to you 🌟 👇
