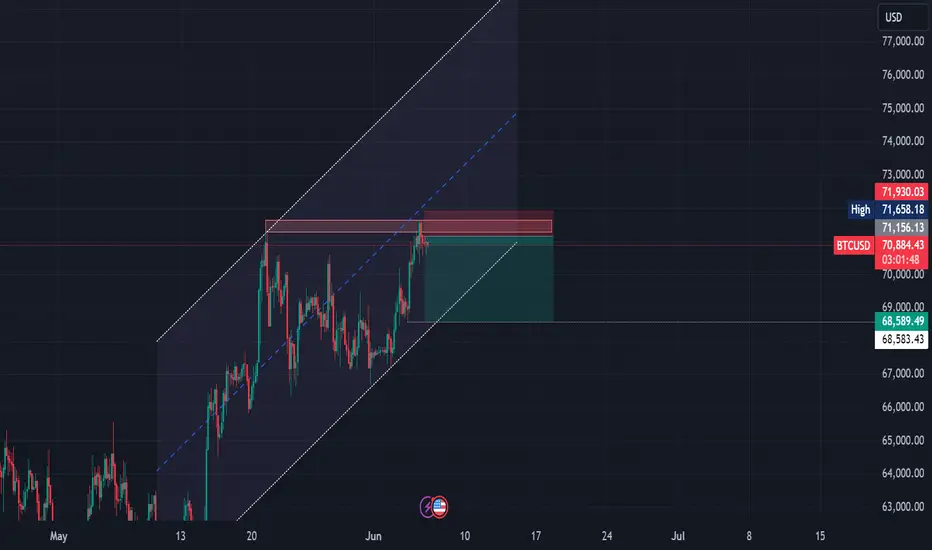
BTCUSDT to hit resistance around 70.5k and drop towards 67k Here is a new short trade idea. The price has been pushing up after the last big drop around 5 percent. The price found support around 68.5k zone and since then it is pushing up slowly. This push has been really slow and likely to reach till the low TF resistance LTFR1. I expect that the resistance there would make the upward push of the price to stop and then push it downwards. This rejection of the price at that resistance level will lead the price to look towards the next support on its way down. The next major support is weekly support around 66.7k-67.7k. Therefore, a short trade favorable from there towards weekly support WS1 around 67k.
Btcusdtshort

Why is Bitcoin crashing below $68,000?Bitcoin’s price has been having difficulty approaching its all-time high of $75K and is still consolidating.
On Friday, the cryptocurrency tanked below $70K, and if the current level supporting the price breaks down, an even deeper correction could be expected.
Looking at the 4-hour chart, things seem tricky for Bitcoin. An ascending channel is currently being formed around the $70K mark. The price has already tested the pattern’s higher trendline and the $72K resistance level twice. It was rejected decisively and is testing the SWB:69K support level once again.
A breakdown of this level could cause even more trouble. If the pattern is broken to the downside, a deeper drop toward the $60K would likely materialize in the short term.
With the RSI also below 50%, the bearish scenario seems probable.
WHITEBIT:BTCUSDT

BTC Short Scalp 4Hr TFBTC is rejected 4-5 times from the 4hr+1D supply zone. Now 1D closure is going to be bearish engulfing which will be good upcoming bull run.
This pullback will give us more buying opportunities.
Get ready and hold on your spots.
Dont forget to follow and share please.

Bitcoin (BTC) Price Resurgence, Binance Coin (BNB) Hits a New HThe price of the primary cryptocurrency has been on an uptrend in the past few days, rising to as high as $71,700 on June 5. Currently, it hovers the $71,000 mark (per CoinGecko’s data), representing an 11% increase on a monthly scale.
The resurgence coincided with record figures related to spot Bitcoin ETFs in the USA. Those products witnessed a total inflow of almost $900 million yesterday, the second-best day since their approval in January.
Numerous analysts believe BTC could soar even higher in the near future, assuming certain factors are in place. The X user, Captain Faibik, predicted a rise above $90,000 should the asset surpass the “crucial resistance level” of $71,300.
On the other hand, Ali Martinez assumed that a pullback is not out of the cards based on the TD sequential, which presents a sell signal on the four-hour chart. This technical analysis tool identifies potential price exhaustion points in the market and indicates when a trend is likely to reverse.
btcusd analysis elliot. Don't forget about stop-loss.
Write in the comments all your questions and instruments analysis of which you want to see.
Friends, push the like button, write a comment, and share with your mates - that would be the best THANK YOU.
P.S. I personally will open entry if the price will show it according to my strategy.
Always make your analysis before a trade

BTCUSD Bitcoin / US Dollar Bearish Side Money Heist PlanMy Dear Robbers / Traders,
This is our master plan to Heist BTCUSD Market based on Thief Trading style Technical Analysis.. kindly please follow the plan I have mentioned in the chart. Our target is Green Zone that is High risk Dangerous level MA act as a Dynamic Support & Order Block, So the Market is oversold / Consolidation / Trend Reversal at the level Bullish Robbers / Traders gain the strength. Be safe and be careful and Be rich.
Note: Day traders & Scalpers If you've got a lot of money you can get out right away otherwise you can join with a swing trade robbers and continue the heist plan,
Loot and escape on the target 🎯 Swing Traders Plz Book the partial sum of money Use Trailing Stop To Protect Looted Money and wait for next breakout of dynamic level / Order Block, Once it is cleared we can continue our heist plan to next new target it will update after the Breakouts.
support our robbery plan we can easily make money & take money 💰💵 Join your hands with US. Loot Everything in this market everyday.

channel of btc btc should come and complete channel if see chart you can understand third wave cant hit resistance so show have not potentially for raise and need correction for raise again

BTCUSDT at resistance and likley to head to 67.3k and 66.3kThe price is showing weakness here and seems to be inclined to go downwards. Here is a short idea based on this inclination. Next supports are 4HS1 and DS1. We take profit at 4HS1 which is the first support zone. The price may bounce there, and therefore we will reevaluate the price action there. The price may eventually then target DS1 subsequently which is a stronger support and provide very good support for the price. However, we focus on 4HS1 first and then we will reevaluate there about our next action.

📉Think Outside the Box BTC!📈BINANCE:BTCUSDT
COINBASE:BTCUSD
Hello Dear Traders.
🔴The market has reached the end of its suffering range and our team's holiday break is nearing its end.
⚡️ In this post I will track the BTCUSDT movements as long as it stays inside the Box.
🔴The past few weeks, the pressure of market volatility was very high and we needed a break.
We will review the market again from today.
Please share the analysis posts to support and give us energy.

BTCUSDT likely to head down from hourly resistance around 68.3kHere is a short idea. The price has bounced several times from hourly support but is likely to break it on the next drop. The price may hit hourly resistance HR1 first before that and then reverse from there triggering our short trade. The price is likely to go down towards the target of this trade around 68.3k. Lets see where it goes.


Bitcoin at $71k: Should you grab BTC today or wait? SHORT NOWAs Bitcoin continues to dominate the cryptocurrency market, its recent price movements have caught the attention of investors and analysts alike. Over the past few months, Bitcoin has shown a significant increase, with a surge of over 100% year to date, and a notable rise of 9.8% in just the past week.
Despite reaching a new peak above $73,000 in March, Bitcoin is currently facing challenges in surpassing the $67,000 resistance level. Recently, after hitting a 24-hour high of $67,697, it slightly retracted by 0.7%, bringing its current trading price to around $66,800.

BTCUSDT at daily resistance, very likely to head to 65k Our short trade is still in progress. However, here is a new short trade idea. The probability of the price to move lower now is higher than before. The price is still trading at daily resistance DR1. I have updated the resistance zone. The price is likely to head towards daily support DS1 and that is the target of our this trade idea as wll as the previous one. We will look for a long opportunity from there.

I'll share a short-sighted RBI of Bitcoin#BTC
Hi, Friends!
Good to see you all.
I hope you have a joyful weekend.
Let me explain the short-term perspective of Bitcoin
■ The BLUE resistance line has not been able to break through upward.
■Bearish Divergence as RED appears.
■Red short-term uptrend line is broken down.
■ Expected to fall after retesting.

📈Bitcoin on its way to $80K? / Serial analysis on BTC📉BINANCE:BTCUSDT
COINBASE:BTCUSD
Hello dear traders.
⚡️ In this post I will track the BTCUSDT movements from 11 Apr - 18 Apr.
📈 What to Expect Next?
💡The price of Bitcoin is in a vital situation. As long as the price is above the BB midline, the bullish scenario is quite valid.
The bullish scenario targets are on the price chart.
🔑Key Insights:
The level of $72,784 is the optimal level for risk-freeing long positions.
The risk of this position is lower in the upward direction due to the price trend. But in the case of falling prices, a possible scenario is drawn in the chart.
📉On the other hand, if the price fails to receive the necessary support at the mentioned level, the bearish scenario will be activated around the target of $69,400.
A price stabilization below the middle line of the Bollinger Band can push the price down to pullback to the pitchfork.
◀️Reverse scenario:
🔴Major and hidden divergences are also plotted in the chart. The $67000 level is Bitcoin's support in a bearish scenario.
🔴The main divergence is related to the OBV indicator, which reinforces the bearish scenario.
On the other hand, the hidden divergence is related to the RSI indicator, which reinforces the bullish scenario.
🔴The failure of specified support level will bring Bitcoin down to around $65,100.
✅Entering a bearish or bullish scenario with the help of price behavior above or below the 4-hour Bollinger midline can be the most optimal strategy in the current market conditions.

BTCUSDT at daily resistance, likely to pullback to 64khe price has finally hit the daily resistance DR1 and that triggers my short trade idea from there.
I think the price will pullback here towards low timeframe support LTFS1.
Therefore LTFS1 is the target of this short trade. Lets see where it goes from here. Let me know what you think in the comments.

BTC USD SELLThere is a potential trend reversal on the Weekly timeframe.
Stop loss: 69785
Take profit: 43133

SHORT BITCOIN USD (BTCUSDT) Like, comment and share with your peers!
BTCUSDT has been ranging between 63472.06 and 62407.87 since mid day 13-May. The break and closure of 1 hour price bar (candlestick) below 62500 zone would result in an aggressive drop.
Entry - anywhere below 62500 (once our condition is met)
Target - 59500 (partial targets can be seen on the charts)
Exit/SL - break and closure above 63472.06
Warning:
1. trading derivative could result to loss of your capital, kindly apply caution and use only the money you can afford to lose.
2. Previous performance is not a guarantee that my signals will profit you. Accept and implement this idea at your own risk.
You are advised to apply proper risk management while trading derivatives...!!!
BR,
Kings
Learn how to trade. See my signature below or visit my profile for more details

BTCUSDT at 4h resistance and likely to pullback towards 61kHere is a short trade idea setup. I have taken this short trade with very tight stop loss. along with small position size. The price has moved up since we closed our long. It has now reached a key resistance level which was the level from where the price dropped last time. Therefore, this level will present significant resistance here and it will cause the price to pullback here. It has now reached a key resistance level which was the level from where the price dropped last time. Therefore, this level will present significant resistance here and it will cause the price to pullback here.

BTCUSDT.P Game Plan For The Week! I did not find the liquidity grab convincing, I will try to look short with a 15m down break from the month's high. In case of PWL manipulation, Long can be searched with 15-minute breaks.

I can be bearish or bullish but right now, i am bearish I was bullish before. but now I am bearish because the bottom point that needs to be protected is broken. There are two different scenarios, there is a liquidity below, if the price comes below that point, the decline will continue, but if the previous peaks I mentioned are broken, I can look bullish on the market, but I am currently bearish.

🚨Bitcoin is Ready to Go Down again🚨✅ Bitcoin finally managed to break the 🟢 Heavy Support zone($61,100-$58,700) 🟢 and the lower line of the Descending Channel and 100_SMA(Daily) .
🏃♂️Bitcoin is currently pulling back into the 🟢 Heavy Support zone($61,100-$58,700) 🟢 and moving near the 🟡 Potential Reversal Zone(PRZ) 🟡.
😱The Fear and Greed Index entered the " Fear zone " again after more than 4 months .
🔔I expect Bitcoin to start going down again and at least to the 🟢 Support zone($57,050-$56,550) 🟢.
❗️⚠️Note⚠️❗️: An important point you should always remember is capital management and lack of greed.
Bitcoin Analyze ( BTCUSDT ), 15-minute time frame ⏰.
Do not forget to put Stop loss for your positions (For every position you want to open).
Please follow your strategy; this is just my Idea, and I will gladly see your ideas in this post.
Please do not forget the ✅' like '✅ button 🙏😊 & Share it with your friends; thanks, and Trade safe.

(BTCUSD) needs positive momentumThe largest cryptocurrency in the world recorded its highest levels ever
Expected scenario: continuation of the upward trend
Bitcoin (BTCUSD) price trading stabilizes around the 70200 level after the rise it witnessed yesterday, and we notice that the Stochastic indicator is showing negative signs that hinder the price’s mission to continue rising, waiting to gather positive momentum that will contribute to pushing the price to resume the upward wave that targets the 73700 level as the next main station.
We will continue to favor the upward trend for the coming period, relying on the positive effect of the previously completed double bottom pattern, while recalling the importance of stability above 68200 as a first condition for the continuation of the expected upward wave.
The largest cryptocurrency in the world recorded its highest levels ever
The prices of the digital currency "Bitcoin" fell during trading on Friday as part of a process of breathing and profit-taking, and under the pressure of the continued rise in the levels of the US dollar ahead of the release of important economic data from the United States.
The largest cryptocurrency in the world, “Bitcoin,” provided the best quarterly performance in a year during the first quarter of this year, and recorded earlier in March trading its highest levels ever, thanks to financial flows linked to funds traded on American stock exchanges.
Throughout the trading of the first quarter of this year, which officially ends at settlement today, next Sunday, Bitcoin prices have so far risen by more than 65%, on the verge of achieving the second quarterly gain in a row, and the largest quarterly gain since the first quarter of last year. .
On Thursday, March 14, the largest cryptocurrency in the world recorded its highest levels ever at $73,794, thanks to record flows into the market and successive regulatory approvals in most parts of the world, and after Micro Strategy announced the second largest A purchase you have been making since you started owning Bitcoin approximately four years ago
