Btcusdtshort

simple prediction with 2 line(btc is going to touch 16k)btc is going to 16k again.u will see,i promise u
btc is going to 30k at first it can be 32k but after that its going to fall and touch 16k again

BTCUSDT hit resistance, likely to retrace hereThe price has again hit the upper resistance zone. I am going for a short here with very limited risk.

Short Bitcoin with this Great RRR!BYBIT:BTCUSDT.P
1h time frame
-
Bitcoin is getting from the range high again.
My recommended short zone is 28.5~28.8k, and target at 26.6k
Try this low risk and high return trading!

BTCUSDT Trade Set-Up shortI'm going for a short from here since the divergence showing a bit bearish, and PCI data in 48Hours the expected forcase is like 0.3 increased, Forthis week we may see some drop to again 27000 Levels.

📈BTC analysis above 28K resistance📉BINANCE:BTCUSDT
COINBASE:BTCUSD
Bitcoin analytical series S01E10
Hello, traders don't forget to risk-free your positions.
Long targets ----> super-trend resistance & 28875$
Please share ideas and leave a comment,
Let me know what's your idea.
CrazyS✌

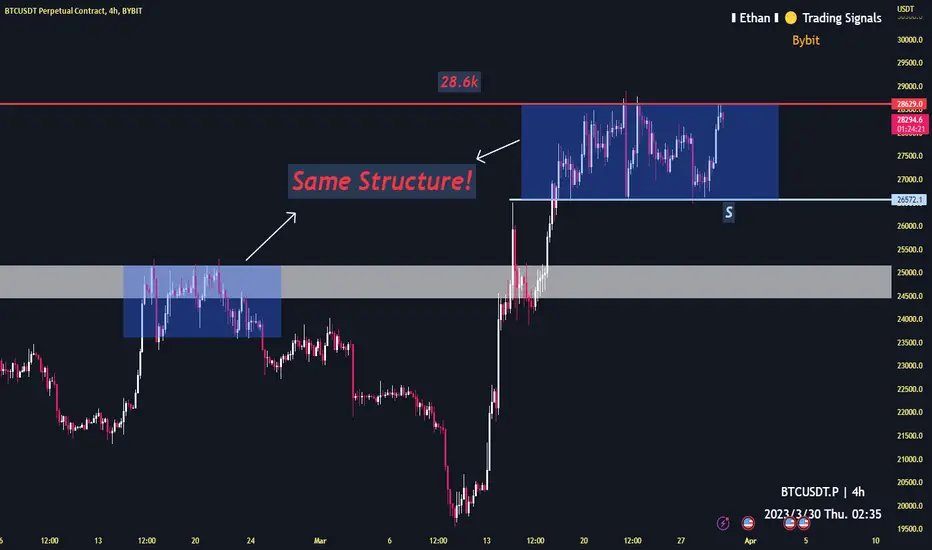
Watch out the same top structure on BitcoinBYBIT:BTCUSDT.P
1h time frame
-
Bitcoin pumps aggressively but has low volume.
It's a bearish signal, so tend to see it breaks below this box in near future.
Bitcoin Analyze (Short Term, Double Zigzag Correction)!!!To complete wave 4, Bitcoin has created a Double Zigzag Correction structure inside the ascending channel and support zone ($26,980-$26,580)🟢.
The end of wave Y can be above the upper line of the ascending channel and 🟡Price Reversal Zone (PRZ)🟡.
I expect Bitcoin to reach the lower line of the ascending channel and most likely break the channel down.
If you would like to have a better view of the wave count in the 15-minute time frame, I suggest you look at the below post for a few seconds.👇
Bitcoin Analyze ( BTCUSDT ), 15-minute time frame ⏰.
Do not forget to put Stop loss for your positions (For every position you want to open).
Please follow your strategy, this is just my Idea, and I will be glad to see your ideas in this post.
Please do not forget the ✅' like '✅ button 🙏😊 & Share it with your friends; thanks, and Trade safe.

BTCUST1) Bitcoin is completing the 3rd Elliot wave on the weekly time frame.
2) In the daily time frame, 3 corrective waves have been formed and in the last few weeks we have seen the formation of an upward trend in the market.
3) In the 4-hour time frame, you can easily see this wave, which exists due to the upward momentum of the expectation of correction up to the price range of 25500.
4) Also, the formation of a doji pattern in the weekly time frame and the divergence that exists increases the possibility of a fall. But in my opinion, this cannot be more than 25,000.

BTCUSDT | TFW Wave Analysis | Inverted H&S Retesting Neckline?The current uptrend wave is potentially a leading diagonal with a valid inverted head & shoulders reversal pattern breakout - now with a DOJI candlestick this week, the price could retrace to the neckline level 25k, watchout for a false breakout then most likely to breakdown - SHORT ENTRY to the neckline level and EMA200 week -20+% downside
(A valid inverted H&S consists of a strong downtrend with at least twice length of the head & shoulders pattern and massive volume breakout)

BTCUSD- Upcoming Big Reversal on Bitcoin!!! hey everyone, BITCOIN spiked up due to collapsed of SVB BANK alongside gold, this is due to the uncertainty that market created. As we are looking for upcoming moves we are expecting prices to be bullish until 28k after we have where we believe that price will reject.
GOOD LUCK AND HAPPY TRADING.

BTCUSDTBTCUSDT currently trading in a rising wedge and size of Highs and Lows becoming smaller than previous which indicates a perfect wedge, we will enter a short trade if price breaks the last low + wedge, if price don't breaks the last low + wedge and moves upside, we will cancel current entry and wait for next trade.

📈BTC analysis near release of PMI data📉BINANCE:BTCUSDT
COINBASE:BTCUSD
Bitcoin analytical series S01E09(UPDATE)
Hello traders, don't forget to risk-free your positions.
Long targets ----> above Green lines.
Short targets ----> below Green lines.
Please share ideas and leave a comment,
Let me know what's your idea.
CrazyS✌

Current Move For BTCHello traders, I am expecting a drop to lower demand zone and then to the next supply zone.
enjoy trading <3

A short term idea of how BTC will moveHello,
You can see here the pattern BTC might form. We might see 28600 first and then back to 27400.
Please be aware that patterns do fail .
A different outlook of M Pattern is below. M pattern can be of many kinds. It does not need to be a perfect M.
BTC is bearish. I do not suggest a long position.
You can take a short position at 28500 and take part entries with low lev.
TP at 27500. Follow risk Management
Never use high Lev. Protect your funds.
We have BTC in the oversold zone in 1 day and 1 week.
CME gap at around 21000
Thank You

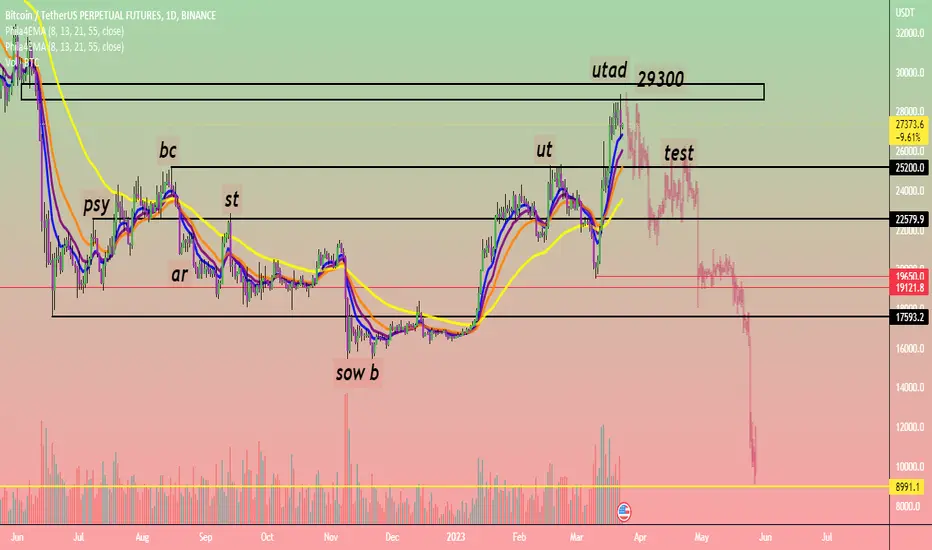
Btcust distribution on daily time framebtcusdt formed distribution on daily timeframe now the price is on utad area .. if price respect bellow 29400 then
btcusdt ll no more bullish ,, the structure ll be change..
if it happened then price ll go down for lower low 12k 9.7k round about ...
not a financial advice just it is for the learning purpose
📈BTC scenarios during FOMC decision📉BINANCE:BTCUSDT
COINBASE:BTCUSD
Bitcoin analytical series S01E09
Hello traders, don't forget to risk-free your positions.
Long targets ----> above Green lines.
Short targets ----> below Green lines.
Please share ideas and leave a comment,
Let me know what's your idea.
CrazyS✌

BTC gonna dump?Most of us probably noticed how BTC Dominance pumped these days. Almost came to the level at 48%.
Decided to check how it was last times when BTC dominance began to fall.
The rest you can see on the chart. interesting if it will be the same tomorrow..

Btc | Smaller Time Frame | Expecting CorrectionBtcusdt
Formed ABCD Bearish Pattern , Expecting 25500 / 23600 Before Next Bullish Move
#Dyor


Bitcoin Short ...Bitcoin should back to KijunSen ... This is not signal... Dont risk more than 3% of your account on any trade...

Bitcoin...Bitcoin Falling Flag/edge ... This is not signal... Dont risk more than 3% of your account on any trade...

Bitcoin Weekly Update Critical week for Banks and Bitcoin. The FOMC meeting is important to predict the direction of all markets. Macro factors are still bearish. Chances of a blackswan are likely.
