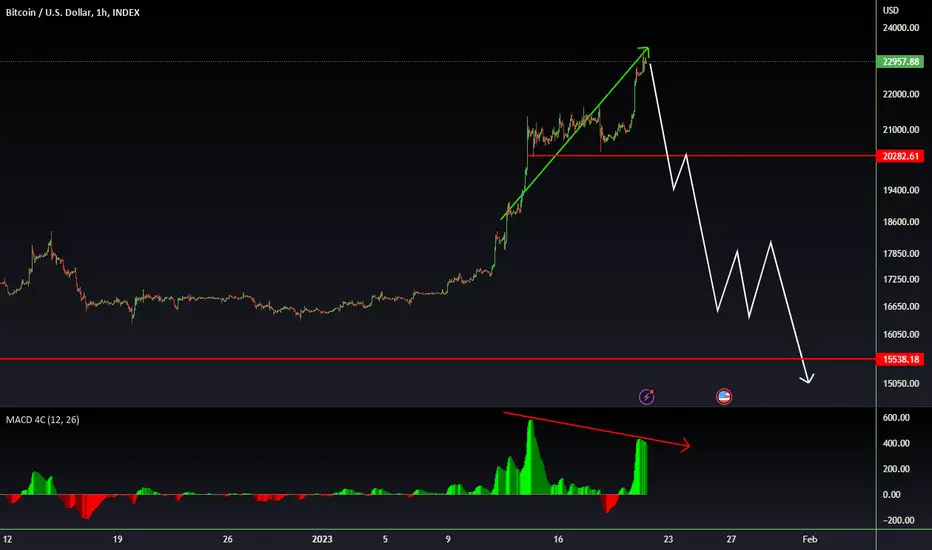
BTCUSD💥1H-TIMEFRAME ANALYSISBTCUSD💥1H-TIMEFRAME ANALYSIS
💗Hello ladies and gentlemen
This is my new idea for 💥BITCOIN
I hope my idea is clear
Support me by like and share thank you
Stay Safe💯💲💲💲
Good luck💰😍
Btcusdtshort
BTC - Head and ShouldersBYBIT:BTCUSDT.P
4h time frame
-
BTC forms a head and shoulders on 4h
TP and SL are marked on the chart which provides great RRR
However, we're still in a healthy bullish run
So we can buy it immediately if hit 22000 or 21200 with a weak low

Bitcoin Head & Shoulders!CME:BTC1!
BTC has formed a head and shoulders. Timeframe 12H.
Clearer on 4H where you can look for entries for pullback to breakout level which has confluence with 50MA.
Because BTC is in such a parabolic move the possibility of a fake out of the H&S neckline could occur as a liquidity run to pick stops. Look to long the break back in of the fake out.
Normally BTC doesn't provide pullback entries when it's on a parabolic move so always have Plan A, Plan B setup.
If you liked this idea or if you have your own opinion about it, write in the comments.
The information and publications are not meant to be, and do not constitute, financial, investment, trading, or other types of advice or recommendations.

Up or Down, bitcoin idea by summerAn idea regarding the situation and movement of Bitcoin, maybe it's completely wrong, but if everything goes as planned, it's an ideal situation.
Thanks for your opinions and information

BTC Gearing Up!BINANCE:BTCUSDT
BTC is in a falling wedge and at support.
Has 68% chance to breakout, however, overhead resistance from price structure and 4h 50MA (yellow MA). Break and hold, look to LONG.
If the white level is lost look to short but watch for a fake out.
The market doesn't have volume, let it provide direction and execute Plan A or Plan B.
If you liked this idea or if you have your own opinion about it, write in the comments.
The information and publications are not meant to be, and do not constitute, financial, investment, trading, or other types of advice or recommendations.

BTC - Nothing to see here... Move alongBTC still in that ascending broadening wedge we all know it's bearish right? Ain't that right? Right?

BTCUSDT next 1h candle has a higher probability to be a red oneNext 1h candle (UTC 01:00- 02:00) has a higher probability to be a red candle.

BTCUSDT current 1h candle has a higher probablity of being redThis current 1h candle (UTC 13:00 - 14:00) has a higher probability of being a red one.

BTC SHORT SET UP WYCKOFF EWUsing Wyckoff and EW this are the possible trend for btc in 1HR time frame U can also check my other TA For btc in higher timeframes

BTC BULL TRAPAt weekly chart we are in still in the 3rd wave correction
At the daily chart we reached the 5th wave in the correction with RSI divergence which adds confluence on the correction
A harmonic pattern sits on the OB
Volume is decreasing in green candles

BTCUSDT: Elliot Wave analysis 32677$Hello guys. We see at the chart "abc" wave . "A" is finished and start to "B" wave and continued to "C" wave at the 32677$
Now best position for B wave is Short position.

Btcusdt - a correction or another trick?If you like the idea, please "Like" it. This is the best "Thanks!" for the author 😊
P.S. Always do your own analysis before a trade. Put a stop loss. Fix profits in installments. Withdraw profits in fiat and please yourself and your
your friends.

Btcusdt forming Accumulation 1 next move on weekly tf
Btcusdt forming its Accumulation 1 s last phase 10k next Move
btcusdt will complete its remaing phase on weekly timeframe
spring area ll be our Bottom for next Bull Run...
upcoming Crash on Weekly Timeframe ..
dyor

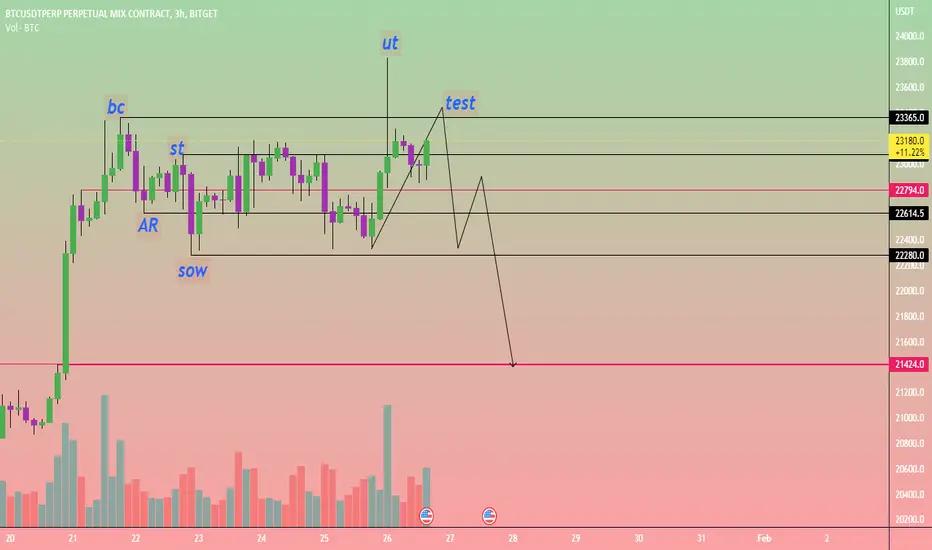
btcusdt distribution 2 on 3hours timeframe btcusdt is in last phase of it distribution so after test
btc ll bear soon ..
if it is distribution schematic 2 dump is ahead ,,....
Short Term Bitcoin longThe chart for $BTC is showing me many bull flags.
From the chart shown above, you can see a local breakout, Moving Average support is holding $BTC, and that RSI has lowered.
I have done much more analysis to back my long belief, special indicators of mine indicating it will go up among other fundamental and technical analysis.
Keep in mind $BTC is volatile these days so I advise being very careful and vigilant!
STOP LOSS: $22,180
TP1: $23,400
TP2: $23,600
TP3: $23,800
TP3: :$24,000
You may wonder, "Why have you not shared all your TA and other analysis?"
Well simply because the Fundamental side of it is quite long, and honestly I do not like showing all my TA tricks publicly on TradingView.
I also unfortunately cannot tell you where to go to see all my tips and tricks because TradingView will label it as self advertising lol.

Will BTCUSDT go Short? Watch out😱BTCUSDT is currently on the $22k market price. Using Chart pattern, it has shown a double top which could result to a corrective movement back to $21k market price before an impulsive move to $24k market price. Will BTCUSDT do accordingly to my analysis? Probably not.
Best we move with the trend📈📉

BTC/USDT :: Will the price be returned ?BTC/USDT :::
Will the price return to the support lines and rise again ?
Or without returning to the support lines, it continues its path towards the resistances !!!https://www.tradingview.com/chart/BTCUSDT/VSzFWqjy-BTC-USDT-We-are-not-going-to-trade-all-the-time
<<<< Analyze simply with The_Best_Trader_1991 >>>>

BTCUSDT Elliott Waves AnalysisHello friends.
Please support my work by clicking the LIKE button👍(If you liked). Also i will appreciate for ur activity. Thank you!
Everything on the chart. (update)
I expect that correction will start very soon.
Minimal target 20k, main target zone 19500-18500
Good luck everyone!
Follow me on TRADINGView, if you don't want to miss my next analysis or signals.
It's not financial advice.
Dont Forget, always make your own research before to trade my ideas!
Open to any questions and suggestions.

💥BTC testing lower levels💥Bitcoin analytical series S0E03!!!
Hello traders, First take a look at my previous analysis.
Don't forget to risk-free your positions.
Please share ideas and leave a comment,
Let me know what's your idea.
CrazyS✌

btcusdt Distribution on 1 hour Time frame Btcust before and after on 1 hour timeframe my Analysis yesterday Night
btcusdt Distribution on 1 hour Time frame perfectly going on my lines
Btcust before and after on 1 hour timeframe my Analysis yesterday Night
#BTC #BTCUSDT #Bitcoin #BNB #Binance #CZBinance #BinanceSmartChain

BTCUSDT SHORThello guys
BTCUSDT is in a major level of structure that push the market has pushed lower before on Tuesday September 12 2022. this is major level of and we have divergence on the 4 HR RSI , BUt even if we are in a major level we are against the strong trend which is up . I expect a little push to the down side of the market with small leverage. and small risk like 1% of my equity
stay strong and safe
happy trading
Risk only what you are willing to lose
be a trader not a gambler
make your own research before enter any trade.

BTCUSDT - 1D - SHORTBTC is going to be decreased before having a long moving up. I recommend to wait and buy spot instead of doing gamble by long/short.
All ideas are reflected to chart.

📉BTC 4H analysis: S01E02📈BINANCE:BTCUSDT
COINBASE:BTCUSD
Bitcoin analytical series S0E02!!!
Hello traders, First take a look at my previous analysis.
💥From now, until the price is inside the yellow area, you can open short position in two steps.
The optimum stop-loss is above the determined level.
Don't forget to risk-free your positions.
Please share ideas and leave a comment,
Let me know what's your idea.
CrazyS✌
