BTCUSD: Best Short Position to touch 18180$Hello to all . Considering that wave x is happening, for the three waves of wave a, which is exactly on the fibo line of 1.618 of the first wave, it is possible to expect correction up to the following two values, so according to the strata you have, you can have a good selling position on it. had be profitable
Btcusdtshort

I'm getting ready for a nice show BTCI expect to visit layers around 12k -> 11k, maybe even slightly lower in a panic and maybe we will stop somewhere on the trendline around 6700 =D so I hope I'm wrong as always

BTC/USDT :: Back to support lines .BTC/USDT :::
The price increase is temporary and will show its price drop in the next few days .
The expression of this idea has been proposed in relation to a previous idea, however, the price may try to enter the range of $35k, but the attraction of the bottom of the channel
It is very strong.

BTCUSDT Rounding BottomBitcoin is currently retesting an Important Point of control that has been formed over a year ago, short term 0.618 Fibonacci level, Parallel channel resistance.
Expecting to see another mouvement back to the lowside until the price of 12k which is a MONTHLY level of support.


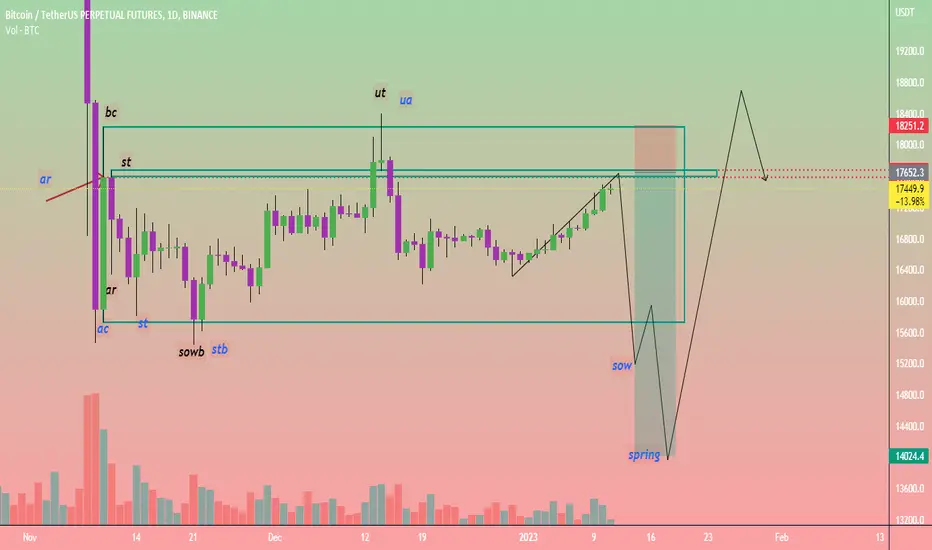
Btcusdt redistribution 2 and accumulation 2 situation is dump Btcusdt redistribution 2 and accumulation 2 situation is dump
if it is distribution 2 then we ll bearish to Sow area
if it is Accumulation 2 then we are bearish to spring area
any situation in my views big dump ahead
dyor
BTC channelBeen posting this in the updates of my previous idea, a reliable channel for the last couple weeks.
Perfect touch of the 0.382 fib and rejected down. Couldnt get a candle close outside of channel, shorts were entered with sl now in profit.
Mid range of channel should look for a bounce, if not there then the 0.236 and if not there the bottom of the channel.
I am however in time, expecting this to break to the downside.
Shorts will be closed near the region of the bottom of wedge posted previously at which point i will omega giga long.

BTC :: BTC movement trend in W time frame .BTC/USDT :::
In general, it has been moving below the middle line of the blue channel for some time, and the trend will change with its failure .
The price may come down a little, but it is very small compared to the growth it will have in the future .
<<< Good luck >>>

BTCUSDT Elliott Waves Analysis (Local Setup)Hello friends.
Please support my work by clicking the LIKE button👍(If you liked). Also i will appreciate for ur activity. Thank you!
Everything on the chart.
Im waiting for decline from current price or through one more upward movement in 17300 zone.
Entry: market and higher
Target: 15900 - 15400 - ~14800
after first target reached move ur stop in breakeven
Stop: ~18200 (depending of ur risk). ALWAYS follow ur RM .
RR: 1 to 2
risk is justified
Good luck everyone!
Follow me on TRADINGView, if you don't want to miss my next analysis or signals.
It's not financial advice.
Dont Forget, always make your own research before to trade my ideas!
Open to any questions and suggestions.

📉BTC 4H analysis: S01E01📈BINANCE:BTCUSDT
COINBASE:BTCUSD
Bitcoin analytical series starts today!!!
Hello traders, First take a look at my previous analysis.
💥From now, until the price is inside the yellow area, you can open short position in two steps.
The optimum stop-loss is above the determined level.
TP1-2-3-4-5-6 are on the chart

BTC/USDT :: We are not going to trade all the time !BTC/USDT :::
I suggest that currently the best option is to wait for the breaking of this triangular range .
<<< And its stabilization is also important >>>

BTC WEEKLY - 12.5K$ - 10K$BTC - WEEKLY - SHORT - SWING IDEA
This is my current zone where I would like to see BTC in the next few months. According to the cycle that is going on in BTC thanks to its halving, in my opinion and the prediction of my technical analysis of the price action, we could get in this zone in the currently ongoing bear market, accumulate considerable strength and create a new structure for the upcoming uptrend cycle
TRADING has its main rules of success but laid out clearly, we cannot trade what we would like to see but what we currently see. That's why I would like to slowly start accumulating mainly BTC and ETH together with you in the next few weeks to months
This market is extremely unpredictable, especially in the phase of the bear cycle, so I will reduce the risk by allocating the largest part of the capital to BTC, which statistically loses the least in a bear market.
Because I don't want to catch the complete or exact bottom. I will continuously send buying orders for approximately 5-10% of the portfolio for a longer period of time
We will definitely cover altcion trading in USDT. At the moment, buying smaller altcoins for a longer period of time seems to me mainly from the point of view of cyclicality, currently still very risky
At a later stage we will focus on Bitcoin dominance and watch ALTCOIN SEASONS.
These market phases will allow us to earn the most, move capital from BTC to smaller coins for high appreciation in a fairly short time
SEE YOU SOON

Bitcoin - Near Term🎯 using FibonacciHi Traders, Investors and Speculators 📈📉
Ev here. Been trading crypto since 2017 and later got into stocks. I have 3 board exams on financial markets and studied economics from a top tier university for a year. Daytime job - Math Teacher. 👩🏫
Happy New Year !🎉🎇
Whilst many are still in the festive mode, the price of Bitcoin is moving... to the lower side. From a chart analysis, the 0.7 Fibonacci Retracement was tested earlier in December, but as it turns out there wasn't a high demand zone on this support zone. Therefore, the price of BTC could continue to make lower high's until the demand zone is equally balanced with the supply zone, after which we anticipate a period of sideways trading.
By taking a quick look at the technical indicator Phoenix Ascending, we notice the EMA pointing lower sharply, indicating short term bearish momentum is stronger than buying pressure at this level.
This is only a short term analysis for my immediate expectations on the price of BTCUSDT for the coming days. Stay tuned on our channel 👀 because I'll be making a comprehensive outlook on what I expect for BTC during 2023.
_______________________
📢Follow us here on TradingView for daily updates and trade ideas on crypto , stocks and commodities 💎Hit like & Follow 👍
We thank you for your support !
CryptoCheck

2014-16 Bitcoin Bear Market VS 2021-232014-16 Bitcoin Bear Market VS 2021-23..?
A bear market refers to a declining market trend, characterized by falling prices for securities. In the context of Bitcoin, a bear market refers to a sustained period of declining Bitcoin prices.
There are a few different reasons why a bear market might occur in the Bitcoin market. One possible reason is a general loss of confidence in the asset, which can lead to a decrease in demand and a corresponding drop in price. Another reason might be the emergence of new, competing cryptocurrencies that investors perceive as being superior to Bitcoin, leading to a shift in demand away from Bitcoin.
Bear markets can also be influenced by external factors, such as regulatory changes or economic downturns. For example, if a government were to crack down on the use of Bitcoin or other cryptocurrencies, it could lead to a decrease in demand and a bear market.
It is difficult to predict exactly when a bear market will occur, as they are often the result of complex and multifaceted factors. However, it is worth noting that Bitcoin and other cryptocurrencies are highly volatile and have experienced several bear markets in the past.
If you like this analysis, smash the "like button" and leave a comment below to share your thoughts
or let me know what crypto you want to see!
Trading is a reflection of yourself. Learn more daily and be ready for every opportunity.
Have a nice trading!

#BTC is not looking good in the shorter time frame!Hi guys, This is CryptoMojo, One of the most active trading view authors and fastest-growing communities.
Consider following me for the latest updates and Long /Short calls on almost every exchange.
I post short mid and long-term trade setups too.
Let’s get to the chart!
I have tried my best to bring the best possible outcome to this chart, Do not consider financial advice.
#BTC UPDATE
BTC is making this bearish pennant pattern.
BTC doesn't look good, According to the pattern if BTC did a break down then BTC can drop 10% after the confirmed retest.
We have 16.5k and 15.5k as support
If BTC breaks out this upper resistance then the pattern will be invalidated.
Stay tuned I will keep updating
This chart is likely to help you make better trade decisions if it does consider upvoting it.
I would also love to know your charts and views in the comment section.
Thank you

BTC shortBTC Reject at the dynamic Support the start to goes downward.
it is possible to move like that.
But be careful about PPI

BTCUSD intraday trading & back to the home ⬇︎ 27 DEC 2022BTCUSD intraday trading alert
3 steps must fulfill before entry
1. 1st breakout done
2. Retracement done
3. 2nd breakout and see you in the home ⬇︎
More info in my profile..
Good luck traders..

#BTCUSDT - Thoughts out loud plus technical side. #BTCUSDT #BTC #USDT.
Good afternoon!
The idea of the possible development of the situation on Bitcoin and the direction of the cryptocurrency market in general.
For this period of time, the price continues to decline and there are no purchases by professional market participants on the chart.
If the buyers do not keep the price in the range of 15555 - 17777, we can expect further price decline, prospective prices The chart shows possible scenarios:1.2.
A.B.C. - Price levels from which we can see the resumption of acquisitions.
Against the background of the technical picture, the news background begins to slowly fill the information that one of the largest mining companies in the United States, Core Scientific, has filed for bankruptcy after the fall in cryptocurrency prices and rising energy prices. Core Scientific mines reliable cryptocurrencies such as bitcoin. The process involves connecting data centers across the country equipped with highly specialized computers that process mathematical equations to verify transactions and simultaneously create new tokens.
This process requires the use of expensive equipment, some technical know-how and a lot of electricity.
Core's market capitalization fell to $78 million as of the end of trading on Tuesday, down from a valuation of $4.3 billion in July 2021. Over the past year, the stock has fallen by more than 98%.
According to a source familiar with the situation in the company, the company is still generating positive cash flow, but this money is not enough to repay the financial debt for the equipment it leased.
The person added that the company will not be liquidated but will continue to operate as usual, reaching an agreement with senior securities holders who hold the bulk of the company's debt.
The company said in October that holders of its common stock could experience a "total loss of their investment" but that this may not happen if the industry recovers.
The company also said it would not pay debts in late October and early November and said creditors could sue the company for non-payment.
At Core, which primarily mints bitcoins, the token price has fallen from an all-time high of over $69,000 in November 2021 to around $16,800.
This loss of value, coupled with increased competition among miners and rising energy prices, has resulted in shrinking profits.
This is the first time in the history of the crypto industry that more than 25% of the total amount of bitcoins mined in 2022 falls on this company.


BTCUSD top-down analysisHello traders, this is a complete multiple timeframe analysis of this pair. We see could find significant trading opportunities as per analysis upon price action confirmation we may take this trade. Smash the like button if you find value in this analysis and drop a comment if you have any questions or let me know which pair to cover in my next analysis.

btcusdt wyckoff distribution on 3 Hours time framebtcusdt posible complete its distribution .if the move sow level thhen price ll bounce back for AR Retest LPSY ..
if it happend then i m sure we ll see 15k next price level
