BTCUSD intraday trading & back to the home ⬇︎ 19 DEC 2022BTCUSD intraday trading alert
3 steps must fulfill before entry
1. 1st breakout done
2. Retracement done
3. 2nd breakout and see you in the home ⬇︎
More info in my profile..
Good luck traders..
Btcusdtshort

BTCUSDT Potential Short 1:7RR-BTC is downtrend again on Daily and 4H timeframe.
-On 4H timeframe, The key level/ structural zone (16750) is also broken, then, price is now retesting it as a resistance
- On 1H timeframe, price has a potential double top which we can now enter for aggressive entry. But, if you are conservative and also want a higher probability entry you can wait for the support ( Black small line) to be broken.
TARGETS ; 16150 and 15850

BTC facing multiple resistancesBTC/USDT looking weak going into the weekend, I expect a drop to 16,200-16,500 and then a short bounce upwards while following the greater overall downtrend.

BTCUSDTI'M Using Multiple Tools And Multiple timeframes On BTCUSDT Perpetual contract 4h daily , Bearish Engulfing conformed at Daily chart and we wait 4 retest to our zone ( always note that the retest should quick not too late not too far )
I Couldn't see any sign of bullish move on long term based on Dow theory and i believe the descending momentum
use Price action , RTM , Fibonacci
THIS IS NOT A FINANCIAL ADVICE THIS IS JUST A ANALYSIS AND COULD BE WRONG ..! USE SL & MONEY MANAGEMENT

BTCUSDT Elliott Waves AnalysisHello friends.
Please support my work by clicking the LIKE button👍(If you liked). Also i will appreciate for ur activity. Thank you!
Everything on the chart.
We took all the targets in the previous idea, thus completing the formation of wave iv in the ending diagonal.
A decline began in our final wave v of (v) of (C) where the formation of the ending diagonal will be completed and after which I expect the trend to reverse to an upward one.
Locally, I expect a decline to the 16600-16200 zone, after which there will be a correction to our downward impulse, and a final decline to the 15200-13500 zone, after which I expect the beginning of a smooth growth.
Good luck everyone!
Follow me on TRADINGView, if you don't want to miss my next analysis or signals.
It's not financial advice.
Dont Forget, always make your own research before to trade my ideas!
Open to any questions and suggestions.

BTC LONGPrice might get to the support zone for bullish movement to the 18k zone, the is also imbalance at the spot left to fill before the bullish move

#BTC need to clear the 18,500 resistance to Confirm the pattern!Hi guys, This is CryptoMojo, One of the most active trading view authors and fastest-growing communities.
Consider following me for the latest updates and Long /Short calls on almost every exchange.
I post short mid and long-term trade setups too.
Let’s get to the chart!
I have tried my best to bring the best possible outcome to this chart, Do not consider financial advice.
#BTC UPDATE
BTC is forming this big falling wedge pattern
what is a falling wedge pattern?
The falling wedge is a bullish pattern. Together with the rising wedge formation, these two create a powerful pattern that signals a change in the trend direction. Generally, a falling wedge pattern is considered a reversal pattern, although there are examples when it facilitates a continuation of the same trend.
*BTC Need to Clear the 18,500 Resistance to Confirm the Falling Wedge Breakout
* RSI is also sowing some bullish divergences move
*If it conforms to this pattern then according to the pattern we will see a good bounce
Stay tuned I will keep updating
This chart is likely to help you make better trade decisions if it does consider upvoting it.
I would also love to know your charts and views in the comment section.
Thank you

BTCUSDT - Wyckoff Method Bottom FinderHi Traders, Investors and Speculators 📈📉
Ev here. Been trading crypto since 2017 and later got into stocks. I have 3 board exams on financial markets and studied economics from a top tier university for a year. Daytime job - Math Teacher. 👩🏫
A quick look at BTCUSDT from a macro perspective. It seems likely that Bitcoin needs to find a lower bottom where the demand zone is strong enough to stabilize the price. Currently, the volatility in the market may seem like it's bullish, but if you zoom out you can clearly see lower highs which is a benchmark for a bearish cycle. The price action is currently trading in the distribution phase of the Wyckoff Method market cycles, and we still need to establish a clear bottom followed by a period of sideways/range trading.
This was an earlier proposed bottom for BTC by using the Wyckoff Method:
Although my timelines were off, we can clearly see that the price action has not yet entered the final phase of the cycle and is still in a downtrend.
Remember, there are lots of other great opportunities in the markets during December that could make for a better trade setup as opposed to BTC.
Interested in stock markets? Check out this idea on SPX where I cover Apple Inc. , MSFT and AMZN :
_______________________
📢Follow us here on TradingView for daily updates and trade ideas on crypto , stocks and commodities 💎Hit like & Follow 👍
We thank you for your support !
CryptoCheck

BTCUSDT neutral biasOn Weekly, Price is in downtrend
On 4H and Daily , Price is currently in Uptrend
Potential Buy setup - Wait for the price to pullback into previous higher high ($17381) and FIB 50% in 4H timeframe and look for entry pattern (1H/30M/4H Engulfing or Strong rejections) . If the entry pattern don't show up, Don't force it
BUY SETUP Take Profits - $18000, and $18400
Potential Sell Setup - Wait for the price to go to $18400 and look for entry pattern (Strictly 4H Engulfing or strong rejection or even lower time frame downtrend).
SELL SETUP Take Profit - $15800

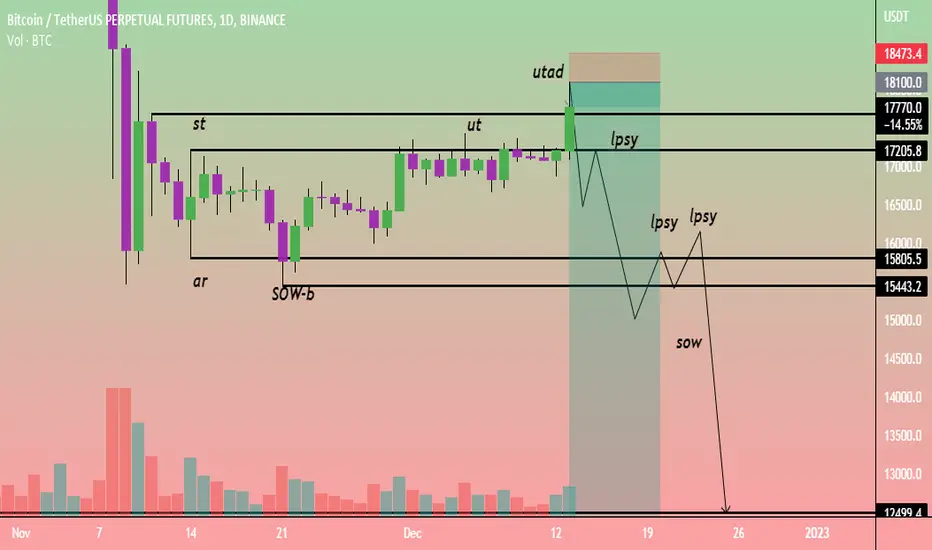
btcusdt dayly timeframe bearish wyckoff distribution foundbtcusdt dayly timeframe bearish wyckoff distribution found
dyor
learning purpose
📉💥BTC Short-term Short Position💥📈BINANCE:BTCUSDT
COINBASE:BTCUSD
First take a look at my previous analysis and positions.
💥Channel break pattern💥
While price is inside the yellow area, you can open short position in two steps.
If the price falls and reaches the TP1, you can risk-free the position.
TP1-2-3-4-5-6-7 are on the chart.
The optimum stop-loss1-2 are on the determined area.
Please share ideas and leave a comment,
let me know what's your idea.
CrazyS✌

Im expecting a black swan event - Swing shortAAAAAAAAAAAAAAAAAAAAAAAAAAAAAAAAAAAAAAAAAAAAAAAAAAAAAAAAAAAAAAAAAAAAAAAAAAAAAAAAAAAAAAAAAAAAAAAAAAAAAAAAAAAAAAAAAAAAAAAAAAAAAAAAAAAAAAAAAAA send help bls dont go to my liquidation price.

BTC/USDTHey everyone, this is my analysis for BTC there's huge liquidity below this trend line I shared each and everything in the chart its price goes up from the D leg, so don't panic that will be just a liquidity wick and make trend lines just for that.
Good luck everyone.
#Bitcoinanalysis #btc

BTC ShortWe have a large liquidity pool below 16650, FVG+. On 1H Chart we have bearish divergence and decreasing volumes

BTCUSDT 📈 Flash-Crash or Slow-Bleed ?Hi Traders, Investors and Speculators 📈📉
Ev here. Been trading crypto since 2017 and later got into stocks. I have 3 board exams on financial markets and studied economics from a top tier university for a year. Daytime job - Math Teacher. 👩🏫
We're looking at a grim situation on the BTCUSDT chart; the next local support zone / demand zone is anticipated only around $11500 . This is confirmed by a bearish technical indicator Phoenix Ascending, where the red RSI is around 20 and the grey momentum points towards bears being in control. Now the question remains, is it going to be a flash crash down or a long, cold crypto winter with a slow bleed down to $11K?
Since you're here! Here are a couple of bullish reversal patterns to look for:
_______________________
📢Follow us here on TradingView for daily updates and trade ideas on crypto , stocks and commodities 💎Hit like & Follow 👍
We thank you for your support !
CryptoCheck

Strong Sell Opportunity in 4 Hours Chart for BitcoinSince the 200 SMA is respected and the trendline I drew is broken, I take a loss from my position in my recent idea (see the link to related ideas). I lose a little compared to what I will gain this day.
This is very bearish and we might get a big dump later this day.
The DMI indicates that:
1. -DI is going above 30 level and it is above the ADX and +DI so this is very bearish.
2. As long as the -DI is above the ADX, I will hold my short position.

Bitcoin rising wedgeHi traders this is my current view of btc, bitcoin was going up for 2 weeks and forming rising wedge pattern.
The latest swing downwards occurs with increasing volume and momentum divergence.
The green line 17841 & 16373 is weekly range of bitcoin options contract with weekly maturity date.
Resistance : 17200 ; 17577 ; 17841
Support : 16805 ; 16635 ; 16373

BTCUSDT H1 analysis with Elliott wavesWell, A wave was completed.
We can have a corrective wave that is a function of A-B-C waves and then goes for an attractive 16500

#BITCOIN CRASH IT ABOUT THAT TIME BINANCE:BTCUSDT
Hello everyone bitcoin is about to make another scary move again (11k or 10k range),
I'm not always happy to see bitcoin falling but what do we do?
Yet every fall Is always an opportunity for those who understand. so let go to the main discussion where I'll be expecting the next stop of #BITCOIN price movement.
no long story if you have been following my previous BTC IDEAS if you haven't watched my previous bitcoin ideas go and do so now to understand my price tags and movements.
so, my next stop where I'll be expecting bitcoin is at price ($11,620.45 ---- 10,086.26) at this range do not expect bitcoin to go lower meanwhile this could possibly be the golden button ever!!!!

20 reason for sell BTC 🔆MULTI-TIME FRAME TOP-DOWN ANALYSIS OVERVIEW☀️
1 ✨Eagle eye: Near to bottom, last impulse move is ready
2 📆Monthly: extreme support level is coming from 13500 to 12000. Overall area trend is bearish
3 📅Weekly: bear
4 🕛Daily: Rounding Pattern /need to correct Structure Imbalances level
😇7 Dimension analysis
🟢 analysis time frame: Daily
5: 1 Price Structure: Bear
6: 2 Pattern Candle Chart: resistance at mid-band
7: 3 Volume: low volume at correction
8: 4 Momentum UNCONVENTIONAL Rsi: sideways between 40 to 60
9: 5 Volatility measure Bollinger bands: resistance at mid-band or 20 moving average
10: 6 Strength ADX: bearish farming a retracement curve bears are strong
11: 7 Sentiment ROC:
✔️ Entry Time Frame: H4
12: Entry TF Structure: bullish till level
13: entry move: we will enter at a bearish move
14: Support resistance base: daily resistance
15: FIB: waiting for a trigger
☑️ final comments: wait till full correction
16: 💡decision: sell at resistance
17: 🚀Entry: 17900
18: ✋Stop losel:18750
19: 🎯Take profit: 13500
20: 😊Risk to reward Ratio: 1:8
🕛 Excepted Duration:30 days

BTCAccording to the head and shoulder pattern of his photo in the 4-hour time frame. Expect a pullback to the neck line of the head and shoulder pattern

BTCUSD top-down analysisHello traders, this is a complete multiple timeframe analysis of this pair. We see could find significant trading opportunities as per analysis upon price action confirmation we may take this trade. Smash the like button if you find value in this analysis and drop a comment if you have any questions or let me know which pair to cover in my next analysis.

BTCUSDT ShortThe price is currently forming a ranging pattern.
I anticipate that the bearish momentum is still building up, and the price will break out forming a bearish pattern.
My entry price is 17000, with Targets at 16500, 16000, 15500 and 15000.
My stop loss is at 17500 and target R:R is 1:4
Remember, risk only 1-2 % of your account.
