Btcusdtshort

#BTC UPDATE Hi guys, This is CryptoMojo, One of the most active trading view authors and fastest-growing communities.
Consider following me for the latest updates and Long /Short calls on almost every exchange.
I post short mid and long-term trade setups too.
Let’s get to the chart!
I have tried my best to bring the best possible outcome to this chart, Do not consider financial advice.
#BTC UPDATE
BTC break down this descending triangle pattern
What is a descending triangle pattern?
The classic version of this pattern forms a trend line that is sloping and a flat or horizontal support line. The pattern emerges as the price bounces off the support level at least twice. The completion of the pattern occurs after the end of a retracement in a downtrend.
The downside breakout from the support triggers a strong bearish momentum-led decline.
However, this textbook pattern seldom occurs in real markets. In most cases, a descending triangle pattern can also see a sloping base as well. Instead of a flat support level, you can see higher lows being formed.
The illustration below shows what an “ideal” descending triangle pattern looks like, which is often labelled a descending wedge, as well.
In my last update, I mention the 17.5k horizontal support, after that post, BTC Bounced from that support
Currently, it breakout the descending triangle with a successful retest and heads toward the horizontal resistance which is around 17k.
A solid breakout of $17k would be the confirmation of the continuation of bullish momentum in the market, while a rejection will result in further range play.
Stay tuned I will keep updating.
This chart is likely to help you make better trade decisions if it does consider upvoting it.
I would also love to know your charts and views in the comment section.
Thank you

#BTC/USDT Trade Setup 1:5, Target $18,400 !! Welcome to this quick trade setup.
BTC has been under accumulation for the last few weeks.
Every drop has been bought.
A lot of FUD and uncertainty make me more bullish in the short term.
This drop below $16k could end up being a trap.
I opened a long on BTC around $16160 and will add more till $15850 with SL below $15400.
Most of the bad news has been sold.
I could be wrong only if we break the recent low.
Am not saying we can't see more drop in the next few weeks/ months but it's riskier to be out of BTC when it's down 73%.
This trade is based not just on charts but logic and reasoning.
This is not financial advice.
DYOR, My stop loss is for leverage long only.
I have been accumulating BTC since it broke $18k and I am more than happy to buy more.
Currently, I am 75% in BTC and a few alts & 25% FIAT and Stable Coins.
I will be posting more trade setups shortly.
Follow me if you don't yet.
Please hit the like button if you like it and share your views in the comment section.
Thank you
#PEACE

BTCUSDT TO 19200 ....downHello
in this position is a good signal from enter the sell order ... to :
TP : 19250
TP : 19200
TP : 19000
GOOd luck
FOLOW ME PLEASE ...THANKS

BTC on its way to $13'000 support level as forecastedthose who have read my previous BTC posts will know a couple of weeks ago i said the short run isnt over yet as it hasnt yet hit its 72-78% pull back, contrary to what many believed the bottom was in, but at around $13'000 is the major support level and BTC will have reached its pull back maximum, thus likely will rally long hard once in this zone, if your investing in BTC, either wait, or do staggered buys on BTC from today, but expect the price to continue to fall in the short term ( 2-3 weeks or so).

BTC to 4k?Remember this is only theory based on Elliot Wave theory. If we look closely RSI making huge divergence on 1W timeframe. If BTC could go up and get rejection around 30-35 area it is much more possible to happen. So time will tell.

bitcoin is broken weekly and monthly dynamic support
as I see fundamental and technical are in dangerous situration
I am trying to warn everyone, bitcoin is broken weekly and monthly dynamic support, as you can see we are closing the candle below dynamic and it can fall more and more. next week's market can be on blood.
use stop loss on your positions.
#BTC Short Entry: 16170
SL: 17000
TP 1: 14700
TP 2: 13700
TP 2: 12700
Will we see the #bitcoin bottom by Friday 25th November 2022 ??
NFA

#BTC exclusive long term update: must read!Hi guys, This is CryptoMojo, One of the most active trading view authors and fastest-growing communities.
Consider following me for the latest updates and Long /Short calls on almost every exchange.
I post short mid and long-term trade setups too.
Let’s get to the chart!
I have tried my best to bring the best possible outcome to this chart, Do not consider financial advice.
#Bitcoin Long Term Technical Analysis:-
In this weekly time frame, BTC is trading inside this expanding triangle pattern and is currently at the lower level of this pattern.
Which is at 1428D long Strong support also BTC must hold this level. If BTC breaks down to this level then $11k to $12k is the next stopping point.
I am accumulating BTC in this range and what if BTC drop towards 11k to 12k then I will buy more, no one can catch the accurate bottom.
TARGET:- 73k, 90k, 120k,
This is not a piece of financial advice.
(DYOR)
This chart is likely to help you make better trade decisions if it does consider upvoting it.
I would also love to know your charts and views in the comment section.
Thank you

BTCUSDT update on 1H frame BITCOIN breock 1H frame time supportline and retested ,If he continues on this approach, he can be targeted 16441$

BTC SHORT - BEARISH PENNANT !BYBIT:BTCUSDT.P
BTC 4H sitting in bearish pennant with 50MA as dynamic resistance.
Measured move of breakdown to 14,000 and 12,000 levels.
Enter the break down and/or bearish retest via lower time frame entries.
If you liked this idea or if you have your own opinion about it, write in the comments.
The information and publications are not meant to be, and do not constitute, financial, investment, trading, or other types of advice or recommendations.


Btc might goes down to 12000$!I think it is strongly possible for BTCUSDT goes down to 12000$ in less than a month, or before 2022 ends.
So I prefer my friends to start planning on SHORT POSITIONS in the following 30-45 days.
You can check the 1d chart and 4h chart for more information.
Based on volume, we expect more Tethers to exit from BTC market in the following 30-45 days, because of technical analysis and because of end of Coronavirus and people plans for holidays.
Stay safe and tuned!

BTCUSDT2 options for entry ,waiting for CHoCH on 5-15m tf and open long or short, follow the risk management and don't forget to put stop loss

BTC Weakening on the weekly chart probably heading to 11831 USDCan't say much more other than the Fundamental analysis met in such a perfect timing with the Technical.

Anything above 21700 is a short selling opportunity, IMO.We ball and that is it.
If we print another lower high on the weekly chart, I'll go short.

BTCUSDT: Elliot Wave Price Action 15MHello friends. After the failure of Bitcoin and according to the previous analysis that correctly showed the movement, it is expected to continue its downward trend and in the time of 15 minutes such a movement can be imagined for Bitcoin. I hope you are successful and victorious.

Bitcoin Prediction H1Here is my view for BTCUSD on H1. The price could go down, you can put a pending order on the Order block or find an entry on LTF within OB Zone. Trade Safe!

BTC Bear Flag confirmation! 🪙BTC just confirmed its bear flag pattern! wait for a retest and prepare for a short!
Entry : 19800,
Stop Loss : 21400
TP 1 : 17200,
TP 2 : 16100,
TP 3 : 14500.

BTCVery simple ... Very clear!
Everything is marked on the chart.
This is my personal opinion. Please do not trade based on my analysis and data.

Nightmare BTC ScenarioThis is the worst case scenario for BTC, a giant macro head and shoulders. The best case scenario is that we bounce at the macro GP around 9-10k. Based on the S&P fractal (the one from the 2008 crash that perfectly fits our current price action) I have to assume the worst for the crypto market. I was just waiting to see what the "news" would be that triggered the huge crash, and we just got it with FTX. That's our "black swan event" - buckle up everybody. Short everything for financial freedom, and don't forget to put your hands up and yell "weeee!" all the way down. Also make sure to withdraw profits on the way so the exchange isn't insolvent by the time we get there lol

Stop the short positions-Long btc to 18500 Simple as always
Its very clear that we will have a retest to 18500 zone before the biggest drop of BtC
Tp1: 18500
Tp2: 14K
Tp3 :12
Tp3 : any thing less than 10K

#BTC UPDATE Hi guys, This is CryptoMojo, One of the most active trading view authors and fastest-growing communities.
Consider following me for the latest updates and Long /Short calls on almost every exchange.
I post short mid and long-term trade setups too.
Let’s get to the chart!
I have tried my best to bring the best possible outcome to this chart, Do not consider financial advice.
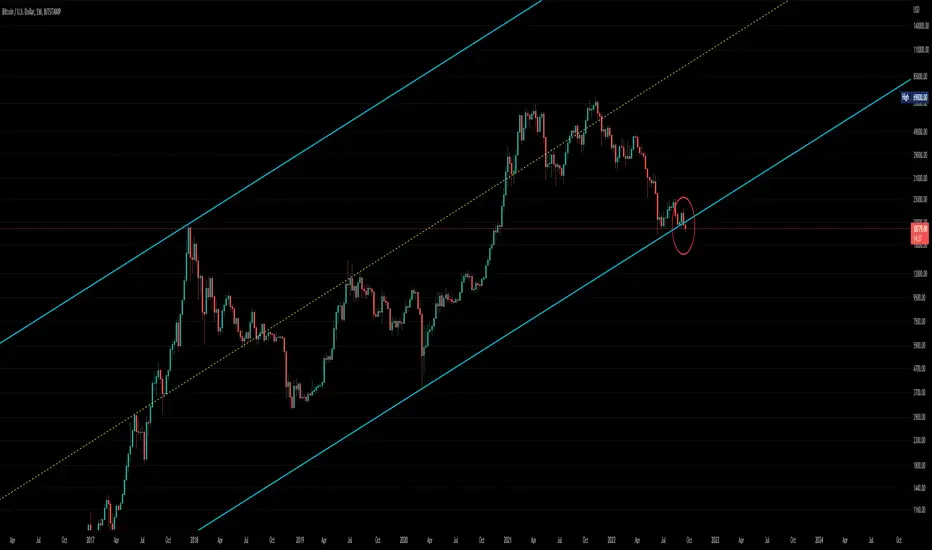
#BTC Update
BTC is trading inside this ascending channel pattern and is currently at the lower support of this channel we also have 50 MA and 19.6k as local support.
if BTC hold this support then we can see some bounce
but in case BTC breaks down this channel then we will drop towards the next support which is the 18k level.
This chart is likely to help you make better trade decisions if it does consider upvoting it.
I would also love to know your charts and views in the comment section.
Thank you
