Gold's Slide Powers BTC Past 100K: Time to Short at Highs🚀 BTC Explodes Past the 100,000 Milestone!
Today, BTC shattered the highly anticipated 100,000 mark, sending shockwaves through the crypto market. But this remarkable rally came at a steep cost—💥 many traders faced liquidations, wiping out their accounts as the price volatility reached a fever pitch.
💎 The Gold - Crypto Connection
Interestingly, as gold continues its noticeable downward slide 📉, virtual currencies are stepping in as an alternative haven. The influx of capital seeking new opportunities has fueled the upward trajectory of cryptos, firmly establishing their bullish momentum.
📈 What’s Next?
With the 100,000 resistance now decisively breached, BTC is poised to climb even higher, riding the wave of its recent triumph 🌊. But savvy traders are eyeing a strategic play: once the price hits a peak, it could be prime time to short at the highs ⏳—a move that balances the allure of profit with the inherent risks of a volatile market.
⚡⚡⚡ BTCUSD ⚡⚡⚡
🚀 Sell@101000
🚀 TP 98000 - 97000
Accurate signals are updated every day 📈 If you encounter any problems during trading, these signals can serve as your reliable guide 🧭 Feel free to refer to them! I sincerely hope they'll be of great help to you 🌟
Btcusdtshort

BTC/USD:range tradingBTC/USD is currently fluctuating within the range of $96,000 to $98,000. We can adopt the strategy of selling high and buying low.Until it breaks through this range.
BTC/USD
sell@98000-97500
tp:96000-95500
buy@95000-95500
tp:97000-97500
I am committed to sharing trading signals every day. Among them, real-time signals will be flexibly pushed according to market dynamics. All the signals sent out last week accurately matched the market trends, helping numerous traders achieve substantial profits. Regardless of your previous investment performance, I believe that with the support of my professional strategies and timely signals, I will surely be able to assist you in breaking through investment bottlenecks and achieving new breakthroughs in the trading field.

BTC/USD:range tradingAfter multiple probes over the course of two days, BTC/USD once again challenged the threshold of $95,000 and successfully achieved a breakthrough. Currently, its price fluctuates within the range of $95,000 to $98,000. Within this range, investors can adopt a trading strategy of selling high and buying low. Once a new breakthrough occurs, they can flexibly adjust their trading strategies according to the direction of the breakthrough.
BTC/USD
sell@98000-97500
tp:96000-95500
buy@95000-95500
tp:97000-97500
I am committed to sharing trading signals every day. Among them, real-time signals will be flexibly pushed according to market dynamics. All the signals sent out last week accurately matched the market trends, helping numerous traders achieve substantial profits. Regardless of your previous investment performance, I believe that with the support of my professional strategies and timely signals, I will surely be able to assist you in breaking through investment bottlenecks and achieving new breakthroughs in the trading field.

btcusd sell signal. Don't forget about stop-loss.
Write in the comments all your questions and instruments analysis of which you want to see.
Friends, push the like button, write a comment, and share with your mates - that would be the best THANK YOU.
P.S. I personally will open entry if the price will show it according to my strategy.
Always make your analysis before a trade

BTCUSD short-term view.It is a good opportunity to sell BTCUSD in real time. Short-term is based on the right side of the swing trading, with a target of 93000-92500. In addition, the uncertainty of the news on BTCUSD. It is a good time to sell now.

BTCUSD: Break of Key Level in the Early Trading SessionDuring the early trading session, BTCUSD continued its weak trend. After the price broke below the key support level of $95,000, it kept declining. This price level quickly transformed into a resistance after being breached, suppressing any potential rebound. Currently, the bearish momentum is dominant, and the short-term market sentiment has turned cautious. If it fails to regain the lost ground of $95,000 in the future, the price is likely to decline further, and the next target will be the important support area of $93,000.
BTCUSD
sell@94500-95000
tp:93500-93000
I am committed to sharing trading signals every day. Among them, real-time signals will be flexibly pushed according to market dynamics. All the signals sent out last week accurately matched the market trends, helping numerous traders achieve substantial profits. Regardless of your previous investment performance, I believe that with the support of my professional strategies and timely signals, I will surely be able to assist you in breaking through investment bottlenecks and achieving new breakthroughs in the trading field.

BTCUSD: Gathering Momentum for a BreakthroughThe price of BTCUSD strongly broke through the threshold of $97,000 this week, showing a robust upward momentum. Although there has been a pullback currently, it still remains in a strong uptrend above $95,000 overall. In the short term, the primary target for the upward movement is $98,000. If this level is broken through, the focus will shift to the significant psychological level of $100,000. However, when the price of BTCUSD approaches the level of $98,000, this area will form a resistance, and investors should be cautious about the potential risk of a pullback. If it unexpectedly breaks below the support level of $93,000, it may pull back to the area around $89,000.
Taking all factors into consideration, the overall trend of BTCUSD next week is relatively optimistic, with a high probability of continuing to break through upwards. However, the risk of a pullback should also be watched out for. There are uncertainties in the market, and macroeconomic factors such as the progress of negotiations between the United States and its major trading partners may also have an impact on the price of Bitcoin. Therefore, relevant news should be closely monitored.
I am committed to sharing trading signals every day. Among them, real-time signals will be flexibly pushed according to market dynamics. All the signals sent out last week accurately matched the market trends, helping numerous traders achieve substantial profits. Regardless of your previous investment performance, I believe that with the support of my professional strategies and timely signals, I will surely be able to assist you in breaking through investment bottlenecks and achieving new breakthroughs in the trading field.

BTCUSDT Take ProfitThe BTCUSDT trade I shared a few hours ago closed in profit. Those who wanted could have set the TP at a 1:2 Risk-to-Reward Ratio as well. I entered the trade with a sniper entry. 🎯📈

BTCUSDTWishing everyone a great weekend! I opened a BTCUSDT trade this morning and hit TP — price has now returned to the same level (I didn’t share that signal with you). I'm considering taking another trade. Although BTC tends to act “blind” during weekends, I still want to seize the opportunity. For that reason, it's better to enter with a smaller lot size. I may close this trade manually — so turn on notifications to stay updated 🙂
🔍 Criteria:
✔️ Timeframe: 15M
✔️ Risk-to-Reward Ratio: 1:2
✔️ Trade Direction: Sell
✔️ Entry Price: 96428.33
✔️ Take Profit: 95978.61
✔️ Stop Loss: 96728.22
🔔 Disclaimer: This is not financial advice. It's a trade I’m taking based on my own system, shared purely for educational purposes.
📌 If you're also interested in systematic and data-driven trading strategies:
💡 Don’t forget to follow the page and subscribe to stay updated on future analyses.

BTCUSDT Wishing everyone a great weekend! I'm considering opening a BTCUSDT trade. Although BTC tends to act “blind” over the weekend, I still plan to take advantage of the opportunity.**
🔍 Criteria:
✔️ Timeframe: 15M
✔️ Risk-to-Reward Ratio: 1:2
✔️ Trade Direction: Sell
✔️ Entry Price: 96061.32
✔️ Take Profit: 95810.45
✔️ Stop Loss: 96187.06
🔔 Disclaimer: This is not financial advice. It's a trade I’m taking based on my own system, shared purely for educational purposes.
📌 If you're also interested in systematic and data-driven trading strategies:
💡 Don’t forget to follow the page and subscribe to stay updated on future analyses.

The decisive day of major data (BTCUSD)Yesterday, it was mentioned that the expectation of continuing to buy after a retracement of 96k was completely correct. Followers also made good profits.
BTCUSD bulls are still strong. The retracement is mainly long trading, which needs to be paid attention to at present. 96k/95k are both good buying opportunities.
TP98K-100K

Can BTCUSD continue to be purchased? The answer is definitely.Can BTCUSD continue to be purchased? The answer is definitely.
The current trend is a rebound trend after a volatile decline. The space for a short-term increase of 1,500 points is very simple. The target position is 94,700-95,200. Friends who like to do short-term swing trading can follow.

Buy@9500096000: This represents the resistance level adjacent to the upper trend-line of the current ascending wedge. The price has repeatedly probed this zone but hasn't managed to achieve a decisive breakthrough, underscoring significant selling pressure at this crucial juncture 💥.
97500: It stands as a more elevated resistance milestone. Should the price powerfully breach the 96000 resistance barrier and sustain its upward momentum, it could potentially challenge this level 🎯.
⚡⚡⚡ BTCUSD ⚡⚡⚡
🚀 Buy@95000
🚀 TP 96000 - 97000
Accurate signals are updated every day 📈 If you encounter any problems during trading, these signals can serve as your reliable guide 🧭 Feel free to refer to them! I sincerely hope they'll be of great help to you 🌟

BTCUSD:Adopt range trading before the breakout.Given that a number of important data are about to be released intensively, the market volatility is rising sharply. Before a clear breakout signal in the price is formed, it is recommended that within the range of $93,000 - $96,000, the range trading strategy be flexibly applied: sell at highs, and then buy at lows to build positions when the price drops back to the support level, so as to seize the band trading opportunities in the volatile market. At the same time, strictly control the position size to prevent the risk of sudden and significant fluctuations triggered by the data release.
BTCUSD
buy@93000-93500
tp:95000-95500
sell@96000-95500
tp:94000-93500
In the future, we will continue to monitor the market changes and update the trading strategies in real time.
I am committed to sharing trading signals every day. Among them, real-time signals will be flexibly pushed according to market dynamics. All the signals sent out last week accurately matched the market trends, helping numerous traders achieve substantial profits. Regardless of your previous investment performance, I believe that with the support of my professional strategies and timely signals, I will surely be able to assist you in breaking through investment bottlenecks and achieving new breakthroughs in the trading field.

BTCUSD:Adopt range trading before the breakout.Given that a number of important data are about to be released intensively, the market volatility is rising sharply. Before a clear breakout signal in the price is formed, it is recommended that within the range of $93,000 - $96,000, the range trading strategy be flexibly applied: sell at highs, and then buy at lows to build positions when the price drops back to the support level, so as to seize the band trading opportunities in the volatile market. At the same time, strictly control the position size to prevent the risk of sudden and significant fluctuations triggered by the data release.
In the future, we will continue to monitor the market changes and update the trading strategies in real time.
I am committed to sharing trading signals every day. Among them, real-time signals will be flexibly pushed according to market dynamics. All the signals sent out last week accurately matched the market trends, helping numerous traders achieve substantial profits. Regardless of your previous investment performance, I believe that with the support of my professional strategies and timely signals, I will surely be able to assist you in breaking through investment bottlenecks and achieving new breakthroughs in the trading field.

BTCUSD:Wait for a breakthroughToday, the price of BTC strongly broke through the threshold of $93,000. Subsequently, it started a rebound trend. After consolidating near $95,500, it failed to further break through the resistance level of $96,000 and dropped back to around $94,000. It may fall again and break below the support level of $93,000.
The breakthrough of these two key price levels will serve as an important dividing line for the subsequent trend of BTC, indicating the direction of its future price movement.
Special Reminder: A number of important economic data will be intensively released this week, and market volatility is likely to increase significantly. It is recommended that everyone trade with caution and strictly control risks.
I am committed to sharing trading signals every day. Among them, real-time signals will be flexibly pushed according to market dynamics. All the signals sent out last week accurately matched the market trends, helping numerous traders achieve substantial profits. Regardless of your previous investment performance, I believe that with the support of my professional strategies and timely signals, I will surely be able to assist you in breaking through investment bottlenecks and achieving new breakthroughs in the trading field.

BTCUSD:Ascending Wedge Trend and StrategiesI. Trends and Patterns
From the 4 - hour chart, BTCUSD has shown complex volatility characteristics recently:
1.Consolidation phase: The price oscillated within a narrow range in the early stage, forming a rectangular consolidation pattern. The forces of bulls and bears were relatively balanced, and there was a strong wait - and - see sentiment in the market.
2.Breakout and current pattern: After breaking through the consolidation range, the price moved upward, indicating that the bulls were dominant in the short term. However, it has now entered an ascending wedge pattern - which is a common reversal signal in technical analysis.
- Pattern characteristics: Although the price has been making short - term new highs, the upward slope has gradually flattened, suggesting that the bullish momentum is fading and the bearish momentum is gradually accumulating. Be vigilant against the risk of trend reversal.
II. Key Support and Resistance Levels
S1: $93,000. It is near the lower trend line of the ascending wedge and also a previous pullback low. If the price drops, this could form a strong support. If it is broken, it may open up a downward space, and we need to be vigilant against trend reversal.
S2: $91,500. It is the upper edge of the previous consolidation range. If the price drops significantly, this may form a secondary support to slow down the decline.
R1: $96,000. It is near the upper trend line of the ascending wedge. The price has tested it several times without a valid breakthrough, indicating strong selling pressure here and a significant short - term suppression effect.
R2: $98,000. It is a higher - level resistance target. If the price breaks through $96,000 strongly and holds above it, it may further rise to this level.
III. Trading Strategy Recommendations
1.Bullish strategy:
- Entry conditions: The price finds support near $93,000 (such as the appearance of bullish candlestick patterns like hammer candlesticks), and does not break below this level.
- Target price: $96,000 (testing the upper wedge), and if broken, look towards $97,500.
- Stop - loss setting: Break below $92,500 (below the lower edge of the support level).
2.Bearish strategy:
- Entry conditions: The price effectively breaks below the support level of $93,000 (such as closing below it for two consecutive candlesticks), or encounters resistance and falls back near $96,000 (the appearance of bearish patterns like shooting star candlesticks).
- Target price: $91,500 (the upper edge of the previous consolidation), and if it further drops, it can look towards $86,000.
- Stop - loss setting: Break above $96,500 (above the upper wedge).
3.Risk warnings:
- The reversal signal of the ascending wedge needs to be verified with trading volume (for example, if there is a significant increase in volume during the breakout, the signal is more reliable).
- Pay close attention to fundamental factors such as the expected Fed policy and regulatory dynamics of cryptocurrencies. Be vigilant against breakout movements triggered by unexpected news.
IV. Conclusion
Currently, BTCUSD is in a critical observation period of the ascending wedge. Technical analysis shows that the bullish momentum is waning, and it faces a directional choice in the short term. Aggressive traders can lightly test the waters near support/resistance levels, while conservative traders are advised to wait for clear breakout signals (such as a volume - based breakout of the upper wedge or an effective breakdown of the lower wedge) before entering the market. At the same time, strictly control positions and stop - losses to avoid volatility risks before the pattern is confirmed.

BTCUSD:Ascending Wedge Trend and StrategiesI. Trends and Patterns
From the 4 - hour chart, BTCUSD has shown complex volatility characteristics recently:
1.Consolidation phase: The price oscillated within a narrow range in the early stage, forming a rectangular consolidation pattern. The forces of bulls and bears were relatively balanced, and there was a strong wait - and - see sentiment in the market.
2.Breakout and current pattern: After breaking through the consolidation range, the price moved upward, indicating that the bulls were dominant in the short term. However, it has now entered an ascending wedge pattern - which is a common reversal signal in technical analysis.
- Pattern characteristics: Although the price has been making short - term new highs, the upward slope has gradually flattened, suggesting that the bullish momentum is fading and the bearish momentum is gradually accumulating. Be vigilant against the risk of trend reversal.
II. Key Support and Resistance Levels
S1 : $93,000. It is near the lower trend line of the ascending wedge and also a previous pullback low. If the price drops, this could form a strong support. If it is broken, it may open up a downward space, and we need to be vigilant against trend reversal.
S2 : $91,500. It is the upper edge of the previous consolidation range. If the price drops significantly, this may form a secondary support to slow down the decline.
R1 : $96,000. It is near the upper trend line of the ascending wedge. The price has tested it several times without a valid breakthrough, indicating strong selling pressure here and a significant short - term suppression effect.
R2 : $98,000. It is a higher - level resistance target. If the price breaks through $96,000 strongly and holds above it, it may further rise to this level.
III. Trading Strategy Recommendations
1.Bullish strategy:
- Entry conditions: The price finds support near $93,000 (such as the appearance of bullish candlestick patterns like hammer candlesticks), and does not break below this level.
- Target price: $96,000 (testing the upper wedge), and if broken, look towards $97,500.
- Stop - loss setting: Break below $92,500 (below the lower edge of the support level).
2.Bearish strategy:
- Entry conditions: The price effectively breaks below the support level of $93,000 (such as closing below it for two consecutive candlesticks), or encounters resistance and falls back near $96,000 (the appearance of bearish patterns like shooting star candlesticks).
- Target price: $91,500 (the upper edge of the previous consolidation), and if it further drops, it can look towards $86,000.
- Stop - loss setting: Break above $96,500 (above the upper wedge).
3.Risk warnings:
- The reversal signal of the ascending wedge needs to be verified with trading volume (for example, if there is a significant increase in volume during the breakout, the signal is more reliable).
- Pay close attention to fundamental factors such as the expected Fed policy and regulatory dynamics of cryptocurrencies. Be vigilant against breakout movements triggered by unexpected news.
IV. Conclusion
Currently, BTCUSD is in a critical observation period of the ascending wedge. Technical analysis shows that the bullish momentum is waning, and it faces a directional choice in the short term. Aggressive traders can lightly test the waters near support/resistance levels, while conservative traders are advised to wait for clear breakout signals (such as a volume - based breakout of the upper wedge or an effective breakdown of the lower wedge) before entering the market. At the same time, strictly control positions and stop - losses to avoid volatility risks before the pattern is confirmed.

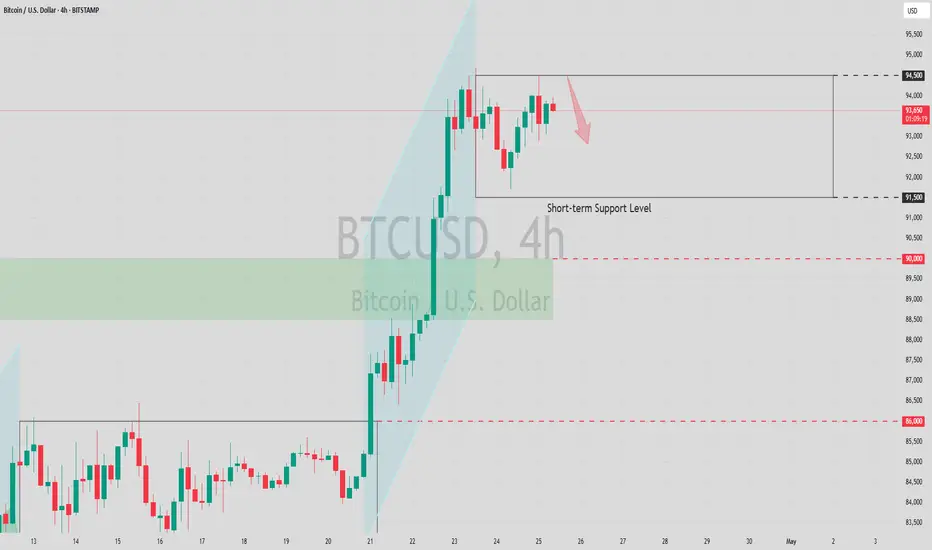
Short-term shorting opportunities emergeBTC encountered significant resistance near $94,500 during this week's rally, and short-selling operations can be attempted when approaching this price level.
BTCUSD
sell@94000-94500
tp:93000-92500
I hope this strategy will be helpful to you.
When you find yourself in a difficult situation and at a loss in trading, don't face it alone. Please get in touch with me. I'm always ready to fight side by side with you, avoid risks, and embark on a new journey towards stable profits.
BTCUSD 4 - hour Chart AnalysisBTCUSD 4 - hour Chart Analysis
I. Trend Judgment
From the 4 - hour chart, BTCUSD is on an upward trend, consolidating at relatively high levels. Despite price fluctuations, bulls are still in control to some extent 🐂.
II. Key Levels
Support Area: The 90,000 - 91,500 range is a key support zone. The price has rebounded here multiple times, suggesting strong buying interest. If it drops back, it could be a buying opportunity 📈. 86,000 and 83,000 are additional lower - level supports.
Resistance Area: 95,000 is the resistance area. The price has faced hurdles here. If bullish momentum strengthens, breaking this could open up more upside 🚀.
III. Trading Strategies
Long - position Strategy: When the price retreats to the 90,000 - 91,500 support area and a bullish candlestick shows up, consider going long. Place stop - loss below the support and aim for 95,000. If broken, higher levels may follow 💰.
Short - position Strategy: Near 95,000, if a bearish candlestick appears with rising volume, try a small short position. Set stop - loss above resistance and target 91,500 - 90,000 ⬇️.
⚡⚡⚡ BTCUSD ⚡⚡⚡
🚀 Sell@95000 - 94000
🚀 TP 92000 - 91000
🚀 Buy@91000 - 92000
🚀 TP 94000 - 95000
Accurate signals are updated every day 📈 If you encounter any problems during trading, these signals can serve as your reliable guide 🧭 Feel free to refer to them! I sincerely hope they'll be of great help to you 🌟

BTCUSDT- high placed? What's next??#BTCUSDT - well after a fantastic bull run market placed a reasonable high in yesterday,
Keep close that region b cause if market hold it in that case we can expect a drop from here.
Good luck
Trade wisley

BTC may drop back to 90,000 pointsBTC is likely to pull back to around 90,000 points before starting to rebound.
In terms of capital flow, the upward momentum of XAU/USD has been temporarily halted ⏸️, and a large amount of capital is rapidly flowing into the virtual currency market 💸! As the leader of virtual currencies, Bitcoin has undoubtedly become an important destination for capital inflows 🌟. The injection of a large amount of capital has directly driven a significant surge in the price of BTC 📈. Capital chases profits just like water flows 🌊. Against the backdrop of the phased adjustment in the gold market, Bitcoin, with its unique technological attributes and market vitality, has attracted the attention of many investors, laying a solid capital foundation for its subsequent price increase 🏗️.
At the macro policy level, Trump's remarks have had a strong impact on the financial market 😲! His change in attitude towards Fed Chairman Powell has triggered the reallocation of market funds 🔄. When he previously threatened to remove Powell, investors' concerns about the Fed's policy intensified, and they flocked to the gold market for hedging, pushing up the gold price 🚀. However, Trump's latest statement that he will not fire Powell and his call for interest rate cuts have alleviated some of the investors' anxiety, prompting funds to flow back into US dollar - denominated assets 📉. It should be noted that during this process, some of the funds withdrawn from the gold market have not fully returned to traditional US dollar assets but have flowed into the virtual currency field such as Bitcoin 💥. As an emerging digital asset, Bitcoin has both certain hedging and speculative attributes, and has become a new safe haven and value - added target for funds 💰.
In international trade, Trump has shown signs of easing in the trade negotiations with China and is trying to reach an agreement quickly to reduce tariffs (although not to zero) 🤝. The past uncertainty in trade relations was one of the important factors driving up the gold price ⚠️. With the expected easing of trade tensions, potential future trade easing measures may suppress the market demand for gold as a safe haven asset ⏳. In contrast, the Bitcoin market is less directly affected by trade policies. Instead, due to its characteristics such as decentralization and global circulation 🌐, it has gained more favor during the process of capital reallocation. When the attractiveness of traditional safe haven assets declines, the scarcity and innovation of Bitcoin make it a new choice for investors to diversify risks and pursue returns 🎯, further stimulating the market demand for BTC 📈.
⚡⚡⚡ BTCUSD ⚡⚡⚡
🚀 Sell@92000 - 92500
🚀 TP 91000 - 90000
The market has been extremely volatile lately 📈📉 If you can't figure out the market's direction, you'll only be a cash dispenser for others 💰

Safe-haven funds continue to drive BTC higher.Yesterday, Bitcoin approached $94,000 with bulls maintaining strength, and $95,000 may become the next target. As a high-quality safe-haven asset, Bitcoin is currently still supported by uncertainties surrounding U.S. trade policies and the Federal Reserve's interest rate path. In trading operations, the strategy of going long on pullbacks should still be adhered to, with attention paid to the support level at $90,000 below.
BTCUSD
buy@93K-94K
tp:95K-96k
I hope this strategy will be helpful to you.
When you find yourself in a difficult situation and at a loss in trading, don't face it alone. Please get in touch with me. I'm always ready to fight side by side with you, avoid risks, and embark on a new journey towards stable profits.
