BTCUSDT 1DBTC ~ 1D Analysis
#BTC Let us now pray that the trade war will be completed so that this bullish pattern goes according to plan.
Btcusdtsignal

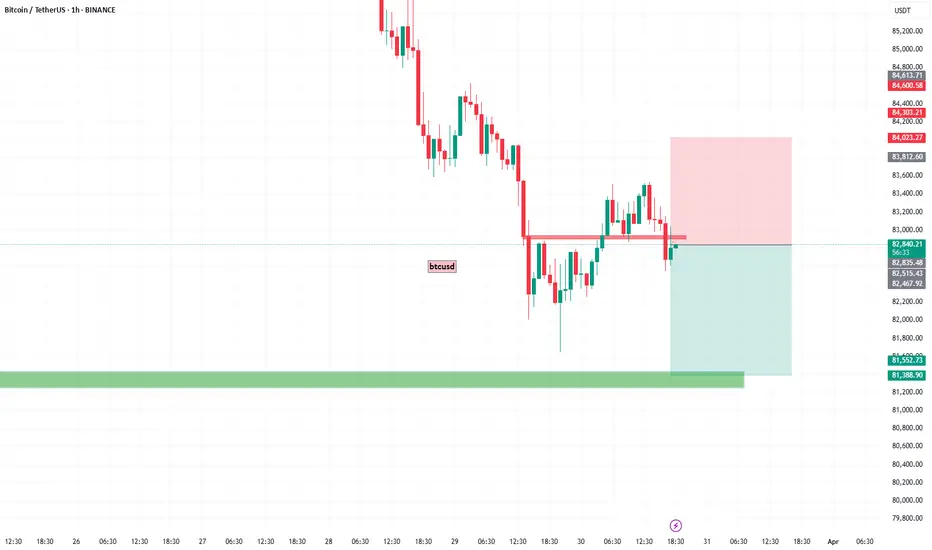
TC/USD Bearish Flag Breakdown Targeting 81,660 Support ZoneThis is a 1-hour BTC/USD (Bitcoin/US Dollar) chart showing a bearish setup. Here's the breakdown:
---
Key Observations:
1. Bearish Rejection Zone (Purple Box - ~83,174.62):
Price is showing rejection at a key resistance zone.
Both the 30 EMA and 200 EMA are above current price, adding downward pressure.
2. EMA Analysis:
30 EMA (Red Line): ~83,174.62 – acting as dynamic resistance.
200 EMA (Blue Line): ~83,715.92 – strong long-term resistance.
Price is below both EMAs, reinforcing bearish sentiment.
3. Pattern Analysis:
Bearish flag/wedge breakdown has already occurred.
Target projection based on measured move suggests a ~1.44% downside.
Anticipated drop towards 81,660.29, which aligns with prior support zone.
4. Price Action:
Recent breakdown from a small rising channel (bear flag).
Pullback to resistance (purple zone) seems complete, and continuation downward is expected.
---
Strategy Summary:
Bias: Bearish
Entry Zone: Near 83,174.62 (already rejected)
Target: 81,660.29
Stop Loss Idea: Above 83,715.92 (EMA 200)

"Bitcoin vs Tether" Crypto Market Heist Plan (Swing Trade)🌟Hi! Hola! Ola! Bonjour! Hallo! Marhaba!🌟
Dear Money Makers & Robbers, 🤑 💰💸✈️
Based on 🔥Thief Trading style technical and fundamental analysis🔥, here is our master plan to heist the BTC/USDT "Bitcoin vs Tether" Crypto Market. Please adhere to the strategy I've outlined in the chart, which emphasizes long entry. Our aim is the high-risk Red Zone. Risky level, overbought market, consolidation, trend reversal, trap at the level where traders and bearish robbers are stronger. 🏆💸"Take profit and treat yourself, traders. You deserve it!💪🏆🎉
Entry 📈 : "The heist is on! Wait for the MA breakout (87000) then make your move - Bullish profits await!"
however I advise to Place Buy stop orders above the Moving average (or) Place buy limit orders within a 15 or 30 minute timeframe most recent or swing, low or high level.
📌I strongly advise you to set an alert on your chart so you can see when the breakout entry occurs.
Stop Loss 🛑:
Thief SL placed at the recent/swing low level Using the 2H timeframe (83000) swing trade basis.
SL is based on your risk of the trade, lot size and how many multiple orders you have to take.
🏴☠️Target 🎯: 93000 (or) Escape Before the Target
🧲Scalpers, take note 👀 : only scalp on the Long side. If you have a lot of money, you can go straight away; if not, you can join swing traders and carry out the robbery plan. Use trailing SL to safeguard your money 💰.
BTC/USDT "Bitcoin vs Tether" Crypto Market Heist Plan (Swing Trade) is currently experiencing a bullishness,., driven by several key factors.
📰🗞️Get & Read the Fundamental, Macro, COT Report, On Chain Analysis, Sentimental Outlook, Intermarket Analysis, Future trend targets.. go ahead to check 👉👉👉
📌Keep in mind that these factors can change rapidly, and it's essential to stay up-to-date with market developments and adjust your analysis accordingly.
⚠️Trading Alert : News Releases and Position Management 📰 🗞️ 🚫🚏
As a reminder, news releases can have a significant impact on market prices and volatility. To minimize potential losses and protect your running positions,
we recommend the following:
Avoid taking new trades during news releases
Use trailing stop-loss orders to protect your running positions and lock in profits
💖Supporting our robbery plan 💥Hit the Boost Button💥 will enable us to effortlessly make and steal money 💰💵. Boost the strength of our robbery team. Every day in this market make money with ease by using the Thief Trading Style.🏆💪🤝❤️🎉🚀
I'll see you soon with another heist plan, so stay tuned 🤑🐱👤🤗🤩

#BTC SHORT-TERM UPDATES!🔥 CRYPTOCAP:BTC is forming a bullish falling wedge on the 12H chart!
Price is compressing inside a key pattern —a breakout could send it flying!
Support is holding strong, and volume is cooking up!
Are you ready for the move?
CRYPTOCAP:BTC BITSTAMP:BTCUSD BINANCE:BTCUSDT

BTCUSDT:Test support, go long on pullbackBitcoin has also experienced a rapid decline due to the tariff remarks of the U.S. government. It is currently testing a key support level. If it continues to fall and breaks below 81,126, a bearish trend will be confirmed. If this support level is not breached, one can initiate long positions at the low level.
Trading Strategy:
buy@81500-82500
TP:83500-84500
Get daily trading signals that ensure continuous profits! With an astonishing 90% accuracy rate, I'm the record - holder of an 800% monthly return. Click the link below the article to obtain accurate signals now!

BTCUSDT:The long position strategy has reaped profits successfulAs I had anticipated, Bitcoin (BTC) has started to recover. BTC has successfully broken through the 86,500 mark and even reached 87,000. The long position strategy has achieved profitability.
Currently, Bitcoin still maintains a bullish trend. It is advisable to wait for a price pullback and then initiate long positions.
BTC Trading strategy:
buy@84500-85500
TP:86500-87500
Get daily trading signals that ensure continuous profits! With an astonishing 90% accuracy rate, I'm the record - holder of an 800% monthly return. Click the link below the article to obtain accurate signals now!

BTCUSDT:started to recover!!As I stated in my previous idea, the entire bearish trend is merely a well-structured catalyst. Its function is to attract breakout sellers, create the illusion of a sustained downward trend, and trap liquidity at the low points before the true direction becomes apparent. Retail traders who short this structure are providing momentum for the next upward rally.
BTC has started to recover. Today, it directly surged to around 85,500. Currently, Bitcoin still maintains a bullish trend. It is advisable to wait for a price pullback and then initiate long positions.
BTC Trading strategy:
buy@83500-84500
TP:85500-86500
Get daily trading signals that ensure continuous profits! With an astonishing 90% accuracy rate, I'm the record - holder of an 800% monthly return. Click the link below the article to obtain accurate signals now!

BTC:Start to recoverBTC broke below 83,000 and continued to decline, reaching around the lowest level of 82,000. Currently, it generally shows a downward trend.
In my opinion, the entire bearish trend is merely a well-structured catalyst. Its function is to attract breakout sellers, create the illusion of a sustained downward trend, and trap liquidity at the low points before the true direction becomes apparent. Retail traders who short this structure are providing momentum for the next upward rally.
Before that, BTC can still be regarded as bullish, and each pullback to the demand zone can be considered as an opportunity to go long.
BTC Trading strategy:
buy@82000-82500
TP:83000-85000
Get daily trading signals that ensure continuous profits! With an astonishing 90% accuracy rate, I'm the record - holder of an 800% monthly return. Click the link below the article to obtain accurate signals now!

BTCUSD Trading StrategyBTCUSD has experienced a significant decline. While the indicators have yet to show signs of stabilization or a trend reversal, the price action on the candlestick chart indicates that there is support in the range of 82,000-80,000. Therefore, I believe it is an opportune moment to position for a long trade within this range, exercising patience as we await a price rebound to achieve the TP1/TP2 targets.

BTC:Anticipate an upward movementBTC broke below 83,000 and continued to decline, reaching around the lowest level of 82,000. Currently, it generally shows a downward trend.
In my opinion, the entire bearish trend is merely a well-structured catalyst. Its function is to attract breakout sellers, create the illusion of a sustained downward trend, and trap liquidity at the low points before the true direction becomes apparent. Retail traders who short this structure are providing momentum for the next upward rally.
Before that, BTC can still be regarded as bullish, and each pullback to the demand zone can be considered as an opportunity to go long.
BTC Trading strategy:
buy@82000-82500
TP:83000-85000
Get daily trading signals that ensure continuous profits! With an astonishing 90% accuracy rate, I'm the record - holder of an 800% monthly return. Click the link below the article to obtain accurate signals now!

BTCUSDT SELL/ SHORTBy utilizing Fibonacci retracement levels, historical patterns, , we can formulate a hypothesis that the market might follow a similar trajectory if bearish sentiment prevails.
U.S. Econ Shocks: Bitcoin & Profit SignalsThe latest U.S. economic data has brought significant impacts. The core PCE inflation witnessed a 0.4% month - on - month increase, hitting the highest growth in a year, with a year - on - year rise of 2.8%, exceeding market anticipations. Meanwhile, the long - term inflation expectation from the University of Michigan has soared to a 32 - year high, intensifying market concerns about inflation's resurgence. Currently, the market remains enveloped in macro - risks, pending a softening of market sentiment.
Turning to the Bitcoin market, as depicted in today's price trend (the current BTCUSDT price is $82,338.01, dropping by $2,086.37, a 2.47% decline), the K - line chart analysis indicates a downward trend. The Williams indicator signals an oversold condition. Additionally, trading volume has contracted recently, with both price and volume decreasing, suggesting a sluggish and inactive market.
Nevertheless, if Bitcoin can stabilize above $82,000 and there are signs of capital reflux, gradual position - building may be considered, with a target price set above $90,000. Investors must recognize that the Bitcoin market brims with uncertainties. Variables such as forthcoming U.S. economic data, regulatory policies, and geopolitical scenarios will all sway Bitcoin prices. In this volatile financial landscape, meticulous analysis and judicious decision - making are of utmost importance for investors navigating the Bitcoin market.
BTCUSDT
buy@82000-83000
tp:84500-86500
I will share trading signals every day. All the signals have been accurate for a whole month in a row. If you also need them, please click on the link below the article to obtain them.

BTC:Seize the opportunity to go long
BTC broke below 83,000 and continued to decline, reaching around the lowest level of 82,000. Currently, it generally shows a downward trend.
In my opinion, the entire bearish trend is merely a well-structured catalyst. Its function is to attract breakout sellers, create the illusion of a sustained downward trend, and trap liquidity at the low points before the true direction becomes apparent. Retail traders who short this structure are providing momentum for the next upward rally.
Before that, BTC can still be regarded as bullish, and each pullback to the demand zone can be considered as an opportunity to go long.
BTC Trading strategy:
buy@82000-82300
TP:83000-85000
Get daily trading signals that ensure continuous profits! With an astonishing 90% accuracy rate, I'm the record - holder of an 800% monthly return. Click the link below the article to obtain accurate signals now!

BTCUSDT:Consider going long at a lower priceIt can be seen from the chart that BTC has successfully broken through the support level of 86,000 over the past few days and has approached the historical resistance level. We can monitor the latest support level around 83,500. If this level is not broken through within a short period of time, one may consider initiating a long position at a relatively low price.
BTC Trading strategy:
buy@83500-84000
TP:86500-87500
Get daily trading signals that ensure continuous profits! With an astonishing 90% accuracy rate, I'm the record - holder of an 800% monthly return. Click the link below the article to obtain accurate signals now!

BTC:Today's Profit-making StrategyThe price of BTCUSDT has been moving steadily for many days and is now forming a potential bullish continuation setup.
A retracement to the 86,500 area is expected. If the price respects this area and shows a bullish reaction, a long - position opportunity emerges.
BTC Trading strategy:
buy@86500
TP:87500-88500
Get daily trading signals that ensure continuous profits! With an astonishing 90% accuracy rate, I'm the record - holder of an 800% monthly return. Click the link below the article to obtain accurate signals now!

BTC's Bull Run: Profit Realized, Resistance AheadCurrently, BTC is hovering around $88,000. We had already achieved our profit target yesterday. Ever since BTC broke through the $85,000 mark, it has been rising continuously. The market is in a bullish - dominated trend, with strong buying power driving the price up steadily. Although it's in an uptrend, there's uncertainty about its future movement as it hasn't broken through the $89,000 - $90,000 resistance range. If it fails to break through this resistance zone effectively, the price may decline again eventually.
I will share trading signals every day. All the signals have been accurate for a whole month in a row. If you also need them, please click on the link below the article to obtain them.

BTC:Today's trading strategyBitcoin is currently in a continuous fluctuating situation. Yesterday's temporary rally also indicates that it is still unable to break through the resistance level of 89,000 for the time being, and there is a downward extension trend.
The strategy of shorting at the high level yesterday has already yielded profits. Today, on the rebound at a high level, continue to take short positions.
BTC Trading strategy:
Sell@88000-88500
TP1:85500
TP2:84000
Get daily trading signals that ensure continuous profits! With an astonishing 90% accuracy rate, I'm the record - holder of an 800% monthly return. Click the link below the article to obtain accurate signals now!

BTC/USDT:Pay attention to the resistance zone.BTC fluctuated within the forecast and reached the profit point. However, the 88K-89K resistance area needs to be watched, and if it cannot be effectively broken this week, then it will fall
This week, the BTC trading strategy was completely correct and the account made more than 200% profit in two weeks
We share various trading signals every day with over 90% accuracy
Fans who follow us can get high rewards every day
If you want stable income,You can follow the link below this article

BTCUSD LOOKING MORE BULLISH market take sell side liquidity now going for kill buy side liquidity .we have fvg in daily tf we will use confirmation in daily fvg

Bitcoin (BTC/USD) Bullish Momentum: Key Levels and Trade Setupuddy'S dear friend 👋 SMC Trading Signals Update 🗾 🗺️
Technical Analysis:
Timeframe: 4-hour chart
Current Price: $88,244
Trend: Uptrend within an ascending channel
Supply Resistance Zone: $92,721 (Potential reversal area)
Fair Value Gap (FVG) Support Zone: $87,200 - $87,600
200 MA Resistance: Price is approaching the 200 Moving Average, which could act as resistance.
Key Levels:
1. Support:
FVG Zone (~$87,200 - $87,600) – Potential buy zone
Major Support: $86,649
2. Resistance:
$92,721 (Supply Zone) – Key target level
$90,000 Psychological Resistance
3. RSI Indicator:
Currently at 76.37, indicating overbought conditions.
A potential pullback could occur before further upside.
Mr SMC Trading point
Risk Management Strategy:
Long Entry: Near FVG Zone (~$87,200 - $87,600) if price retraces.
Stop Loss: Below $86,649 to limit downside risk.
Take Profit: Around $92,721 for a risk-reward trade.
Market Outlook:
Bitcoin remains bullish, but the RSI suggests a possible pullback before continuation.
A retracement into the FVG Zone may provide a better buying opportunity before the next leg up.
If price breaks below the FVG zone, the uptrend could weaken.
Pales support boost 🚀 analysis follow)

Whether BTC can reach 90KWhether BTC can reach 90K
Our strategy has made a profit and now BTC is testing the 88K resistance, let's see if we can break it today

BTC Today's strategyHi guys, it's a new week and the charts show it's moving up the channel
Looking back on the trading strategy we developed last week, we were undoubtedly successful. Now that the price has exceeded 87K, we still need to pay attention to the resistance of 88K, as it is the determinant of whether the upside can be
btcusdt buy@84.5K-85K
tp:87.5K-88K
We share various trading signals every day with over 90% accuracy.
Fans who follow us can get high rewards every day
If you want stable income, you can contact me.

BTC:Short at high levelsAs per my previous strategy, Bitcoin is on an upward trend. It witnessed a strong rally at today's opening and faced short - term resistance around 88,000. If it fails to break through 88,000 in the short term, one can seize the opportunity of the price pullback from the high level to initiate short positions.
BTC Trading strategy:
Sell@88000-88500
TP1:85500
TP2:84000
Get daily trading signals that ensure continuous profits! With an astonishing 90% accuracy rate, I'm the record - holder of an 800% monthly return. Click the link below the article to obtain accurate signals now!
