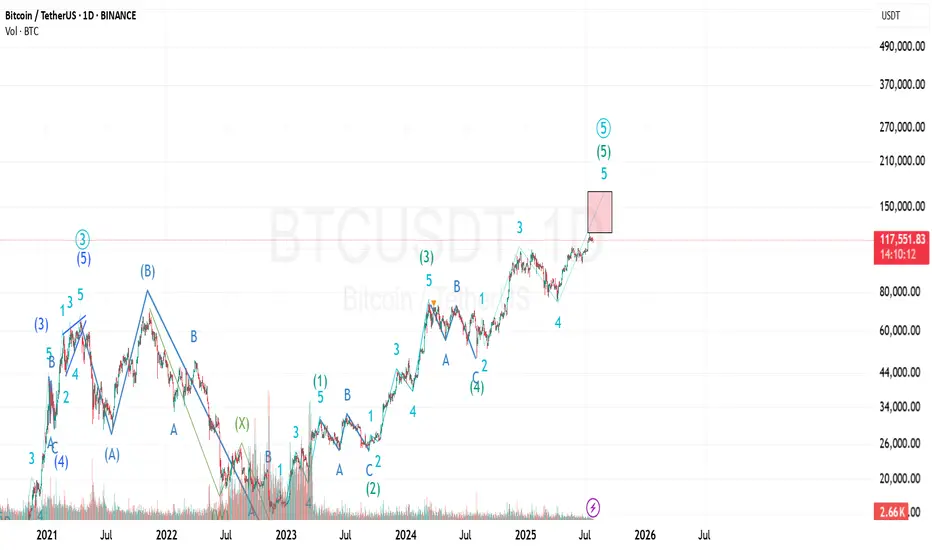
Bitcoin Prediction UpdateI've just modified the wave count and still the previous analysis is valid...
I'm not sure about the target of the last wave (the 5th of 5th wave) because it can be an extended wave...
The shown box is where I'll investigate to find any ending pattern...
Btcusdtupdate

BTCUSD SHORT OPPORTUTY FOR THE WEEKENDBITCOIN SUPPLY ZONE TARGETED - SELL LIMIT SET 🔥
BTC/USD has made a strong move upward but is now approaching a major supply zone, where a Sell Limit is placed at 110997. This level aligns with previous highs and signs of distribution, signaling a potential reversal ahead.
With current price action consolidating around 109034, we are watching for rejection and a possible drop towards the next demand zones at 108551 and 106178.
This setup is ideal for smart traders looking to short the top and ride the retracement. As always, risk management is key. Let’s see how the market reacts.
Precision over prediction. Strategy over emotions.
#BTCUSD #BitcoinAnalysis #CryptoTrading #SellLimit #SmartMoneyConcepts #SupplyAndDemand #TechnicalAnalysis #DayTrading #CryptoSetup #BTCTrade #BearishSetup #PriceAction #CryptoSniper #BitcoinReversal #TradingStrategy #CryptoTraders #MarketStructure #XAUkingCharts

Still bullish, it is recommended to focus on going long.Earlier, Bitcoin reached a weekly high of $106,518 before pulling back due to market liquidation, with total market liquidations exceeding $669 million. Bitcoin has closed higher for five consecutive weeks on the weekly chart, forming a "higher highs and higher lows" upward pattern, rising nearly 43.75% from its recent low. However, it encountered resistance near the all-time high of $109,588 and failed to break through. Currently, Bitcoin is trading in the $100,000-$110,000 range, with strong support at $100,000 and $90,000, and key resistance at $110,000.👉👉👉
After Bitcoin previously broke through $105,500, the moving averages showed an upward trend, and the RSI was in the overbought zone, indicating strong bullish momentum.
Overall, under the combined influence of news and technical factors, the Bitcoin market on May 19th showed a short-term volatile but long-term optimistic trend. Investors need to closely monitor changes in key support and resistance levels, as well as the impact of market news, and make investment decisions cautiously.
BTCUSD Trading Strategy
buy @ 102500-102700
sl 101000
tp 103800-104000
If you think the analysis helpful, you can give a thumbs-up to show your support. If you have different opinions, you can leave your thoughts in the comments. Thank you for reading!👉👉👉

Bitcoin remains in high-level fluctuationsThe price of Bitcoin has generally remained above $103,000 today, demonstrating strong support. In the short term, after experiencing previous fluctuations, Bitcoin is currently in a relatively stable upward trend and continues to move towards higher prices.👉👉👉
Global economic events have contributed to the rise of Bitcoin. The decision between China and the U.S. to temporarily reduce tariffs has improved investor confidence and encouraged market risk appetite, making funds more willing to flow into risky assets like Bitcoin.
From a technical perspective, Bitcoin is in a strong upward trend. The RSI is above 70, indicating that Bitcoin may be in an overbought state in the short term. This could lead to a slight pullback or sideways consolidation in the upcoming market to digest excessive buying pressure. Investors need to pay attention to potential pullback risks, while closely monitoring factors such as macroeconomic data, policy changes, and market capital flows to adjust investment strategies in a timely manner.
BTCUSD Trading Strategy
buy @ 102700-103000
sl 101000
tp 104000-104200
If you think the analysis helpful, you can give a thumbs-up to show your support. If you have different opinions, you can leave your thoughts in the comments. Thank you for reading!👉👉👉

Summary of Bitcoin Last WeekThe overall trend of the Bitcoin market shows a pattern of "first decline and then rise". The price has continuously broken through several key technical resistance levels, strongly breaking through the psychological barrier of the $100,000 mark and reaching a new stage high.👉👉👉
With the rise in price, the hash price of Bitcoin has steadily rebounded and is approaching the high range of the past month, rising for several consecutive days, indicating that the market demand for computing power resources remains robust.
Overall, after the previous fluctuations, the Bitcoin market has demonstrated strong resilience and optimistic expectations under the dominance of the bulls in the recent period. However, the cryptocurrency market is highly uncertain and risky, and investors still need to approach it with caution.
If you approve of my analysis, you can give it a thumbs-up as support. If you have different opinions, you can leave your thoughts in the comments.Thank you!👉👉👉

BTC Forming Bullish Structure — But Wait for the Higher LowAfter months of lower lows and lower highs, Bitcoin has finally broken structure by pushing above the previous lower high, officially forming a new higher high (HH). This is an early sign of a potential trend reversal back into bullish territory.
However, before momentum continues upward, a healthy retracement could occur. The key level to watch is the support zone around $91,200. If price pulls back and forms a higher low (HL) here or slightly lower around the $88,700–$87,500 zone, it would confirm the bullish structure and potentially kickstart the next leg up.
Patience is key here — let the higher low form before looking for long setups.

BTC/USD "Bitcoin vs U.S.Dollar" Crypto Market Heist (Swing/Day)🌟Hi! Hola! Ola! Bonjour! Hallo! Marhaba!🌟
Dear Money Makers & Robbers, 🤑💰✈️
Based on 🔥Thief Trading style technical and fundamental analysis🔥, here is our master plan to heist the BTC/USD "Bitcoin vs U.S.Dollar" Crypto Market. Please adhere to the strategy I've outlined in the chart, which emphasizes long entry and short entry. 🏆💸Be wealthy and safe trade.💪🏆🎉
Entry 📈 :
"The loot's within reach! Wait for the breakout, then grab your share - whether you're a Bullish thief or a Bearish bandit!"
🏁Buy entry above 89000
🏁Sell Entry below 81000
📌However, I recommended to place buy stop for bullish side and sell stop for bearish side.
Stop Loss 🛑:
🚩Thief SL placed at 84000 for Bullish Trade
🚩Thief SL placed at 88000 for Bearish Trade
Using the 4H period, the recent / swing low or high level.
SL is based on your risk of the trade, lot size and how many multiple orders you have to take.
Target 🎯:
🏴☠️Bullish Robbers TP 99000 (or) Escape Before the Target
🏴☠️Bearish Robbers TP 72000 (or) Escape Before the Target
BTC/USD "Bitcoin vs U.S.Dollar" Crypto Market Heist Plan is currently experiencing a neutral trend,., driven by several key factors.
📰🗞️Get & Read the Fundamental, Macro, COT Report, On Chain Analysis, Sentimental Outlook, Intermarket Analysis, Future trend targets.. go ahead to check 👉👉👉🔗
⚠️Trading Alert : News Releases and Position Management 📰 🗞️ 🚫🚏
As a reminder, news releases can have a significant impact on market prices and volatility. To minimize potential losses and protect your running positions,
we recommend the following:
Avoid taking new trades during news releases
Use trailing stop-loss orders to protect your running positions and lock in profits
💖Supporting our robbery plan 💥Hit the Boost Button💥 will enable us to effortlessly make and steal money 💰💵. Boost the strength of our robbery team. Every day in this market make money with ease by using the Thief Trading Style.🏆💪🤝❤️🎉🚀
I'll see you soon with another heist plan, so stay tuned 🤑🐱👤🤗🤩
BTCUSD Daily Trend Analysis is BullishAccording to my momentum analysis, BTCUSD confirmed Bullish trend on April 12, 2025 with entry price at 83624 and stop-loss at 74373. It is likely to continue the trend till 91980 and if breaks and closes above 91980, there is a possibility of hitting the target at 102754.

BTC/USDT Monthly Outlook📊 BTC/USDT Monthly Outlook – Smart Money Perspective
Bitcoin is currently trading around $83,565, with price consolidating after a Market Structure Shift (MSS) on the higher time frame.
🔹 Key Highlights:
A strong bullish impulse led to a break of monthly structure (MSS), creating Fair Value Gaps (FVG) both above and below.
Price is currently within a monthly FVG, showing indecision and potential for either continuation or deeper retracement.
Liquidity buy side rests near $110,000, marking a logical target if price respects current FVG support.
On the downside, a deeper retracement could aim for the lower FVG and sweep sell-side liquidity around $48,000–52,000.
📌 Scenarios:
Bullish case: Rejection from current FVG zone, followed by continuation toward the buy-side liquidity.
Bearish case: Break below current FVG, targeting the next zone and filling imbalances below.
🧠 Watch how price reacts to the current FVG. Smart money will likely seek liquidity before committing to a clear direction.
⚠️ This analysis is for educational purposes only and not financial advice.

BTC Update... What To Expect Now??Currently BTC is facing resistance of major trendline (Blue line)+ wedge resistance+ bearish OB resistance...
For bullish trend, currently Bitcoin have to break above all these resistances along with 89k level for confirmation of bullish trend....
If it fails and retraces back inside Monday high range, then we can expect price dropping below Monday lows where major support level is present+ Bat Harmonic Potential Reversal Zone+ 61.8 Golden Fib Level around 72000-70500 levels.

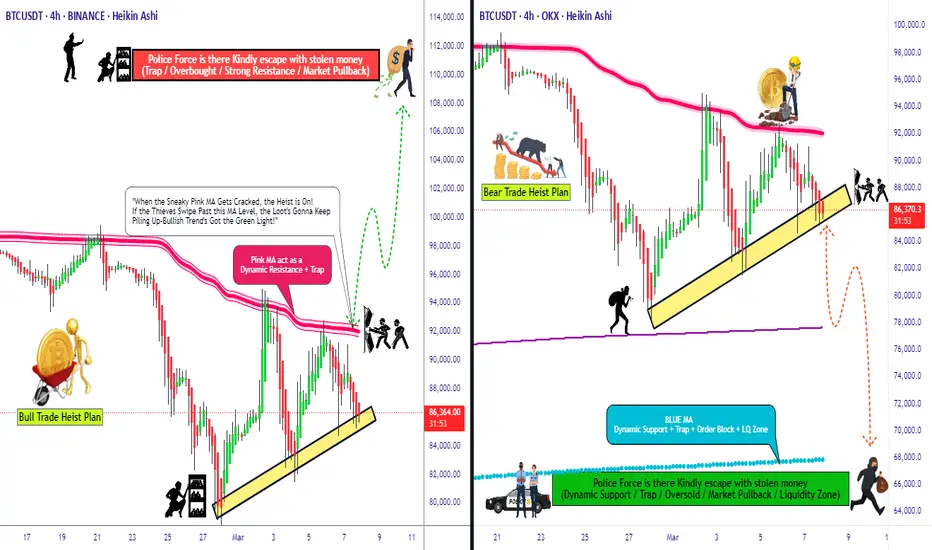
BTC/USD "Bitcoin vs Tether" Crypto Market Heist Plan🌟Hi! Hola! Ola! Bonjour! Hallo! Marhaba!🌟
Dear Money Makers & Robbers, 🤑💰✈️
Based on 🔥Thief Trading style technical and fundamental analysis🔥, here is our master plan to heist the BTC/USD "Bitcoin vs Tether" Crypto market. Please adhere to the strategy I've outlined in the chart, which emphasizes long entry and short entry. 🏆💸Be wealthy and safe trade.💪🏆🎉
Entry 📈 :
"The loot's within reach! Wait for the breakout, then grab your share - whether you're a Bullish thief or a Bearish bandit!"
🏁Buy entry above 93000
🏁Sell Entry below 84000
📌However, I recommended to place buy stop for bullish side and sell stop for bearish side.
Stop Loss 🛑:
🚩Thief SL placed at 88000 (swing Trade Basis) for Bullish Trade
🚩Thief SL placed at 92000 (swing Trade Basis) for Bearish Trade
Using the 4H period, the recent / swing low or high level.
SL is based on your risk of the trade, lot size and how many multiple orders you have to take.
Target 🎯:
🏴☠️Bullish Robbers TP 11000 (or) Escape Before the Target
🏴☠️Bearish Robbers TP 68000 (or) Escape Before the Target
📰🗞️Fundamental, Macro, COT Report, On Chain Analysis, Sentimental Outlook, Intermarket Analysis, Future Prediction:
BTC/USD "Bitcoin vs Tether" Crypto market is currently experiencing a Neutral Trend (slightly Bearish🐼),., driven by several key factors.
1. Fundamental Analysis⭐⚡🌟
Fundamental analysis evaluates Bitcoin’s intrinsic drivers:
Adoption Trends:
Institutional inflows via Bitcoin ETFs remain strong, with $1.5 billion added in Q1 2025. MicroStrategy holds 300,000 BTC, reinforcing corporate adoption—bullish.
Regulatory Environment:
The U.S. signals a pro-crypto stance with talks of a strategic Bitcoin reserve, boosting confidence—bullish. However, global regulatory uncertainty (e.g., EU tax proposals) adds mild bearish pressure.
Halving Impact:
Post-2024 halving (April), supply issuance dropped to 450 BTC/day. Historical patterns suggest price appreciation 12-18 months later, supporting a bullish outlook for 2025.
Network Usage:
Transaction volume is up 10% year-over-year, driven by Layer 2 solutions (e.g., Lightning Network)—bullish for utility and value.
Inflation Hedge Narrative:
With U.S. inflation at 3.0%, Bitcoin’s appeal as a store of value grows—bullish, though tempered by short-term risk-off sentiment.
Detailed Explanation: Fundamentals are strongly bullish long-term due to adoption, supply scarcity, and macro trends. Short-term bearish pressures from regulatory uncertainty and profit-taking explain the current dip to 87,000.
2. Macroeconomic Factors⭐⚡🌟
Macroeconomic conditions influencing BTC/USD:
U.S. Economy:
Fed rates at 3.0% with no immediate cuts signal tighter conditions—bearish short-term as capital favors yield-bearing assets.
Unemployment steady at 4.2% supports economic stability—neutral.
Global Growth:
China’s GDP growth slows to 4.2%, reducing demand for risk assets like Bitcoin—bearish.
Eurozone PMI at 47.8 indicates contraction, pressuring global markets—bearish.
Currency Markets:
USD strength (DXY at 106) weighs on BTC/USD, as a stronger dollar reduces Bitcoin’s appeal—bearish short-term.
Commodity Prices:
Oil at $68/bbl and gold at $2,950 reflect a mixed risk environment—neutral for Bitcoin.
Geopolitical Risk:
Middle East tensions elevate safe-haven demand, but Bitcoin’s correlation with gold is weakening—neutral to mildly bearish.
Detailed Explanation: Macro factors tilt bearish short-term due to USD strength and global slowdown, countering Bitcoin’s long-term bullish fundamentals. This tension explains the current downward trend from higher levels.
3. Commitments of Traders (COT) Data⭐⚡🌟
COT data reflects futures positioning:
Speculative Traders:
Net long positions at 15,000 contracts, down from 25,000 at the 95,000 peak. Reduced bullishness suggests caution—bearish signal.
Commercial Hedgers:
Net short at 20,000 contracts, stable. Hedgers locking in gains indicate no panic—neutral.
Open Interest:
45,000 contracts, down 10% from February highs. Declining participation hints at fading momentum—bearish.
Detailed Explanation: COT data supports a bearish short-term view. Speculators unwinding longs and falling open interest align with the downward trend, though hedgers’ stability prevents a sharper collapse.
4. On-Chain Analysis⭐⚡🌟
On-chain metrics provide insights into Bitcoin’s network activity:
Exchange Balances:
2.6 million BTC on exchanges, up 5% in March. Rising supply suggests selling pressure—bearish.
Transaction Volume:
Daily volume at $10 billion, flat month-over-month. Lack of growth signals reduced buying interest—neutral to bearish.
HODLing Behavior:
70% of BTC unmoved for over a year (13.8 million coins). Strong holder conviction limits downside—bullish long-term.
Miner Activity:
Miners hold 1.8 million BTC, with minimal outflows. Stable miner behavior supports price floors—mildly bullish.
Realized Price Levels:
Realized cap indicates a cost basis of 78,000 for recent buyers, acting as support—bullish if held.
Detailed Explanation: On-chain data is mixed. Short-term bearish signals from exchange inflows contrast with long-term bullishness from HODLing and miner stability, suggesting a correction rather than a collapse.
5. Intermarket Analysis⭐⚡🌟
Correlations with other markets:
USD Strength:
DXY at 106 pressures BTC/USD inversely—bearish short-term.
S&P 500:
At 5,900, down 2% this week, reflecting risk-off sentiment. Bitcoin’s 0.6 correlation with equities adds downward pressure—bearish.
Gold:
At $2,950, gold rises as a safe haven, decoupling from Bitcoin—neutral to bearish.
Bond Yields:
U.S. 10-year yields at 3.8% attract capital away from risk assets—bearish.
Altcoins:
ETH/BTC ratio at 0.035, with altcoins underperforming Bitcoin, reinforcing BTC’s relative strength—mildly bullish.
Detailed Explanation: Intermarket signals are bearish short-term due to USD strength, equity declines, and yield competition. Bitcoin’s resilience versus altcoins offers some support, but broader risk-off trends dominate.
6. Market Sentiment Analysis⭐⚡🌟
Investor and trader mood:
Retail Sentiment:
Social media analysis shows 45% bullish sentiment, down from 60% at 95,000. Fear of further drops prevails—bearish.
Analyst Views:
Consensus targets range from 80,000 (short-term support) to 100,000 (Q3 2025), reflecting uncertainty—mixed.
Options Market:
Call/put ratio at 0.9, with balanced positioning. No strong directional bias—neutral.
Fear & Greed Index:
At 40 (neutral), down from 70 (greed) in February, indicating cooling enthusiasm—bearish shift.
Detailed Explanation: Sentiment has turned bearish short-term as retail investors react to the decline from 95,000. Analysts’ mixed views and neutral options activity suggest a wait-and-see approach, aligning with the current trend.
7. Next Trend Move and Future Trend Prediction⭐⚡🌟
Price projections across timeframes:
Short-Term (1-2 Weeks):
Range: 84,000 - 88,500
Likely to test support at 86,000-84,000 if selling persists; a bounce to 88,500 possible on relief rally.
Catalysts: U.S. economic data (e.g., CPI on March 12), ETF flows.
Medium-Term (1-3 Months):
Range: 80,000 - 92,000
Below 84,000 targets 80,000 (realized price support); above 88,500 aims for 92,000 if risk appetite returns.
Catalysts: BOJ policy update, institutional buying.
Long-Term (6-12 Months):
Bullish Target: 100,000 - 110,000
Driven by halving cycle, adoption, and inflation hedging—65% probability.
Bearish Target: 70,000 - 75,000
Triggered by global recession or regulatory crackdown—35% probability.
Catalysts: U.S. strategic reserve decision, Q3 GDP data.
Detailed Explanation: Short-term downside to 84,000 aligns with current bearish momentum. Medium-term consolidation reflects macro uncertainty, while long-term upside to 100,000+ hinges on fundamentals prevailing over temporary setbacks.
8. Overall Summary Outlook⭐⚡🌟
BTC/USD at 87,000 is in a short-term bearish correction within a broader bullish cycle. Fundamentals (adoption, halving) and on-chain HODLing support long-term gains, but macro headwinds (USD strength, global slowdown), COT unwinding, and risk-off sentiment drive the current downward trend. Exchange inflows and declining sentiment reinforce near-term weakness, with support at 84,000-80,000 likely to hold. Medium-term recovery to 92,000 and long-term growth to 100,000+ remain plausible if catalysts align.
📌Keep in mind that these factors can change rapidly, and it's essential to stay up-to-date with market developments and adjust your analysis accordingly.
⚠️Trading Alert : News Releases and Position Management 📰 🗞️ 🚫🚏
As a reminder, news releases can have a significant impact on market prices and volatility. To minimize potential losses and protect your running positions,
we recommend the following:
Avoid taking new trades during news releases
Use trailing stop-loss orders to protect your running positions and lock in profits
💖Supporting our robbery plan 💥Hit the Boost Button💥 will enable us to effortlessly make and steal money 💰💵. Boost the strength of our robbery team. Every day in this market make money with ease by using the Thief Trading Style.🏆💪🤝❤️🎉🚀
I'll see you soon with another heist plan, so stay tuned 🤑🐱👤🤗🤩

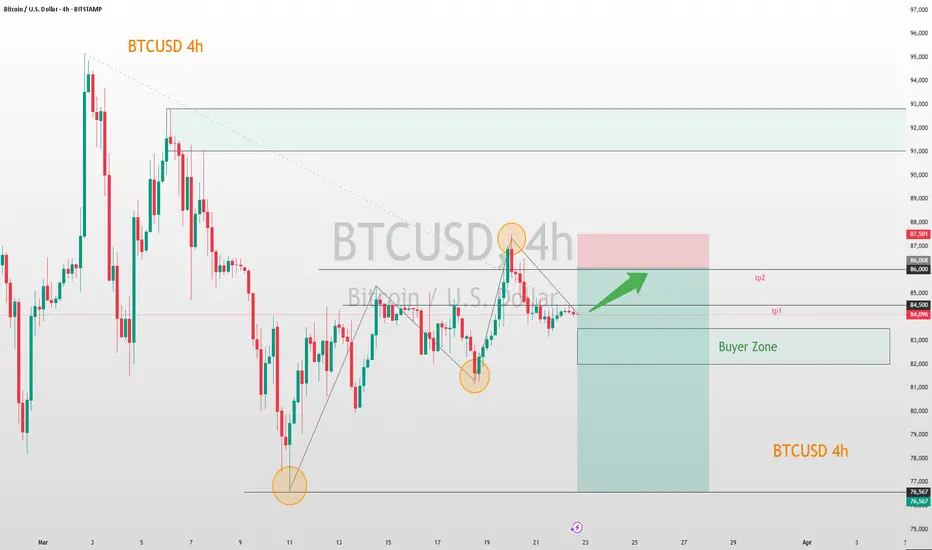
The momentum of BTC indicates its short-term potentialThe BTC/USD price is currently in a consolidation phase within a specific range.
Pay close attention to the 82,000 - 83,000 zone. Should the price retrace to this area and demonstrate signs of support, it could be a viable opportunity to initiate a small long position.
Set the target take - profit levels between 84,500 and 86,000. When the price reaches 84,500, it is advisable to consider partially closing the position to secure some profits. If it manages to break through this level, the subsequent target will be 86,000.
Considering the extreme volatility characteristic of the crypto market, prudent management of position size is of utmost importance. It's essential to refrain from overtrading to safeguard your investment capital.
BTCUSD
buy@82000-83500
tp:84500-86000
I will share trading signals every day. All the signals have been accurate for a whole month in a row. If you also need them, please click on the link below the article to obtain them.
BTC/USDT "Bitcoin vs Tether" Crypto Market Heist Plan🌟Hi! Hola! Ola! Bonjour! Hallo! Marhaba!🌟
Dear Money Makers & Robbers, 🤑💰✈️
Based on 🔥Thief Trading style technical and fundamental analysis🔥, here is our master plan to heist the BTC/USDT "Bitcoin vs Tether" Crypto market. Please adhere to the strategy I've outlined in the chart, which emphasizes long entry and short entry. 🏆💸Be wealthy and safe trade.💪🏆🎉
Entry 📈 :
"The loot's within reach! Wait for the breakout, then grab your share - whether you're a Bullish thief or a Bearish bandit!"
🏁Buy entry above 93000
🏁Sell Entry below 84000
📌However, I recommended to place buy stop for bullish side and sell stop for bearish side.
Stop Loss 🛑:
🚩Thief SL placed at 88000 (swing Trade Basis) for Bullish Trade
🚩Thief SL placed at 92000 (swing Trade Basis) for Bearish Trade
Using the 4H period, the recent / swing low or high level.
SL is based on your risk of the trade, lot size and how many multiple orders you have to take.
Target 🎯:
🏴☠️Bullish Robbers TP 11000 (or) Escape Before the Target
🏴☠️Bearish Robbers TP 68000 (or) Escape Before the Target
📰🗞️Fundamental, Macro, COT Report, On Chain Analysis, Sentimental Outlook, Intermarket Analysis, Future Prediction:
BTC/USDT "Bitcoin vs Tether" Crypto market is currently experiencing a Neutral Trend (slightly Bearish🐼),., driven by several key factors.
1. Fundamental Analysis⭐⚡🌟
Fundamental analysis evaluates Bitcoin’s intrinsic drivers:
Adoption Trends:
Institutional inflows via Bitcoin ETFs remain strong, with $1.5 billion added in Q1 2025. MicroStrategy holds 300,000 BTC, reinforcing corporate adoption—bullish.
Regulatory Environment:
The U.S. signals a pro-crypto stance with talks of a strategic Bitcoin reserve, boosting confidence—bullish. However, global regulatory uncertainty (e.g., EU tax proposals) adds mild bearish pressure.
Halving Impact:
Post-2024 halving (April), supply issuance dropped to 450 BTC/day. Historical patterns suggest price appreciation 12-18 months later, supporting a bullish outlook for 2025.
Network Usage:
Transaction volume is up 10% year-over-year, driven by Layer 2 solutions (e.g., Lightning Network)—bullish for utility and value.
Inflation Hedge Narrative:
With U.S. inflation at 3.0%, Bitcoin’s appeal as a store of value grows—bullish, though tempered by short-term risk-off sentiment.
Detailed Explanation: Fundamentals are strongly bullish long-term due to adoption, supply scarcity, and macro trends. Short-term bearish pressures from regulatory uncertainty and profit-taking explain the current dip to 87,000.
2. Macroeconomic Factors⭐⚡🌟
Macroeconomic conditions influencing BTC/USD:
U.S. Economy:
Fed rates at 3.0% with no immediate cuts signal tighter conditions—bearish short-term as capital favors yield-bearing assets.
Unemployment steady at 4.2% supports economic stability—neutral.
Global Growth:
China’s GDP growth slows to 4.2%, reducing demand for risk assets like Bitcoin—bearish.
Eurozone PMI at 47.8 indicates contraction, pressuring global markets—bearish.
Currency Markets:
USD strength (DXY at 106) weighs on BTC/USD, as a stronger dollar reduces Bitcoin’s appeal—bearish short-term.
Commodity Prices:
Oil at 668/BBL
and gold at $2,950 reflect a mixed risk environment—neutral for Bitcoin.
Geopolitical Risk:
Middle East tensions elevate safe-haven demand, but Bitcoin’s correlation with gold is weakening—neutral to mildly bearish.
Detailed Explanation: Macro factors tilt bearish short-term due to USD strength and global slowdown, countering Bitcoin’s long-term bullish fundamentals. This tension explains the current downward trend from higher levels.
3. Commitments of Traders (COT) Data⭐⚡🌟
COT data reflects futures positioning:
Speculative Traders:
Net long positions at 15,000 contracts, down from 25,000 at the 95,000 peak. Reduced bullishness suggests caution—bearish signal.
Commercial Hedgers:
Net short at 20,000 contracts, stable. Hedgers locking in gains indicate no panic—neutral.
Open Interest:
45,000 contracts, down 10% from February highs. Declining participation hints at fading momentum—bearish.
Detailed Explanation: COT data supports a bearish short-term view. Speculators unwinding longs and falling open interest align with the downward trend, though hedgers’ stability prevents a sharper collapse.
4. On-Chain Analysis⭐⚡🌟
On-chain metrics provide insights into Bitcoin’s network activity:
Exchange Balances:
2.6 million BTC on exchanges, up 5% in March. Rising supply suggests selling pressure—bearish.
Transaction Volume:
Daily volume at $10 billion, flat month-over-month. Lack of growth signals reduced buying interest—neutral to bearish.
HODLing Behavior:
70% of BTC unmoved for over a year (13.8 million coins). Strong holder conviction limits downside—bullish long-term.
Miner Activity:
Miners hold 1.8 million BTC, with minimal outflows. Stable miner behavior supports price floors—mildly bullish.
Realized Price Levels:
Realized cap indicates a cost basis of 78,000 for recent buyers, acting as support—bullish if held.
Detailed Explanation: On-chain data is mixed. Short-term bearish signals from exchange inflows contrast with long-term bullishness from HODLing and miner stability, suggesting a correction rather than a collapse.
5. Intermarket Analysis⭐⚡🌟
Correlations with other markets:
USD Strength:
DXY at 106 pressures BTC/USD inversely—bearish short-term.
S&P 500:
At 5,900, down 2% this week, reflecting risk-off sentiment. Bitcoin’s 0.6 correlation with equities adds downward pressure—bearish.
Gold:
At $2,950, gold rises as a safe haven, decoupling from Bitcoin—neutral to bearish.
Bond Yields:
U.S. 10-year yields at 3.8% attract capital away from risk assets—bearish.
Altcoins:
ETH/BTC ratio at 0.035, with altcoins underperforming Bitcoin, reinforcing BTC’s relative strength—mildly bullish.
Detailed Explanation: Intermarket signals are bearish short-term due to USD strength, equity declines, and yield competition. Bitcoin’s resilience versus altcoins offers some support, but broader risk-off trends dominate.
6. Market Sentiment Analysis⭐⚡🌟
Investor and trader mood:
Retail Sentiment:
Social media analysis shows 45% bullish sentiment, down from 60% at 95,000. Fear of further drops prevails—bearish.
Analyst Views:
Consensus targets range from 80,000 (short-term support) to 100,000 (Q3 2025), reflecting uncertainty—mixed.
Options Market:
Call/put ratio at 0.9, with balanced positioning. No strong directional bias—neutral.
Fear & Greed Index:
At 40 (neutral), down from 70 (greed) in February, indicating cooling enthusiasm—bearish shift.
Detailed Explanation: Sentiment has turned bearish short-term as retail investors react to the decline from 95,000. Analysts’ mixed views and neutral options activity suggest a wait-and-see approach, aligning with the current trend.
7. Next Trend Move and Future Trend Prediction⭐⚡🌟
Price projections across timeframes:
Short-Term (1-2 Weeks):
Range: 84,000 - 88,500
Likely to test support at 86,000-84,000 if selling persists; a bounce to 88,500 possible on relief rally.
Catalysts: U.S. economic data (e.g., CPI on March 12), ETF flows.
Medium-Term (1-3 Months):
Range: 80,000 - 92,000
Below 84,000 targets 80,000 (realized price support); above 88,500 aims for 92,000 if risk appetite returns.
Catalysts: BOJ policy update, institutional buying.
Long-Term (6-12 Months):
Bullish Target: 100,000 - 110,000
Driven by halving cycle, adoption, and inflation hedging—65% probability.
Bearish Target: 70,000 - 75,000
Triggered by global recession or regulatory crackdown—35% probability.
Catalysts: U.S. strategic reserve decision, Q3 GDP data.
Detailed Explanation: Short-term downside to 84,000 aligns with current bearish momentum. Medium-term consolidation reflects macro uncertainty, while long-term upside to 100,000+ hinges on fundamentals prevailing over temporary setbacks.
8. Overall Summary Outlook⭐⚡🌟
BTC/USD at 87,000 is in a short-term bearish correction within a broader bullish cycle. Fundamentals (adoption, halving) and on-chain HODLing support long-term gains, but macro headwinds (USD strength, global slowdown), COT unwinding, and risk-off sentiment drive the current downward trend. Exchange inflows and declining sentiment reinforce near-term weakness, with support at 84,000-80,000 likely to hold. Medium-term recovery to 92,000 and long-term growth to 100,000+ remain plausible if catalysts align.
📌Keep in mind that these factors can change rapidly, and it's essential to stay up-to-date with market developments and adjust your analysis accordingly.
⚠️Trading Alert : News Releases and Position Management 📰 🗞️ 🚫🚏
As a reminder, news releases can have a significant impact on market prices and volatility. To minimize potential losses and protect your running positions,
we recommend the following:
Avoid taking new trades during news releases
Use trailing stop-loss orders to protect your running positions and lock in profits
💖Supporting our robbery plan 💥Hit the Boost Button💥 will enable us to effortlessly make and steal money 💰💵. Boost the strength of our robbery team. Every day in this market make money with ease by using the Thief Trading Style.🏆💪🤝❤️🎉🚀
I'll see you soon with another heist plan, so stay tuned 🤑🐱👤🤗🤩
BTC/USDT chart Analysis"Now that it has broken above the channel, I think it might reach the area I've marked. What do you think?"
This keeps it clear and professional. Let me know if you want any tweaks! 🚀

BTCUSDT: $100k is Done, Next $130K? Dear Traders,
As we explained in our previous analysis that we had made on BTC, price have reached successfully 100k since the US Election fuelled up the prices of BTC and other cryptocurrencies. Now we are expecting price to drop 96k and then reverse from there.
Good luck.

Btcusdt still bullish till 32700 or 32900 because Best and A big signal for You
Btcusdt Still bullish till 32700 or 32900
because here we found
1: Deep crab Pattern wich is in Process to complete is D it ll be 1.62 wich is perfect area of nearby 32700 posible it can be 32900
2: another thing is our previous upper Trendline is nearby 32700 it can pushed by a wick 32900
3: on weekly Time frame 33000 is our Wave 1 so now we are in Wave 4 if it happen then our wave 1 cant touch the wave
perfect short ll be 32700 or near by 32900 our stop loss must be 33050
#BTC #btcsoaring #Binance #dyor #btcupdate

BTCUSDT 4HRS CHART UPDATEHello friend,
Welcome to our BTCUSDT 4hrs chart.
As we can see in the chart of BTCUSDT a Double Bottom is forming.
Which is a Bullish sign.
The price is currently Level 2 and Level 3.
The price can move to its next Level 4 and Level 5.
Thank You
And
God Bless You All!

BTCUSDT Update:💎 BTCUSDT Update:
BTC is still in the ascending channel and as long as it stays in the channel it will be Bullish. Next Target is 70K, If it gets out of the channel we expect a correction.
🌐 Tradingview
🏁 Short & Medium Term
💵 Invest Only 5% of your Portfolio
🎳 Entry at Market or at 56500.0
☕️ TP1 63000.00
🍺 TP2 70000.00
🍻 TP3 77777.00
🍾 TP4 _________
🍷 TP5 _________
🍸 TP6 _________
🍹 TP7 _________
🎁 TP8 _________
🚫 SL 54000.00
Good Luck 🎲
Check the Links in Description and If you LIKE this analysis, Please support our page and Ideas by hitting the LIKE 👍 button. ❤️ Your Support is really appreciated! ❤️
Traders, if you have your own opinion about it, please write your own in the comment box. We will be glad for this.
Feel free to request any pair/instrument analysis or ask any questions in the comment section below.
We will have more FREE forecasts in TradingView soon
Have a Profitable Day
