2025-07-23 - priceactiontds - daily update - nasdaqGood Evening and I hope you are well.
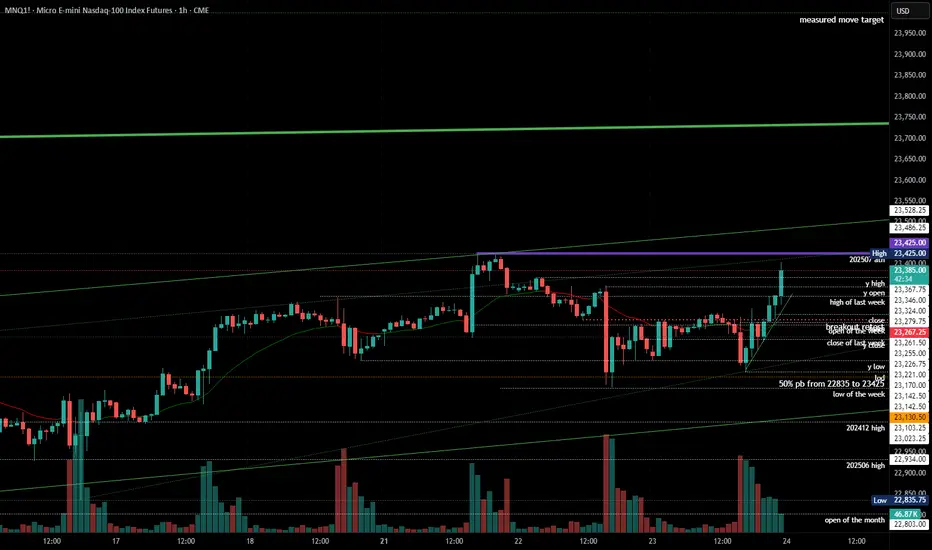
comment: Very tight channel up from 23142 but only 1 bear bar since then and in the absence of bear bars, we can only assume sideways to up movement.
current market cycle: bull trend
key levels: 23000 - 24000
bull case: Bulls want to print more higher highs. We are in this bull channel for the whole July now without breaking it and bulls now confirmed the breakout above 23100ish - 3 times. That is the 50% retracement of the last big leg up and very important. A measured move for this leg gives us 24000. Bears have tried with two decent legs to get down to 23000 and failed. I think many will give up on this after hours buying and we can have more meltup into the weekend. Anything bearish would be a big surprise.
Invalidation is below 23250ish.
bear case: Bears tried and failed again. Everything is bought. 1h close below 23250 would certainly stop the max bullishness but bears are really not doing much. We are almost printing daily new ath. Focus on longing pullbacks until the bull channel is broken.
Invalidation is above 24000.
short term: Bullish on any pullback until it stops working.
medium-long term - Update from 2024-06-29: No change in plans. I expect 20000 to get hit over the next 3 months and maybe 19000 again.
trade of the day: Long 23200 has been profitable since Friday.
Bubble
ETH — Trade Closed! Massive Profit SecuredI’m officially closing my Ethereum position — this trade is now a success story!
I posted right here that ETH was a buy at $2400, then doubled down at $1800. I even echoed the call on Reddit for good measure.
Today, I’m liquidating the entire position with a huge gain. No regrets, just clean execution. 🧠💸
To all the mad lads still holding — good luck and may your conviction be rewarded.
See you next year for the next big swing.
Take your profits, you lunatics! 😄🔥

Ethereum Looks Identical to Early-Day AmazonToday I look at Ethereum versus early-day Amazon and the similarities between the internet bubble and the 2021 crypto bubble. Everyone talks about how the internet bubble popped, but few people talk about what came afterward. There was a strong recovery in the markets, and the internet was mass adopted by the public—along with the technology of home computers.
I believe we are heading into a mass adoption phase for crypto. We've had a bubble-and-pop scenario, and now that major institutions are investing in crypto, we are set up for mass adoption—very similar to what happened with home computing and the internet as a technology. I see Ethereum as being the "Amazon" of this new wave, and Bitcoin as being the "Apple." Big things are coming in these markets.
As always, stay profitable.
– Dalin Anderson

Gold's Surge: Flight to Safety or Foreshadowing Fear?🚨 Gold just saw its largest weekly inflow in history as shown in the chart by BofA Global Research. The metal is soaring above $3,400/oz while most other assets are crashing hard.
This isn't just bullish momentum — it's panic capital. When fear dominates markets, investors rush to safety. And historically, that safety has always been gold.
But here’s the catch: when fear becomes too crowded, even safe havens can become dangerous. If gold fails to hold these levels and begins to correct, it won’t be a slow bleed — it’ll be a free fall, and a lot of people will get caught.
💬 What do you think? Is this just the beginning of gold’s golden age, or are we seeing the early stages of a bubble?

NDX / M2 Double Top? Echoes of the Dot-Com BubbleThis chart compares the NASDAQ 100 (NDX) to the M2 Money Supply, revealing a potentially critical inflection point. The NDX/M2 ratio has reached levels not seen since the dot-com bubble — and now appears to be forming a textbook double top.

TSLA ! You like money? You like money ?We're here to make money! I don't care about politics or idealists. If TSLA makes +20% in the next few weeks, I'll be very happy! End of story. I only do technical analysis. No emotions here.
hedge funds, YOUR pension funds and market makers have to pay themselves! They're buying the dip, while you're watching the stock collapse! Wake the hell up!
Some troll here haha

SPX to dump 30% - 50% for Inflated Expectations in 2026I like to say the narrative follows the price . This was bound to happen after such an overheated year, couple years. Blame whomever you want, in the end its your wallet if you aren't ready to have your expectations met.
Best case scenario, the breakout of macro is confirmed after the retest (blue arrows). Worst, more likely case, it smashes down to confirm a double bottom with a strong foundation to form a macro support. The sawtooth can provide opportunities for volatile scalps, but its gonna get gnarly I can already tell.

Tracking the Bubble PhasesThe amount of hyper speculation in quantum stocks is still mind boggling. I see this tracking a classic bubble pattern where we may start to flip from the "return to normal" phase to a "fear" sell off as we get closer to earnings (early March). Short this back to under $6 from the bull trap.

Corporate earnings Versus SPXCorporate earnings and stock market getting balanced after 50 years weighted to M2 or money supply. We are entering a bubble territory.

Nvidia Wyckoff Distribution- Volume Decreasing
- Reversal Descending Wedge
- Wyckoff Entered Phase E
If this Scenario comes true, AI Bubble will Burst and we will see Market Crash.
Or at least a recession.
Any Upside Move Wil Invalidate This Analysis.

Quantum Bubble Ready to PopRGTI looks like the poster child of irrational exuberance in quantum stocks. New Year Dump incoming after a 1000% in a little over a month and around 2,500% from the 52-week low. No fundamental new sales or orders to back this new increase which is driving the price to sales to all-time highs.
50-60% pullback imminent. scale in.

BITCOIN Why Do you think I am long PUTS ???The chart from an ELLIOT WAVE Perspective I have now completed 5 of 5 or will need one last pop to 109100 But from a position trade the option are to be placed NOW .I am long In the money PUTS the decline that is about occur should be painful for LONGS in 2025 ,happy holidays WAVETIMER Look at the RSI

Gold - The Next Bitcoin?The markets are beyond stretched—they’re squeezed all the way to the moon.
Today, I heard some major news: Big Money has already left the party, and others are following suit. This is HUGE. It’s also that classic moment when the barber starts sharing his “secret” stock tips.
Now, if you pair this with my recent Bitcoin post—where I outlined how a tulip-like crash could unfold—you’ll see we’re staring at the perfect recipe for a stock market KABOOM.
So, where will traders, investors, and even grandmas rush to when this unwinds? My bet: Gold. Where else? This is when the Gold Rocket ignites, replacing Bitcoin and the MAG7, creating yet another bubble—a glittering tulip 5.0. And just like before, it’ll burst when the fuel runs out.
Buckle up! 🚀

High precision version - BTC log trend DEC/JAN PEAKThis is an updated version of my first logarithmic price trend.
This trend is in line with Bitcoin since it first started to trade.
With highly precise curves that better match the cycles, I now expect to see a
peak in BTC price of $90,400 set to hit somewhere between 14th of November and New Year.
I think the trend will be followed even on the downturn,
forming the 'Mother-of-all Head and shoulders patterns'.

2024-11-11 - priceactiontds - daily update - bitcoinGood Evening and I hope you are well.
tl;dr
bitcoin - Max bullish. 100k next. Don’t fight it. I scalp long on strong momentum.
comment: No doubt this will go to 100k. The move is so beyond everything at this point, no one will stop this. I would not be surprised if this hits 100k, to then dip 20-30% in 4-8 weeks after that. For now, don’t fight it and join strong momentum. 4h 20ema has not been touched since Wednesday.
current market cycle: peak euphoria - small pullback bull trend
key levels: 70000 - 100.000
bull case: Bulls want it bad. They will likely get it soon. Any decent dip is bought and we are printing 2-3% 1h bull bars. 4h tf shows 2 clear legs already, third one will likely lead to 100k.
Invalidation is below 80000.
bear case: Any pullback is mostly going sideways and it looks like it’s only bulls taking profits. Can’t be a bear in this. Don’t even try.
Invalidation is above 110.000.
short term: max bullish for 100k
medium-long term - Update from 2024-11-11: 100k and then down to 70000 in 2-4 weeks.
current swing trade: No thank you.
trade of the day: Long anywhere and for any reason.

SPX at Great Depression and Dot-Com Crash LevelsCurrent deviation from long term mathematical model at the top of trend only reached twice in the last 100 years; once during the Great Depression and once during the top of the Dot-Com bubble.
Mathematical model = Ratio of Close to smoothed 300 Week SMA (SMA 10 of SMA 10 of SMA 70 Week Close)

The U.S. Markets are likely to have one last push before....The U.S. markets have been inflated to the point of near exhaustion, propped up by nothing more than a money printer that goes brrr... brrrr... brrrrrrrrrrr. However, this seemingly never-ending run is coming to an end.
Trump will most likely be elected president again. His first term (45) and his second term (47) will likely mark the greatest market crash of all time—the end of the everything bubble! 4 + 5 = 9; 4 + 7 = 11; 9 + 11 = 20. They will likely prop the market up until his administration takes power, then...
Shorting these markets will be the opportunity of a lifetime!
Good luck, and always use a stop loss!

priceactiontds - weekly update - nvidia #6Good day and I hope you are well.
Last time I talked about Nvidia was 2024-07-06 and Nvidia was at 125.8 and my targets were 117 first and later 100. Low was 106.3, so my last post was good for 9$ or 15%. Hope you made some.
comment: My reading from 3 weeks ago was correct but market did another bounce in between to form a nice lower high double top. Yes, double tops can be slightly higher/lower and technically function as a double top. Why do you care if they are not perfect if the market is treating them the same way? The big round number 100 as a target remains and the current tight bear channel is decent enough to get us there. There is always the possibility of the pattern failing and market would break above the bear flag to test the highs again. Given the overall market weakness for the past 2 weeks I expect a bounce more than another strong leg down. Given that the upcoming week will have huge amount of big earnings, I think market will react to those and I am not in the business of forecasting earnings. So how does this information help with structuring a trade from the current price 113? Not much to be honest. Please red below bull/bear case.
current market cycle: Most likely a trading range. The strong climactic bull trend is over and market is most likely in the process for forming a trading range at the highs. The argument that the big bull trend line, currently running at 100 is intact and therefore the bigger bull trend is still ongoing is valid.
key levels: 100 - 140
bull case: Every bull who bought above 120 is underwater and since the ath was at 140, there a probably plenty. Market now dropped below 120 for the third time and if bulls can not strongly close above 120 soon again, they will give up for good buying high and will only buy pullbacks. Earnings end of August can be another surprise upwards but would you bet on another ath? Risky to say the least. Bulls need to keep the current bull gap, down to 96, open or the bull trend for sure is over and the upside around 140 limited, while the downside risk stays the same.
bear case: Last time I wrote again that this stock will half again and the current 26% drop is a pretty good start. That's enough to burn all late bulls and they will not buy high again. That is why my preferred path is a bounce over the next 1-2 days but the bear flag will hold until market touches the 100$ target. If the bull flag breaks convincingly, I am wrong and bulls took control again and will most likely test above 130 again. The measured move target (orange line) is also around the weekly 20ema and the big round number 100. More than enough reasons to test that price.
short term: Leaning slightly bearish but given the amount of earnings next week and that the overall market is due for a bigger bounce, more reasonable is to be neutral until you see strong momentum to either side.
medium-long term: This stock will touch 100$ in 2024 again.
current swing trade: Last time I said on the next weakness I'd short and my target 117 was good but market gave 106. No current position but will look for shorts above 130 again.

a weekly price action market recap and outlook - nvidia #5Good day and I hope you are well.
Last time I talked about Nvidia was 2024-06-08 and Nvidia was at 120.8 and my targets were 130/140. We are after the stock split so it's time for an update.
comment: Please check out my nvidia #4 post, to see how accurate it was. I wrote that once the W5 or third push up is done, we will see a 10-20 bars sideways to down correction. Since the first leg of the correction made 16% down, we can expect a second one, which would bring us to around 100$ (weekly 20ema is also there), which is an obvious magnet. There bulls can decide if they want to continue the bubble.
current market cycle: If we break below 114, we are probably forming a trading range between 100 - 140. If bulls buy this up again, bull trend continues.
key levels: 114 - 140
bull case: Everything as long as most bull trends hold. The big bull trend line is currently around 95 and bulls do not want a pullback that deep. They want this bubble to infinity and staying above the daily 20ema is crucial to do so. If they fail here, we will see 100$ soon. Having said all that again, it's a bubble and it will deflate. Maybe it already started and stock won't trade above 130 again for a long time. No one knows but the probable thing is a pullback to the weekly 20ema/100$ before market wants a retest of the ath. That can fail or even make a higher high before turning again.
Invalidation is below 100.
bear case: Parabolic wedge top broke to the downside but bulls still have 3 more bull trend lines as support. Bears are happy for now that they trapped all the bulls who bought above 130 and most stops will run around 115-118. Bears ultimately want to test the big bull trend line and the 100$ price. Thats a 40% drop and I wrote many times, that this stock will half again. Bears see the recent drop as strong enough for a second leg and the current trading range as a two legged sideways to up correction, which they want to break below from.
Invalidation is above 130.
short term: All bull targets are met and the ath will probably be tested. It's unsure if we get a second leg down first or after the retest. I slightly give it to the bears to push down to at least 117ish since the past days nasdaq & sp500 made new ath's while nvidia held below 130. Trapped bulls who bought above 130 will give up below 119 latest.
medium-long term: Over the next 6 months we should see the 1000 price area again and 6-18 months we most likely will see 800-900 again. --unchanged
current swing trade: Waiting for weakness on Monday and if bulls can't trade it back up, will do long term shorts for 100$.

2024-07-02 - priceactiontds - daily update - nasdaqGood Evening and I hope you are well.
nasdaq e-mini futures
comment: What a bull day… Just straight up buying all the way up. Market did not touch the 15m ema once since 30mins before us open. Happy for everyone who were long since below 19970 and held. Still a lower high but given the strength of today, some follow through is expected.
current market cycle: Max bullishness & peak bubble territory. Literally the peakiest of the peaks. Mother of all bubbles. Will end over the next weeks. —unchanged
key levels: 19700 - 20100
bull case: Bulls want a measured move up from the strong buying today, which could bring this to 20600. Sounds insane but that’s what the chart is showing. First target for the bulls is till to make this a higher high again and for that they need to trade above 20273. If they do that, I don’t think this will be stopped until a much higher ath.
Invalidation is below 20100.
bear case: Not having much for the bears here. They just vanished today since US open. They need to do everything they can to keep this a lower high below 20273 or bulls will make a new ath. IF bears can reverse this, 20000 is the magnet we are oscillating around. I don’t have much fantasy how this market could do another meltup to be honest but price is truth and the chart is screaming “*explicit* your puts” and wants higher.
Invalidation is above 20273.
short term: Max bullish above 20273 for new ath but inner bear in me hopes this reverses again. I don’t have any open positions on this.
medium-long term: This climactic blow off top was the grand finale of this bull trend. Perfect break above multiple patterns which I expect is a bull trap and we will test the various support lines next before the new bear trend will unfold over the next 3-9 months.
current swing trade: None
trade of the day: just buy anywhere around the us open and hold. 15m ema was not touched once.

BTC back to 40k - FUD?Leaving this with almost no description intentionally.
What is the community thinking about it?

#202425 - a weekly price action market recap and outlook - pltrGood evening and I hope you are well.
Let's do some single stock trading ideas. Palantir.
comment: The stock that lives on hopes and dreams of people who know few about IT and much less about data & analytics, much like Snowflake. Go look at the Snowflake chart. When I have read the ipo price in 2020 I told everyone it was a bubble and the stock should trade below 100 for many years until maybe big profits could come in. They are still years away from those big profits and the stock lost 49% from the IPO price. I do not know anyone who works in Data & Analytics and knows Palantir who tells anything positive about them. It's a hype stock that got good publicity because of investors and defense contracts. That stock will trade below 15 in either late 2024 or 2025. Not financial advice.
current market cycle: My dead dog can tell you it's a traingle and that is a form of a trading range and market is in breakout mode. Your job is to wait for the breakout and hop along, that's it. Now set the same alerts as I have and make money once they ring.
key levels: 20 - 27
bull case: Market is getting rejected at the 50% pb from all time low to all time high. That's bearish af. Only chance bulls have for this to trade back up is a weekly close above 27. Bulls have going for them, that there seems to be big passive buying at 20.50. They are also trading above the daily and weekly 20ema, which is also bullish.
Invalidation is below 20.
bear case: Once that buyer at 20.50 gives up, it's free fall. The triangle will probably play out and we see some downside from 23 to 20/21 again in the short term. Last earnings surprised upwards and bulls used that spike as exit liquidity. Tells you something.
Invalidation is above 26.
short term: bearish for trade back down to 20/21. Short term in this case means several weeks, since I'm posting the weekly chart.
medium-long term: I don't know which way the triangle breaks down to but either way, you can clearly see the big lows and highs. One of those will probably get retested before the other. So set the alarms and trade it when it breaks out.
I hope my insrted illustrations help you.

Will BTC repeat its history?When prices begin to range away from the mean when dealing with up trending movements, power is lost in many indicators. When this happens, it usually means that price is currently in a bubble. In contrast to a ticker like the SP:SPX price usually doesn't behave in this manner. It's actually quite easy to understand why this is the case. If one was to make Monte Carlo simulations using a geometric Brownian motion, you would see some processes behave in a manner of a bubble. But if we take the aggregate of all movements and average them, or calculate a present value, the value tends to be around the center.
Well an index does quite the same but through different methods. By aggregating important tickers, they form an average based on different criteria, therefore are more susceptible to following the central limit theorem. Meanwhile, individual stocks, commodities or cryptocurrencies are more susceptible to violent movements which completely ignore technical indicators. This has led me to believe that the more a ticker is dependent on external factors the more it will follow traditional statistical and probabilistic methods. I have no proof for this claim, It's just what I believe based on experience.
When looking at central metric indicators, it's important to conciser there are two point in which these become unreliable. When price action completely ignores your distribution, such as it does here. And when the price is consolidating in the mean. When prices consolidates in the mean, it can be seen as a reset or as a very serious sign something is wrong. However, when minimums become unreliable then that is when one should really be scared, because that means something is seriously wrong. I will look for examples of this for you in the future.
When prices behave in this manner, I don't feel confident making predictions because when a ticker is more susceptible to speculation then price action behaves erratically and patterns become harder to find.
