Tax-cut Euphoria Bubble causes turbulence There was a statistically significant bump-up in the stock market following Trump's presidential victory. (*) In 2017, the positive slope of support clearly increased from long-term under Obama (2009 to 2015) forming the shaded area I'm calling a 'bubble' (not to mention the parabolic slope above it). I expect this was due to anticipation that tax cuts would stimulate the economy. However, the exuberance was excessive, an overestimation, and long-term support is more realistic wrt GDP. I expect the turbulence we've seen since early 2018 reflects the tenuous value of the overestimation and the weight of the long-term trend keeps the bull tethered.
The red star isn't so much a prediction as pointing to the 'attractor' that's pulling the market forward along a turbulent 'flat' trend, trying to guiding it toward on a more realistic track. Tax cuts and deregulation may produce real increased GDP growth, causing the trend will rise higher than the red star. Let's hope! And let's hope things don't fall lower than the star!
(*) archive.is
www.washingtonpost.com
Bubble

Zilliqa - Awesome buy level with min.90% profit pot.There was a time when EVERYBODY talked about Zilliqa. They said it is a coin with the best technology out of all of them. When do you think it was?
Yes, you guessed it - it was during the April when Zilliqa went like 600% up and was one of the biggest gainers of this period. But all coins have ups and downs, even "the best ones" in technology, marketing, idea, or even with the best use case. So did ZIL when in following months we saw dip 90% of the price.
Interesting is, that when the price was at around 0.18, I saw folks posting that they just sold most of their portfolio into Zilliqa, because they found out how valuable their technology is. Were they really interested in technology, or were they just greedy? :)
Anyway, as the dip followed, we can see now a true example of the "bubble scheme". After a steep rise of value, the price goes very quickly back on the levels where the hype started. Usually, it dips even a little bit below the starting price and there is a long period of very low volatility afterwards. Just before the next bullish cycle is prepared to come. Yes, we are now in the low volatility area.
Well, I´d say this chart is not a big brainer. We are copying the bubble scheme, sitting on the strongest support and moving around point of control of the whole history of Zilliqa. During recent weeks there is higher volume too - that suggests we are in the accumulation phase of smart traders. The Stochastic indicator is in a bullish divergence.
For me, there are clear signals of next bullish move coming shortly. I´m not setting a SL here, because for me this is just a buy and hold scenario. I don´t care if we dip 20% lower before as long as I will be able to sell with at least 90-200% profit. This is mid/long term and the outcome is either 0 or double (and more) the investment.
The coin didn´t lose anything from its fundamental value. It only lost price. that means that you are buying "the best technological coin" (whatever that means), just 85% cheaper and on technically great levels. But nobody talks about it anymore, because it´s just not trendy now. But honestly, I am aiming for more than 100%. The area of 0.094-0.105 is the most important level. If we can cross it, it will be huge.
If this analysis helped you, please like it, or even share it with your friends. Zilliqa is valuable and the more people find out that NOW is quite a good entry point, the better.

DXY Short or Long? Whats your take on the Dollar index? We are long and short term short (bearish on both long term and the next week or so)
But may we see another blast up? Do you think the midterm elections will have an affect on this?
Please comment below. Lets discuss!

Amazon is in big trouble as expectedPrevious idea:
Please refer to the update of the 10th of October from this previous TA : bubble parabola broken
Take care

Lumber Futures' Incredible Parabolic RunAlmost always, when something goes parabolic then breaks its trend line, the aftermath is brutal. Bitcoin too. Tulips also. Uranium. Gold. Silver. Oil. Etc.
Know this pattern, and profit from it.
-Ian

Dow Jones + The rest of the worldThese are my views on why the Dow has probably topped out.
All markets tend to follow the US markets which is why a crash in the Dow Jones will likely result in a crash worldwide.
My arguments are presented below:
FA:
- Longest bull market recorded in history
- US debt is worrisome +21B debt (dollar in trouble?)
- Private debt ATH (particularly US student loan debt is worrisome)
- Enormous geopolitical concerns (need I specify?)
- Severe overvaluation of stocks
- Interest rates have been on a steady rise
- US imposing Tariffs
TA (see chart):
-Fibonacci resistance fan is hit every time a major crash has occurred since the crash of 1987 (confluence - see below)
1. Big Volume drop
2. RSI massively overbought (usually happens before crashes, see the downward trend)
3. VIX topped out (usually does before crashes)
This is not financial advice - DYOR
Yours truly //Pman

NASDAQ / D1 : Parabolic risk taking... problems ahead !NOTE : Sorry I misplaced the trump's election in the timeline... Sorry about that little glitch !
Hope this idea will inspire some of you !
Don't forget to hit the like/follow button if you feel like this post deserves it ;)
That's the best way to support me and help pushing this content to other users.
Kindly,
Phil


Biggest WEED Crash Coming We are currently falling from the top of the biggest MJ bubble in history. Given the recent sell-off, my educated prediction is a possible outcome in the next week or so.

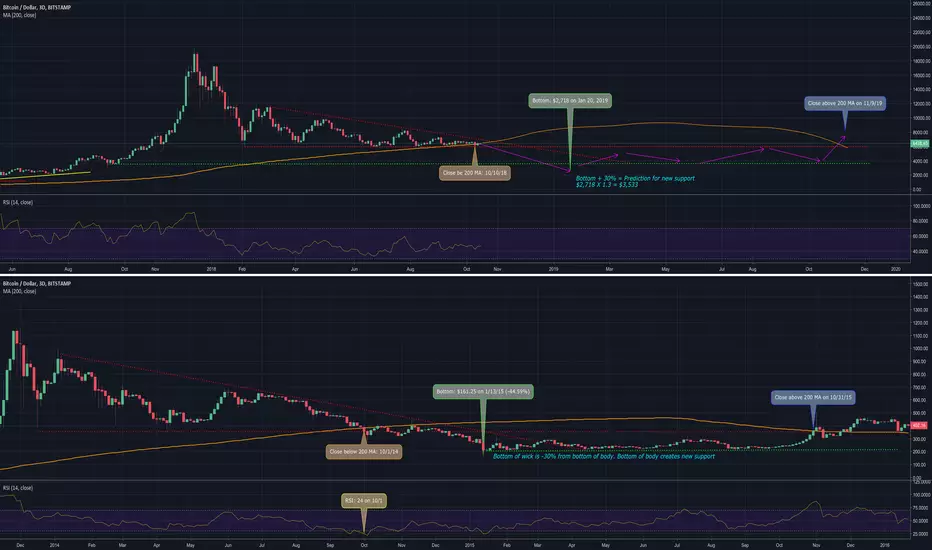
Bitcoin Bubble Comparison - 3 Day ChartOn September 5th I made a similar post comparing the daily chart to the 128 MA. It is much more detailed, however the conclusions didn't change much.
The TL:DR of the previous comparison reads as follows:
Bottom: $2,860 on October, 31st 2018
Range: $3,750 - $5,800 for 8 - 9 months
Breakthrough: $6,100 on June 21, 2019
Because the RSI is not oversold and we are in a tighter coil than last time I expect a faster selloff and therefore a faster rebound. That may or may not mean that the price will go lower, that will depend on support, it does mean that I expect the target to be hit faster than the 1:1 comparison that I did on the chart posted above. There is no way to tell how much faster so I am going to stick with my prediction from the previous bubble comparison, for at least another week.
Only continue from here if you are interested in my subjective view of the fundamentals about the USDT' situation.
I almost always stick with technicals, because I believe that they reign supreme ~99% of the time. I believe that if there is news that will affect the market then it will be seen in the charts before it will be heard in the news ~99% of the time. I think Tether' is a very good example of that, there was a major selloff without the news that I would expect to back it up. There is always FUD' surrounding USDT' about banking relationships, Bitfinex, unbacked Tethers' etc.
However, USDT:USD' has never broke 0.8897 in it's ~18 month history on Kraken and it fell to 0.85 on Saturday night. We have also never seen such a drastic premium on USDT' exchanges when compared to USD exchanges as far as I am aware. To me this represents big money making big moves, which would suggest that insiders know something we don't.
There is a very good chance that I am wrong about that, and I will certainly not be making trades based on loose suspicions. However, I am trying my best to understand the situation and that is what makes most sense to me. Once I feel like I understand the underlying fundamentals of the market then I can get back to doing TA.
I do believe that Tether is single handedly driving the crypto market right now.
The premium remains on the USDT' exchanges and the USDT:USD pair remains in dangerous territory. If it cannot close above historical support of $0.98 in the next couple days then it will be ripe for another selloff. If that does continue to fall then I expect BTC' to moon on USDT' exchanges. This last pump came on Tether losing 14% of it's market cap and 12% of it's USD value (at it's low).
At it's peak, that added 16% to the value of BTC:USD' + BTC:USDT' / 2
Therefore it is clear that a flight to safety from USDT' to BTC' would also cause people to FOMO in with USD. If Tether' were to legitimately go to $0 then there is no telling how high that would pump the price of BTC:USD' or BTC:USDT'. However, once people ran out of USDT' then there would be very few buyers at the inflated prices and a sharp reversal would be expected.
If insiders had information then they already made there moves and now there could be a situation where I put technicals to the side. All TA that I have done would suggest that > $8,500 BTC' would = the next bull market. Before this weekend I would have been very confident in becoming bullish on Bitcoin at a price above $8,500. Now I would hesitate very much to make that same claim unless USDT:USD was ~1:1 on Kraken or unless the price stayed there for a month or two.
I am currently shorting USDT:USD at $0.97. I view this as a very safe trade while waiting to buy back into BTC'. It everything stabilizes then I should be able to breakeven by buying back at support. If not then I have orders set at $0.85 / $0.75 / $0.5 and $0.01 to cover 25% of my position. While waiting for BTC' to figure itself out I think this is a great way to put my sidelined fiat to work.
Buy 110 support maybe and/ or Buy at 85$ rangeIf $110 doesnt hold then "the bubble of everything has popped" And buy at 84$

I really hope this fractal doesn't play out on netflix..We are seeing some early signs of bearish sentiment ... I have said multiple times in the past if we get some type of correction in stocks it will be because of overvalued tech stocks such as google amazon Netflix nvidia and many others..
I am not trying to call a top here! we still need to make more lower lows to confirm the trend but we are getting early signs of bad structure similar to the way the internet bubble was topping out .
the spx could have a trend line failure and do a ABC or go for more legs up so we are just watching those levels
But yeah I don't want this to happen cause it would mean lots of people loose money but also I feel I need to post warnings to watch for lower low patterns and more weakness so you don't get exposed to a 40% drop or something crazy like that.
remember there are lots of kids Netflix and chilling these days but you can also still use torrents and hulu
Stay safe and stay profitable out there.

BTCUSD - Bubble comparison and 2011 to present trendlinesA couple of things have bothered me looking at historical trends.
One is that the 2014 crash was much more chaotic. I've tried to display my interpretation of that here.
Also, the longest logarithmic graph is curved: bitcoin.zorinaq.com
This curve has not been perfectly circular and has been flattening out progressively, nonetheless this is an argument for a possibly more bearish scenario than possible here

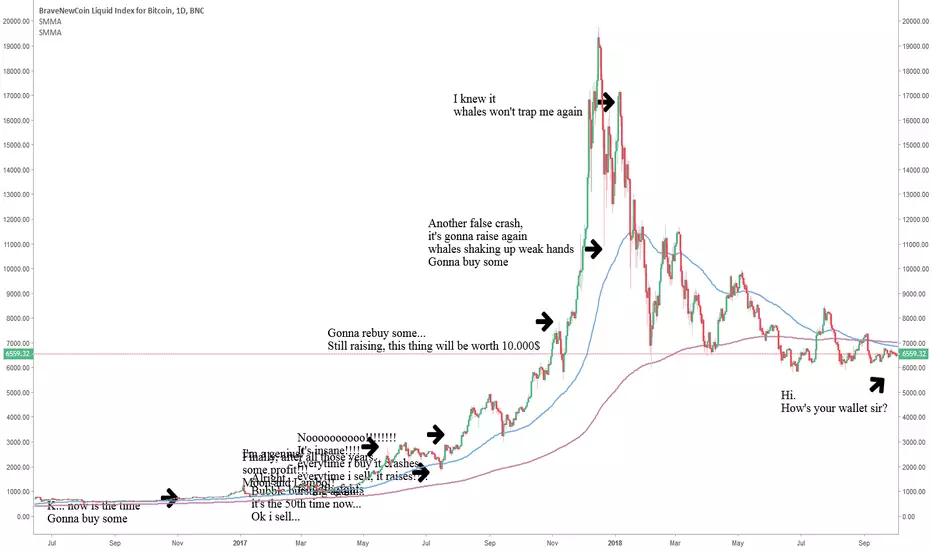
"All those dudes who bought early are so lucky, must be rich ""Omg, all those early investor traders must have made shit loads of moneizzz. Was so easy, you just buy some, and wait, it was raising all the time, any dumb dude would have been a millionaire!!"
No.
=>
pop goes the bubble.i checked this on the 6 monthly as well and boy it looks parabolic as hell.
This is the monthly chart though.
The signal is clear as bloody day for me.
Finally my monthly indicators are literally ALL in unison.
Simple bearish divergence on the RSI.
Simple bearish divergence on the fast oscillator and collapsing close to the zero line - scary.
Simple bearish divergence on the slow oscillator.
Simple bearish divergence on the histograms on both fast and slow oscillators.
It's as if the stars are lining up.
I don't know about you.
But I'm GTFO stocks rn.
Come back in when poop hits the fan.

BTCUSD - Bubble comparisons, 365day MA, and volume flowBTCUSD - Bubble comparisons, Yearly MA, and volume flow. The current lack of volume isn't saying much for a December moon.
This tightening wedge seems very ominous. Also very unpredictable where it's going to go. Bullish on 2020, but for now, the price changes might not be as interesting as one might hope

Dollar Index Ready to go to New HighsFundamentally , within the context of the current currency crisis experienced by emerging market economies, the dollar index is set to go to new highs in the upcoming weeks. Capital flights from weaker economies will pump into the dollar. This should have a strong effect on the valuation of the most important currency in the world. Turkey, Iran, Venezuela, Russia, Argentina and Brasil are perfect examples of the weakening of these market economies. For more information about these, please refer to: www.youtube.com .
Technically , the DXY is set to achieve new highs around 101.84 points. This is a FIB level of 0.618 phi in the overall chart.
We can see in this 4H timeframe chart a:
1. Descending Channel (red) after entering the 0.5 phi level between the 0 - 1 FIB level.
2. Consolidation/accumulation within the reversal triangle (blue) that pumped upwards.
3. An Inversed Head & Shoulders pattern that should pump upwards as soon as the DXY manages to break through the base of the pattern.
Now, taking a look at the 1D timeframe chart, we can see the following technicals:
1. A massive Bullish Bat Harmonic Pattern.
2. A massive Megaphone Pattern.
3. A Falling Wedge pattern with the confirmed breakout.
3. A bear trap formed after the rejection of the 0.382 phi and the failed dumped of the megaphone pattern.
This technical structure in the 1D timeframe fits and confirms the upcoming rise prediction of the 4H timeframe chart.
Finally, looking at the 1W timeframe, we can see that the Triangle Reversal Accumulation Pattern the dollar had for about ten years, between 2004 until 2014, fundamentally coincides with the time the emerging markets got into US debt by accessing cheap credit fostered by the IMF among other international entities and institutions.
P.S.: Considering cryptocurrencies are within a Bear Market, I am going to actively start posting charts about Forex, Indexes, Commodities and a Stock Bubble that I see forming in a country in the Americas. Follow me and like my idea to access this content!

BTC: bubble/recovery analysis from an engineers point of view
Hello everyone,
First of all, thank you for reading. I tried my best to articulate my thoughts as well as possible.
I would love to discuss this analysis with you, whether you are in favour or very much against my line of thinking.
I am here to learn and make money, but first you have to learn in order to make money - and learning is best done by explaining your thoughts and reasoning to other people.
Finally, please keep in mind that this is an engineers point of view, which tends to be exact.
My analysis does not take into account factors like massive manipulation or the dumping of 100k BTC from MtGox/Silk Road, or other situations like this.
Thank you and good luck with trading,
Nick.


TLRY - 09/19Set to open around the $200 mark? Not calling this the top, but sure we are pretty close to the top!
We all know how this ends? #Crypto $DRYS

Bitcoin bubbleYes bitcoin did go on a tear last year and has had a tough 2018 thus far. Expand your timeframe and see this for what it is... the investment opportunity of a lifetime. Buy spot and stay away from high margin scammers...

AAPL - Bubble Waiting to Pop (or already popped?)Looks like AMZN which looks like Bitcoin which looks like every other bubble in history. Parabolic moves do not end well.

CRON notesWatching it on two hour chart seems like today's action was centered around where it close up at around. Trend is still up as it broke up out of an ascending triangle on the weekly chart. I still think pot stocks are in a bubble and they will continue to go higher in price. For options traders it has already breached it's expected move for the week, with the top being 11.19 for the week. Could be pulled back to that area or we are looking at a 3 sigma move
