SPXL - End of the Bubble!After a long positive run full of speculation and non-ending green days, the time has come for stocks to go back to their real values.
Bubble

TESLA in 2020 vs APPLE in 2000, what if..I tried to compare the 2020 Telsa bull run vs apple during the dot com crisis
what if we are in an EV bubble that is comparable to the dot bubble?
could we predict how it will go this time?
as we saw in 2000, the internet was intended to become a great thing, but not yet.
what if the EV is intended to become a great thing, but not today? maybe in 20 years from now?
I suggest you look for other stocks related to EV, green energy, and all the trendis right now, and by comparing those with the FAANG in the dot com bubble.

SP500 Forecast for MAYCrash is just around the corner in my opinion. I am loading up on shorts and will add to the position as we start to drop.
Short bias Ninja's! :)

90 % crash coming soonI'm not going into details, but this is my final warning. Why do I think it will go so low? Because when you zoom out and see the weekly chart it's just one straight line. Pullbacks are only seen on lower time frames. It will break 200 weekly MA because it never did n history and this will be a final collapse of crypto where only the strongest coins will survive. Very similar to Dot com bubble in 2000. I'm expecting comments like: "what a moron", "shit TA" and another 10k replies from Tadouh telling me how much of a shit trader I am. Who is Tadouh? Just another guy from tradingview who missed buying the bottom and is now spreading negativity on anyone who is currently bearish.

Shorting the ETH if it go below up trend lineThis have been a bullish week, and ETH ATH is in the making again and again. It is approaching 3000USD too.
My idea is actually come from the GPU price and it is currently extremely out of stock in the part of the Asia (Singapore and the rest).
Which totally like 2017, when everyone tryin to set up their mining with GPU and with newest Nvidia product.
Hence, the crash could come soon.
If I am right, just as it crash downward crossing the up trendline to confirm the crash, we can easily catch the support in the last uptrend line as in the chart.
Cheers, happy trading.


Comparing Tesla to Nasdaq 2000 Bubble TopTesla is a good short here between 730 - 780..... It is acting exactly like the Nasdaq 2000 Bubble Top


RED HOT! When is the housing market going to crash?I didn't say that this post is 'red hot'. And I don't know if or when the housing market is going to crash. The captioned question in a popular search engine rose 2,450% in the past month! That must be super red hot! What's the RSI on that? 😄😂 Expand the chart by pressing the + icon, for a clearer view.
There is extreme chatter in the blogosphere about housing bubbles and crashes. Some want to understand why all the interest in that. After all if something doesn't make sense what's the point of paying any further interest. Oh - except if it's US Equities and Bitcoin - right? I get it - some see sense in Bitcoin and Stock indices going north so they're ploughing their money into those two. The 'sense' is ' The FED has my back.. I'll hedge against a crashing US Dollar! '. That's all people know - I'm often told. Has the FED got your back on the price of your house? I don't think so. But I could be wrong. I'm actually wrong about 60% of the time. And nothing here is advice, anyway. So nothing I say seeks your belief.
Ahhh.. so what's that crazy spike in searches on the question? Could some be worried? Oh yes the 'some' are probably those who made a killing; now looking for signs of a true peak, to dump on those looking to buy into a superheated market. They're in the search engines checking out carefully for news and early signs of a reversal. Some are nervously watching for potential rises in interest rates and hyper-inflation. Those sort of folk probably know little about technical and fundamental analysis.
Is there a peak as yet in the housing market? Nobody can know because there is no dip and no double top at the leading edge, to define the peak (as yet). That means it can still go far more north - to dah Moon, for example. 😉🤐
So for those who need to understand what's going on with house prices, I speculate the following:
1. The parabolic end of the curve up suggests to me this is a stampede of competitiveness among many who think that all bearish sentiment in the economy has been crushed. These are not the likely to be a large proportion of the people searching madly the captioned question.
2. People with cheap credit have jumped on a bandwagon, thinking perhaps " A new dawn is ahead..we've beaten the virus. We have vaccines. Time to git going! Things can only get better. " You know the song?
3. Some believe that the rise in equities plus virtually unlimited monetary and fiscal stimulus means ' They've saved the economy. '
4. Housing property prices took a leap because there was more demand for homes in the pandemic period. But that's not the only reason. Anyway the initial pump got the bull market going. Then came the stampede with some false peaks as jitters set in for shorter periods. I'm not a housing sector analyst.
Now compare what happened in the CONSTRUCTION, PROPERTY & REAL ESTATE INDEX (chart below). Hmmm.. construction? Yeah.. that's nothing to do with housing - right? Think harder. Sound traders and investors know that the best moves they can make in any market involves 90% of their time spent thinking!
Is the housing market in the US a bubble? You and I won't know until after the sound of a POP!
If you have other ideas, do share. Let's get that discussion going.
Disclaimers : This is not advice or encouragement to trade securities or any asset class. This is not investment advice. Chart positions shown are not suggestions and not intended to assure you of an advantage. No predictions and no guarantees are supplied or implied. The author trades mostly trend following set ups which has a low win rate of approximately 40%. Heavy losses can be expected if trading live accounts or investing in any asset class. Any previous advantageous performance shown in other scenarios, is not indicative of future performance. If you make decisions based on opinion expressed here or on my profile and you lose your money, kindly sue yourself.

TSLA - THE TOP IS IN? | CORRECTION OVER? CRASH PENDING?An update on my previous TSLA forecast (linked below).
Price hit the 61.8% fibonacci as expected and retraced upwards, again as expected.
It has now hit serious resistance and formed an A-B-C correction pattern.
The way the chart is setup with price action, stochastic and RSI, there is valid reason to believe we have just corrected after selling off deeply in the past few weeks
I expect a downwards continuation to break down further past $550 and towards the $400-$500 range
The EV bubble may still have further room to drop before resuming it's takeover

LGIH Pullback?LGIH has been on a great run over the past 2 weeks. I love this company in the long term, but I see a shorter term pullback coming as soon as next week simply because it has had 11 consecutive green candles on the daily, and the there is now a divergence in the current trend and the daily volume. I'm betting on a fall to at least $120 before April. BUT Only Time Will Tell


Next bubble popEach time that the cost of money increments, the bubble of the moment pops.
If you check carefully, the parallel channel's upper bands (yellow ones) play the trend resistance role. If those bands are touched, I can reasonably assure that the FED will intervene in the bond market with Yield Curve Control (you don't want to have the biggest economy of the world be insolvent). The intensity of their intervention will depend on the slope of the recent spike.
If the previous description occurs, the only indicator left that we will have for checking the debt market's actual economic reality is the 30-year yield. It is highly improbable that the central banks intervene those yields due to the distance in the final payment.
Any thoughts or opinions are more than welcome.


Nostradamus 101: XRP/EUR 2 weeks aheadLet me start by saying that this is not financial advice.
For all my peoples out there, we are amidst a great crypto correction (generally speaking),
in spite of alt season buying power is weak, weaker than what we expected.
Now the next 2 weeks we will see those institutional candles, don't be scared, just know
when is the ultimate time to enter. You're welcome.


Crypto currency: "The Digital Tulip"?📌 During the last five months, the price of Bitcoin increased more than five times - from $10,000 to over $60,000 while the global crypto currency market capitalization topped $1.7 trillion. When it comes to traditional assets, such a rapid rise in the value of an asset typically indicates the emergence of a financial bubble. But, what about crypto currencies?
📌 Against the tsunami of crypto currencies' market capitalization increase, financial bubbles of the past look like small and mid-size waves, historically adding 40 to 440 percent to the asset value. The value of global crypto currency markets increased almost 900% from March 2020 to today.
📌 When do bubbles usually reach their peaks? In looking at past bubbles, the longest time period is four years with an elongated period experienced by the real assets markets. If the crypto currency bubble is compared with digital asset bubbles, like the Dotcom and Biotech bubbles, it may peak 13-21 months after the bubble started to blow or between March and December 2021.
Is this time different? Super-easy monetary policy and expansionary fiscal policies in the US and around the world coupled with the accessibility of financial instruments and stock exchanges for a wide range of non-professional investors may make this "digital tulip" bubble different than bubbles of the past. These factors make it more difficult to predict how much the peak value of Bitcoin and other crypto currencies can exceed their fundamental price levels defined by the cost of coin mining and infrastructure maintenance.
We are expecting a Bubble crash in Crypto Market..💭
What's your views and Thoughts 💭 Please feel free to describe below.

TSLA returning to old channelGreen line are when the tech bubble occurred. I assume that the institutional investors have rotated into different sectors away from tech and re-entry will be support of the original channel before breakout, with support being 550. Anything below 550 I will see as overselling and the best buy range for long term positions. Not financial advice, just my take.

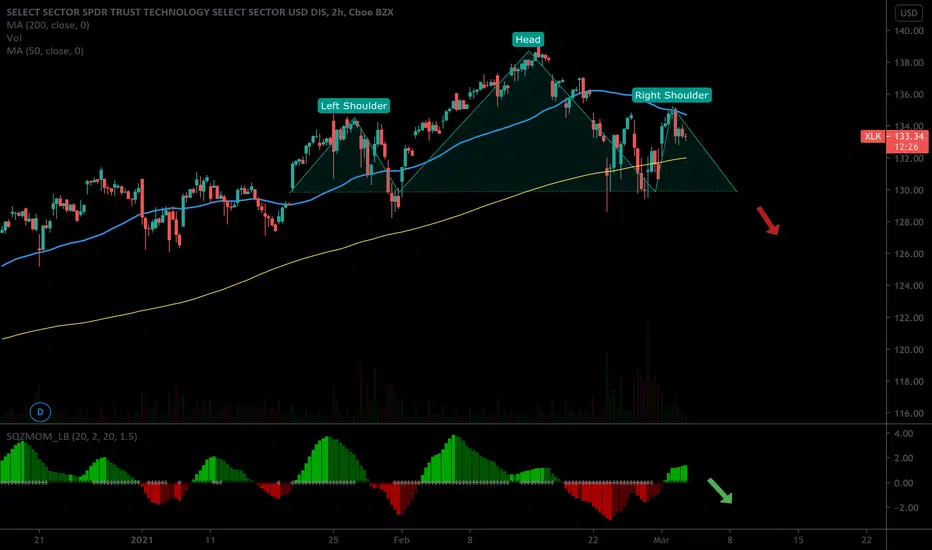
Head & Shoulders Pattern on XLKIt appears a head-and-shoulders pattern is beginning to form on the XLK. If the right shoulder fully forms, look out below!