AUDJPYAffter break and make a full retest at the trend line Im expecting the price at least to reach 60 pips today!
Market in general is very consolidating this days. Better small pips or hold for days with proper risk in many pairs
Bulish

GBPCHFThe price came touch the support zone and made a clear reversal. Right now we are at some very small resistance line but eventually the price will break for the up side.
Has Confirmation we have this 2 rejection candlesticks. (the new one is not closed yet 📈)


#KyberNetwork $KNC #DeFi Just Getting Started
Weekly
Looking at our highest timeframe (trend timeframe) we can see Kyber Network has been in a major downtrend and has actually never been in a bull market...I consider this something interesting in a positive way. Look at the most recent price action starting from November 2019 we can see price action found support at $0.15 after testing multiple times for about 3 months until breaking to the upside. Higher high was formed at $0.82 followed by a higher low at $0.45. Price action then decided to form an ascending triangle followed by a breakout and now looking to form a new higher high. Stochastic RSI showing momentum is heavily in favor of the bulls with no signs of slowing down, resistance at $1.35 and support at $1.04
Daily
Shifting over to our pattern timeframe we get a better picture of the ascending triangle breakout and can see a symmetrical triangle has formed on the smaller timeframe also leading to another breakout to the upside. Price action now looking to rest $1.35 resistance, stochastic rsi showing bearish momentum has bottomed out and we should expect another push towards the upside. A daily close above $1.25 is a good sign we continue.
4Hour
Lastly shifting over to our trigger timeframe we can see price action has formed a higher high at $1.27 followed by a higher low at $1.24. A 4hour close above our most recent higher high activates trade and we should see a higher high form near our $1.35 resistance. Stochastic RSI showing bullish momentum has also formed a higher low and bulls are reloading for the 2nd wave. I wonder what price action will be when we are in a bull market...

CEMI Tripple bottom CEMI testing the tripple bottom arround the $3.55 mark. Bullish pattern indicater , Needs to break past the 3 resistance points marked on the chart , 3.80 being the first. If the 3.55 fails we could drop down to the $3.30 support line.
Anything under 3.70 looks like a good entry point to me. Looking at the fundamentals the company is undervalued and currently oversold .
Potential catalyst would be getting the emergancy FDA approval back, this could see it move to $8+ rapidy.

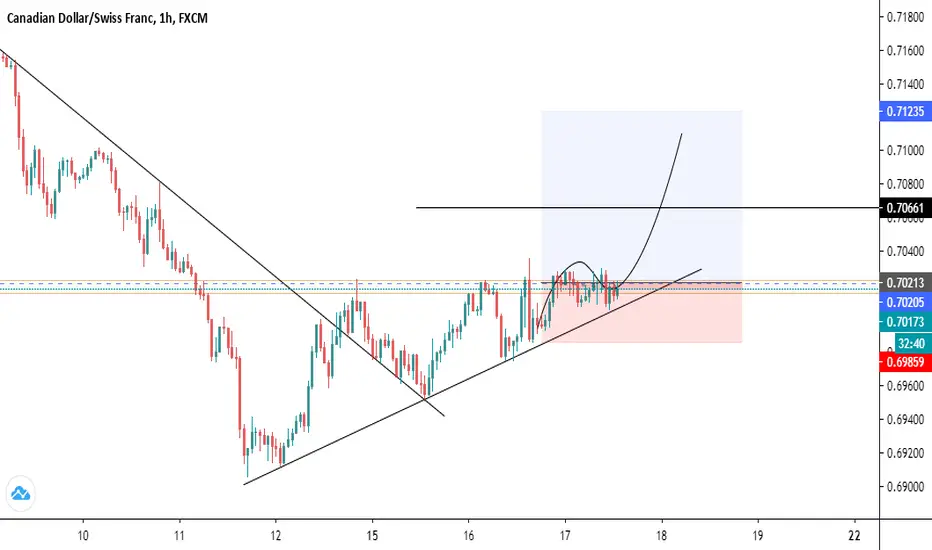


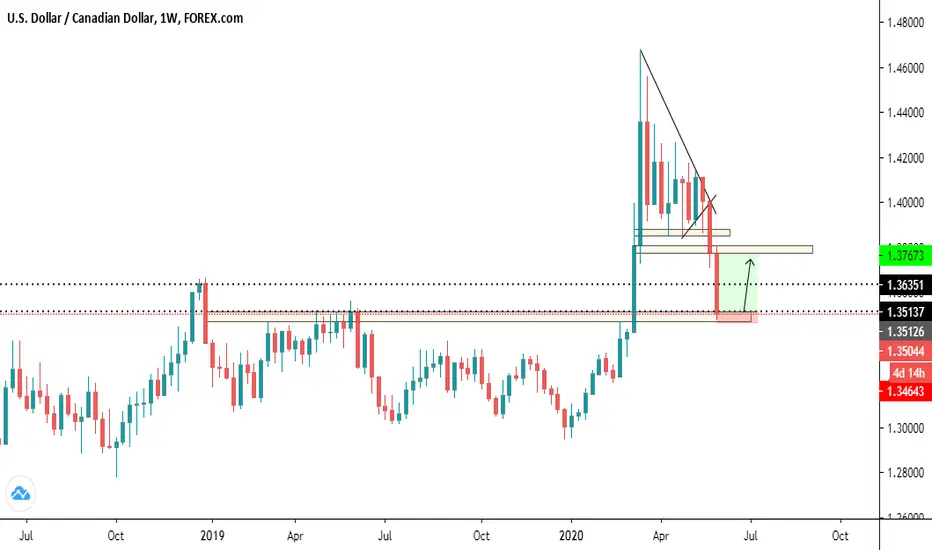
USDCAD
Im expecting the price to start going up from now, affter last week falling.
The price just break this trend line and is retesting now,
We have a strong rejection from the higher time frames and also a visible double bottom 📈 🙏⏳

CHFJPY UPDATEAgain, for better entry is better affter breakout.
We can see a lot of important lines here. We can see this has a wedge pattern and the retest.
Im expecting the price to go up after 2 days very slow. If we check at daily Time Frame we are having a good rejection from the down side.


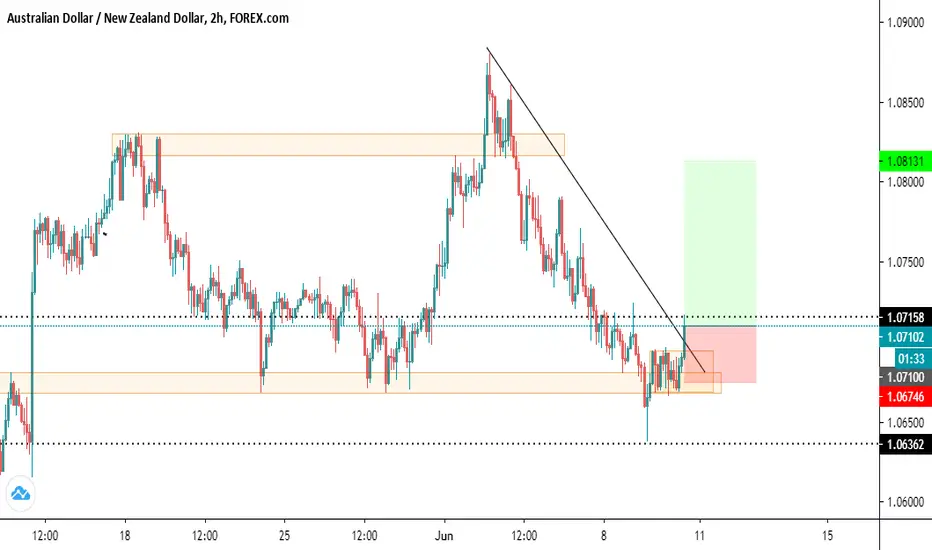
AUDNZD UpdateMy last analysis of this pair was wrong. Affter check it better I could see how strong was this demand zone. We got a breakout of the trend line, for now I can expect the price to rise at least till @ 1.08131
GBPAUDWe have a perfect market structure here and its expected to rise at least almost safe 200 pips

CHFJPYWe got a similar long term retest like eurusd and the market structure says that must go up. Now we got break of this small line and affter retest it will bea possible good buy oportunity.

EURJPYThis same time at 1h,2h, 4h candle closure may say a lot about the next direction of this pair for today.
Im not expecting a breakout for the continuation of the bulish moment, but we never know. Only time and confirmations will say.
There is some of my lines that i think must be accurate for this situation.

USDCHFVery clear setup here we are having a good week to sell pairs against CHF.
And I think will still good next week.
XXX/CHF = Down

EURCADThe price is trying to get out from the demand zone, i can expect it to go at least till this midle zone today

AUDUSD UPDATE second optionAlso the AUDUSD depending on how the market open we can have a clear vision of what will happen this week.
Pairs against USD can have this break option and the rising till the next supply zone this week.
We are in a very strong bulish moment and its hard to see the price falling so easy this week in my point of view of the higher time frames

EURUSD UPDATE Second OptionThe price at weekly time frame is very bulish, so if the first hours affter the market opening insist in break this supply zone, then we can see the price up this week till the next strong supply zone.

EURNZDAffter break the resistance we got friday a clear retest here, we can have a very good week buy on this pair

GBP/USD TO BUY IN THE COMING PERIOD90% buy signal
the shade on the last candle and its bullish so its a confirmation for our buy
mustapha harchi

AUDJPYIf this get a retest confirmation will be a good buy oportunity.
The price broke this resistance and im expecting to reach the next level.
