Bulldiv
Incoming small pumpo??Took up a long here, 4hr BB squeeze, MACD cross, bull div, targeting the 786 from the double top down to the deep swing low. Simple set up, hopefully pans out.
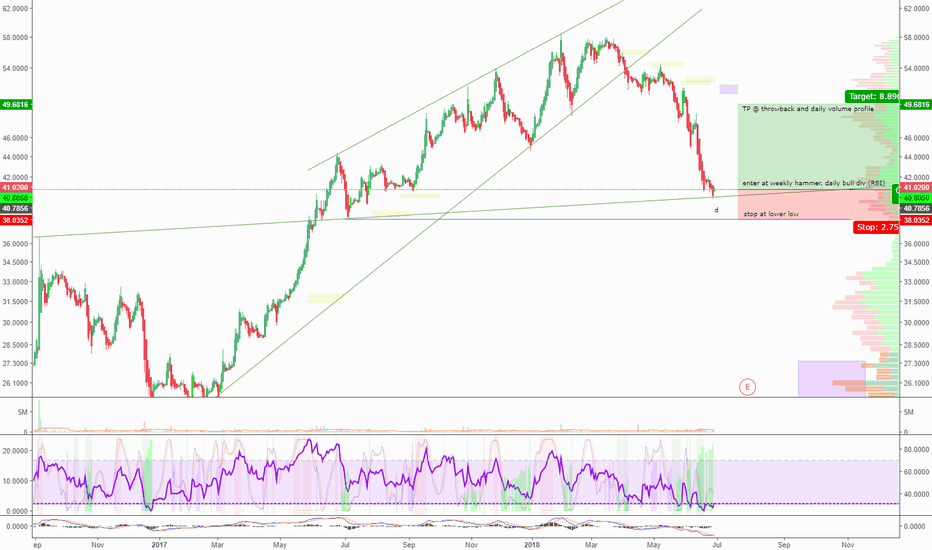
PIVX buy on 2 part bull div after 85% pullback from ATH2 part bull div on daily RSI shows us a buy opportunity on PIVX. PIVX is a good alt-coin, way down from ath just like the others. Several altcoins have set up like this right now so there are other buying opportunity on the crypto space.
Unlike other coins, PIVX has good fundementals: a devteam still making releases and active on github, and a good use case: PIVX fixes fungibility problems that bitcoin has. It is basically a competitor to XMR (Monero). XMR is one of the main altcoins and the only altcoin aside from BTC that is used regularly for real transactions because it is popular on the dark net markets. The dark net market is fickle and could easily switch to PIVX when the clear benefits of PIVX are seen.
Bullish Divergence on Bitcoin Daily RSIBullish divergence on the daily RSI confirmed 20 minutes ago:
Here is a cheat sheet on divergence: i.imgur.com
Here is a historical look at daily divergence since we reached ATH 6 months ago: As you can see, they all played out at least for the short term giving bulls some relief.
Point and Figure Chart i.imgur.com Yesterday we confirmed a column of 14 O's. Just now we confirmed a column of 6 X's, retracing yesterday's long pole. A pullback to $4,499 would complete unresolved long pole dating back over 8 months ago and is our next likely long-term target. Short term, we have a recent unresolved long pole of 16 O's from 6/10, a move above 7,040 would resolve 50% of the pole.
Here is a look at Major trendlines since bull market ended. Right now we are in the green channel down. Relief if we break out up or max pain if we break down. Part of me wishes we could break down because we would probably get a good strong bounce off the 4k range. But following today's bull div we will probably edge up out of the channel and resolve our most recent long pole by reaching 7,040.
Third Time's a Charm - Divergence StudyA quick study composed to illustrate the multiple levels of divergence Ethereum has had since November of last year.
Based on this study, short term trend changes typically took place at the second level of divergence on the Relative Momentum Range Indicator . The only other acceptation for this, was the reversal from the top this last January. At that time, was so much upward momentum in the market that it took until the third signal of divergence to confirm a trend change.
Some of you will say that this happens all the time, which is true. However this typically occurs on lower timeframes. Typically the higher the timeframe, the higher the chance of a divergence signal to lead into a confirmation.
Looking at where we are now, we once again have a potential third attempt of bullish divergence forming on the daily chart.
By no means is this a signal to buy.. The crpyto market as a whole is going through an extremely bearish cycle at the moment.
However, looking closer at the chart you will see that we have potential trendline support around $420. I believe that if we hit this, the divergence line will still be in tack and we could see a potential bounce.
For those of you that follow me, you likely notice that this still follows my ETH Fractal idea. I want to note that this fractal still remains a possibility until a lower lower is formed. Some may say it is foolish to remain optimistic in such a bearish trend. You very well may be right.
I hope you all found this analysis a bit interesting and I wish you all the best of luck!
ETH Fractal Analysis:
CVS long following bottoming out, monthly bullish divergenceCVS has formed a descending triangle and daily appears to be closing above the upper triangle (break out). We have a monthly bull div on the RSI. A forming daily wedge will provide good stop for our trade. R:R lies in longing at break out confirmation.
WMT Daily Bull Div Presents Buy OpportuntiyWMT bull div presents buying opportunity. WMT is 25% below all time high, a pullback that has occured with little or no upward mean reversion. Following our MACD and RSI bull div on the daily I expect to see some upward mean reversion here. A tight stop presents itself below local lows where there is very little volume. Target is 23% FIB/daily volume profile node OR just hold it forever since WMT is pretty safe stock.
QSP Solid BuyQSP still reacting well to its channel a little RSI bull div. made it reverse shot term trend, might be looking for the height of the channel as a target (around 3k sat rn)
bitcoin my guessthis is just for fun, not financial advice, i dont like to trade based on future predictions, better to trade what i see, let'see.
we will dump until daily close and bounce (when asia wake up), creating a lower low, and head, rsi will bounce creating a highler low = bull div - price will go up until europe wakes up then dip until usa wakes up tomorrow creating a shoulder.
Bullish divergence on the 1h chartHi guys!
On the 1h chart i noticed some bull div while looking at the RSI and the chart.
Higher Lows on RSI & Lower Highs on chart = bullish divergence
This means we could see an upward movement within the next couple of hours.
I post daily charts on Twitter @misssbitcoin
I'm on YouTube as well! MisssBitcoin
Good luck trading guys!
Hugs,
Maddie


