EGLDUSDT is creating another bullflagThe price created a triple bottom on the 129$ area on the daily timeframe and after the breakout from the weekly resistance (164$ the price had a nice bullish impulse until the daily resistance on 200$
The market is testing the static and the dynamic resistance on that level and non the 4h timeframe the price is creating a bull flag as well
How to approach?
Th price needs to create a new breakout from the bullflag and static resistance on 203$ and the market needs to satisfy our rules before new long position. According to Plancton's strategy , we can set a nice order
–––––
Keep in mind.
🟣 Purple structure -> Monthly structure.
🔴 Red structure -> Weekly structure.
🔵 Blue structure -> Daily structure.
🟡 Yellow structure -> 4h structure.
–––––
Follow the Shrimp 🦐
Bullflagpattern

BTC formed Bull Flag on 1H with potential breakdown to 50-51KFriends,
I would like to share with you my trading idea - a potential bull flag with a breakdown of 50-51K. Let's consider the following factors except for the classic bull pattern we observe.
1. After the last breakdown and ranging trading volume has significantly decreased which means power accumulation.
2. Meanwhile Volume Profile shows that the accumulation at 47100 during the current range was significant compared to the past accumulation at 41000
3. Reaction on 50MA: in the past, we observed how the price impulsively breakdown 50MA after testing it from the bottom.
Last but not least, RSI and Stochastic oscillators are cool off enough for the next move up.
This month I've already successfully predicted another bull flag which had played out perfectly, please check the related idea below.

AXSUSDT is creating a bull flagthe market tested the weekly resistance on 72$ after a nice breakout on the dynamic daily resistance.
On the 4h timeframe the price is creating a bullflag below it, and the price could retest again the weekly support on 61.60$
At the moment the price is suffering about the hack.
Axie Infinity (AXS), the native token of the eponymous videogame, reversed most of its recent rally after hackers stole more than $600 million from the Ronin Network blockchain that runs the game. RON, the native token on the blockchain, also slumped in value.
How to approach?
The price needs the breakout from the bullflag on the 4h timeframe, we could see a retest on the 0.618 Fibonacci level where the market has the weekly support. SO if the price is going to have a breakout from the bullflag, According to Plancton's strategy , we can set a nice order
–––––
Keep in mind.
🟣 Purple structure -> Monthly structure.
🔴 Red structure -> Weekly structure.
🔵 Blue structure -> Daily structure.
🟡 Yellow structure -> 4h structure.
–––––
Follow the Shrimp 🦐

LRC retesting!Look like small bull flag printing, at the same time retesting the previous resistance zone. 30m chart looks bullish, 1 and 2H could turn up also. Anyway, the safest is to behave like its just a scalp trade, that will do no harm.
SL is A MUST. BTC bulls are not so happy since it printed lower high on 1H chart, I recommend watching BTC PA if in any trade... This is just an update of the previous chart, the link is below.
Good luck traders and if you would like to help me just smash that thumbs up button.
Thanks

SAND/USDT BULL FLAG BREAKOUT! READY TO GO $40....Hello everyone, if you like the idea, do not forget to support with a like and follow.
Welcome to this SAND/USDT TRADE setup. SAND looks good here.
SAND is breaking out from the bull flag like structure in 2D time frame. The height of the pole of flag is around 1000% so I'm expecting a 100)% growth in SAND in next 3-4 months.
Previously when Sand breaks out from the same bull flag like structure it pumped almost 3000% so this time 1000% is not a big target.
Buy this one and hold it for few months.
Invalidation level:- If any 2days candle closes below $2.7 then I'll exit manually.
What do you think about this?
Do you think SAND can test $40 mark?
Or you think it's not possible?
Share your ideas in the comment section.
If you like this idea then do support it with like and follow.
Thank You!

AMD went nuts! Whats next???AMD was going crazy today. What will happen next? I think AMD is bullish forming a bull flag. Excited to see how it plays out.

Bull Flag formation for the DXYHello Friends!
The DXY has been on a great run. Looks like it’s trading in a pennant from a bull flag formation. Move to the upside might create a new high for the DXY.
As always thanks for your follows, likes, and comments. Let’s learn and grow together. Cheers!
*This information and publication is not meant to be, and do not constitute, financial, investment, trading, or other types of advice. Do your own research.

KRN: BULL FLAG BREAK OUT KRN (Karnalyte Resources)
Agriculture and fertilisers are hot industries now.
The chart is really overbought but I like this bull flag and will be looking for a break out of the flag for a short term trade.
If the pattern is confirmed, 1st target is 1.36, 2nd target is 2.17/2.34
Initial stop loss at 0.93, then raise it accordingly.
Trade safe!

BCE Is taking off againBCE has shown moderate growth, but recently price has broken out of this large bullflag that has formed
Growth is about to increase a lot, this is a great entry point
The 200MA is always just roughly below price when it shoots up

solana gonna reach 96 $as we can see there is an obvious double bottom and there is a green candle gonna escape from the current HVN (high volume nodes) to reach the point of control of the volume profile, and if the it's gonna break the resistance line so the goal will be 96$


This idea is holding up surprisingly well.I made this chart months ago with a massive flag being printed on the macro scale. This is show on the daily here but is better viewed on the weekly. If this continues to hold up, we could see a major rally, heading into q2. IMO

XRPUSDT is creating a bullflag 🦐the price got a rejection from the monthly resistance on 0.91$ after a bullish impulse.
After that, the price created a bullflag above the daily resistance on 0.70$ where the price retested the 0.618 Fibonacci level
On 4h Timeframe, the price is in the accumulation Phase below the monthly resistance on 0.77$
how to approach?
I'm monitoring the price, I'd like to see a clear breakout from the bullflag.
After the breakout I could see a rejection from the 0.78$, it's a monthly one.
If the price is going to have a breakout of it and satisfy my rules, I can Open a new long position with a very nice risk reward.
––––
Keep in mind.
🟣 Purple structure -> Monthly structure.
🔴 Red structure -> Weekly structure.
🔵 Blue structure -> Daily structure.
🟡 Yellow structure -> 4h structure.

LUNA bull flagLuna has bounced well from EMA 200 and trading above all the important MAs.
On H4 Luna is making both bull flag and falling wedge once a clear breakout means we are going for $100 or making an ATH.

LUNAUSDT is testing the 80$The price had a breakout from the descending channel from the daily timeframe and now the market is testing the 80$ as new resistance.
On the 4h timeframe the price is creating a W pattern and we could see a retest of its neckline around 0.5 - 0.618 Fibonacci level before the new bullish impulse.
How to approach?
We are monitoring the price, if the market is going to have a clear breakout from the 80$ resistance and flip into new support, we can apply our rules for a new long position.
If the price is going to have a retracement until 0.5 - 0.618 Fibonacci level, we can wait for a bounce a look for a new long position.
–––––
Follow the Shrimp 🦐
Keep in mind.
🟣 Purple structure -> Monthly structure.
🔴 Red structure -> Weekly structure.
🔵 Blue structure -> Daily structure.
🟡 Yellow structure -> 4h structure.

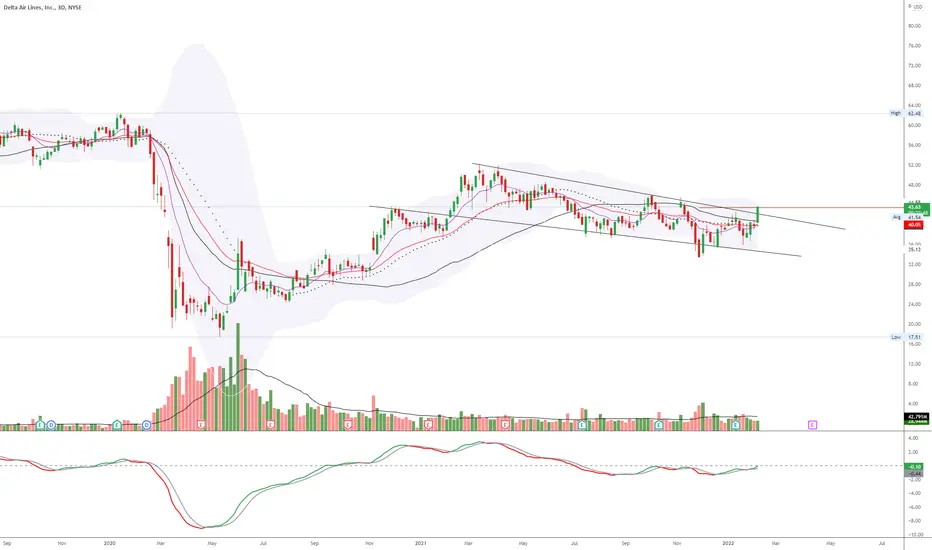
DAL - Bullflag breakout
Still need to clear 46, before going all in, but all checks all the boxes for reversal to the long side.
Pullback from 46, would the best way to go long IMO.
Up, up and away!The coffee futures have broken today the bullish flag, and this derivate on coffee follows the coffee price accordingly. Maybe in the following days, a pullback is possible, reaching 3,71 or the vicinity of the broken trendline below.
According to the seasonality and inflation, I expect a general bullish trend in coffee until the end of the year. But buying this instrument and holding it until the end of the year could be difficult because of the volatility decay. Take care!

GUFIC BIOSCIENCES 1:3 🎯50% trade.NSE:GUFICBIO Broke out of rectangle consolidation pattern and now price gave retest + confirmation.
Bullish signs-
Big volumes on breakout and on the buy side.
Price entered virgin territory with this consolidation and breakout.
Recent support from 30 week MA.
Low volume red candles.
Pattern is of a bullish flag type.
Stock has already delivered multibagger returns of 2000%.
One can enter entre position at C.M.P with a big sl in view of a taking a positional bet for next 1-6 months.
Targets: 275/320/375/400+
Place wide sl below 200
Trail sl if trade goes our way.
Position size accordingly. HAPPY TRADING!

ETHBTC BullflagETH looking very solid, which makes sense with all the demand esp. for NFTs
Printing a nice Bullflag on the weekly. Enter at the bottom or on Breakout.

Monthly chart with target 116,000 USDNot all days are over yet. I see a triangle in the monthly chart, possibly also to be interpreted as a bull flag.
I think the 35,000 USD must hold so that the bull market continues.
What do you think?
Be careful and all the best

AUDNZD on a bull flag? 🦐AUDNZD on the 4h chart is trading below a weekly resistance.
The price is consolidating in a bull flag and according to Plancton's strategy IF the market will break above and satisfy the academy condition we will set a nice long order.
--––
Follow the Shrimp 🦐
Keep in mind.
🟣 Purple structure -> Monthly structure.
🔴 Red structure -> Weekly structure.
🔵 Blue structure -> Daily structure.
🟡 Yellow structure -> 4h structure.
⚫️ Black structure -> <4h structure.
Here is the Plancton0618 technical analysis , please comment below if you have any question.
The ENTRY in the market will be taken only if the condition of the Plancton0618 strategy will trigger.

BNB (Updates)BNB is going down too, continuing deeper with the bull flag pattern on the hourly. 417.5 we might get a bounce off from there. Bearish cross on the macd, rsi reaching oversold. Drag down by BTC.
BNB 1H

CRO could hit a massive run any day nowWith the tightening of the bull flag pennant (or so what I see it as), I see CRO popping off anytime soon. With further bullish divergence on the 4 hour chart at our current low, I see this as further support for the idea. This rally could be brought by news or simple reversal. Targets are above 1$, however I would be cautious, as I see us having strong resistance at all time highs. I currently have a trade active at the moment with a target of 0.8$ This is not financial advise.
