Bullflags

$TUP - Follow Up - Congrats if you were in it!I unfortunately was rotating money out of other stocks and didn't have funds to get into this in time. Bummer. It did break out though!

BELBTC is creating a bullflag 🦐BELBTC is creating a bullflag after a nice breakout from daily resistance and after bounced on 0.5 Fibonacci Level
IF the price will have a breakout upwards and flip 4h resistance into support, According to Plancton's strategy, we can set a nice order
–––––
Follow the Shrimp 🦐
Keep in mind.
🟣 Purple structure -> Monthly structure.
🔴 Red structure -> Weekly structure.
🔵 Blue structure -> Daily structure.
🟡 Yellow structure -> 4h structure.
⚫️ Black structure -> <4h structure.
Here is the Plancton0618 technical analysis, please comment below if you have any question.
The ENTRY in the market will be taken only if the condition of the Plancton0618 strategy will trigger.

run up to earnings and beyondearnings this week with the potential to hit all-time highs within the next 15-30 days.

FSLY Cup and Handle Break Out of Darvas Box NYSE:FSLY On the hourly Fastly Inc formed a Cup and Handle pattern and broke out of a Darvas box with a volume above the average. Now it looks like it is forming a Bull Flag

Bull flag formation with a dojiBull flag formation. si le haut du doji est brisé , il y aura fort probablement une continuité au niveau du prix et donc jusqu'à la mm 200. Buy near the support and sell or short near the résistance.

DAX 13224.42 + 0.49 % LONG IDEA * CONTINUATION PATTERNSHELLO EVERYONE
A look at the DAX INDEX from the monthly, weekly & the 4H charts the sentiment is net bullish meaning we might see a break of the historic resistance level 13570.66 and see continuation with the bulls, the index is currently trading is a bull flag which could signal continuation to the upside and momentum favors continuation, but looking at the index its overbought on most indicators meaning we might see a pull back before continuation to the upside so trade will be triggered once we break above of the bull flag.
As always higher time-frames for direction and whats happening in the overall chart and lower time-frames for entry opportunities.
LET'S SEE HOW IT GOES..
HAPPY TRADING EVERYONE & LET THE WINS RUN...
_________________________________________________________________________________________________________________________
ENTRY & SL - FOLLOW YOUR RULES
RISK-MANAGEMENT
PERIOD - SWING TRADE
__________________________________________________________________________________________________________________________
If this idea helps with your trading plan kindly leave a like definitely appreciate it.

Is Bitcoin trading in a bullish flag?Or, possibly a descending triangle, there's been a bearish cross on the KST where I have the red finger icon pointing downward.
On the RSI there's a noticeable pattern identical to the price action.
I have drawn a hypothetical potential price scenario outcome in green.
The green human body & head icon represents the head of a potential Inverted H&S pattern, if there's consolidation moving forward it would be ideal to see the head area hold as support to form the right shoulder of the pattern.

Bull Flag to 16927.42... still going looooong!!!!So we're hearing that the next levels are 17200, 20k, 30k then 100k... i see a bull flag forming ready to launch ASAP

SIRI bull flag breakout, triple toSIRI looks like it's formed a bull flag which it's about to break out of. SIRI's fundamentals look pretty good. Analysts are recommending to buy it. $6 is a natural support/resistance, and it has snuck above it a couple of times.
I'm planning on entering in with a medium size position at $6.00.
My risk is $5.85 (2.5%). I'm hoping for it to go up to around $6.70, which is about 11%.

What is a Bullflag $NIO Finding patterns in real time is an essential. This is a bullflag on $NIO that I signaled yesterday, but this was a perfect opportunity to add on this bullflag. Especially if you are scalping. We took $LI $NIO $KNDI long last week an added to strength. Study those patterns and learn to identify them in real time. We do 1 on 1s with our students and this is one of the main points we push...be active! happy trading!

Bull flagging with room aboveConsolidating after remarkable strength, room up to the confluence of the fib and Bollinger band on more strength in solar


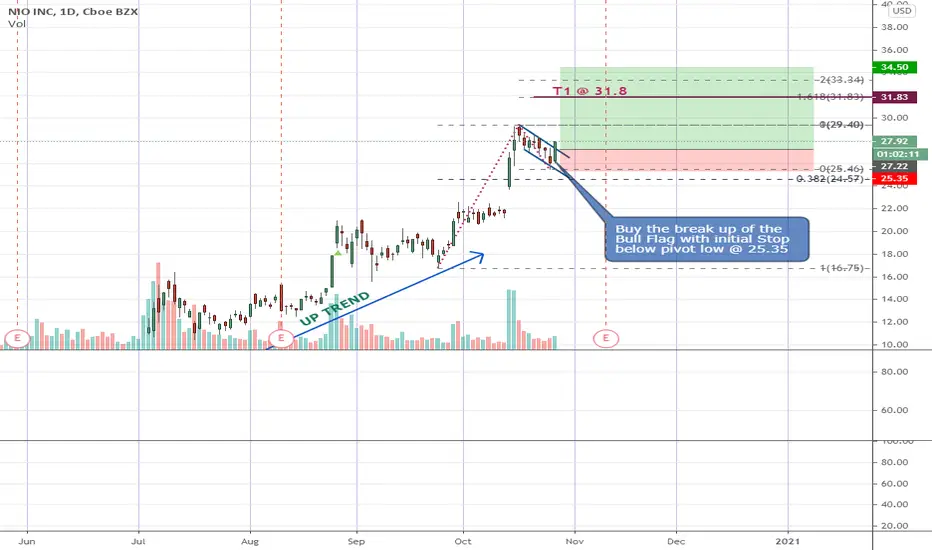
NIO - Bull Flag break upNIO has been consolidating within a narrow bull flag for the past 7 days and today it made a decisive break above this flag. Long as it breaks above @ 27.20 with initial stop below the recent pivot low @ 26.35.
Am expecting the bullish trend to continue but may take partial profits at the 1.62% fib extension ($31.80).
Caution! Presidential Election is just round the corner and could be extremely volatile next week. Trade at own risk.
Disclaimer: This is just my own analysis and opinion for discussion and is not a trade advice. Kindly do your own due diligence and trade according to your own risk tolerance. Thank you.
Apple Bottoming into Bull Flag. Apple currently coming out of a small bear flag.
Combination of short-term trend line combining and long-term support line hitting a possible strong resistance level of $113.8.
Downward trend hitting compression point with upper bound of bull flag (aka bull flag will pop in next 1-3 days.)
Bottom at 113.80 today with a bull flag breakout tomorrow seems likely.

$ETCUSD Bull flag breakout alert!It's been a long time for this flag to form. If we see a volume spike I think the $11 level will be reached soon.

KEY - SelfKey about to give 200%+++??KEY trades on a bull flag , we've been declining from the previous spike to this point, and just saw our first serious breakout.
Indicators are going crazy... Last time this much volume was in play it was an easy 250%. This is a low volume pair, so high volume means she's a mover.
Shoot high, if this is the pop we can get crazy profit here.

USDNZD looking up 🦐USDNZD on the daily chart created a head and shoulder over a monthly trendline.
The price on the 4h chart after the last impulse retraced till the 0.618 fib level in a descending channel.
IF the price now will break and close above the resistance area we can set a nice long order according to Plancton's strategy.
–––––
Follow the Shrimp 🦐
Keep in mind.
• 🟣 Purple structure -> Monthly structure.
• 🔴 Red structure -> Weekly structure.
• 🔵 Blue structure -> Daily structure.
• 🟡 Yellow structure -> 4h structure.
• ⚫️ Black structure -> >4h structure.
Here is the Plancton0618 technical analysis , please comment below if you have any question.
The ENTRY in the market will be taken only if the condition of the Plancton0618 strategy will trigger.

good ole ATVIis it ready this week? with the market at highs its a tough call but this set up is juicy.

BTCUSDT is inside a descending channel 🦐BTCUSDT is inside a descending channel for a few days.
The price tested several times the daily support and the local resistance. At the moment the volume is decreasing and it means a new impulse. We can't predict which direction, we need to wait for confirmation and follow the market.
–––––
Follow the Shrimp 🦐
Keep in mind.
🟣 Purple structure -> Monthly structure.
🔴 Red structure -> Weekly structure.
🔵 Blue structure -> Daily structure.
🟡 Yellow structure -> 4h structure.
⚫️ Black structure -> >4h structure.
Here is the Plancton0618 technical analysis, please comment below if you have any question.
The ENTRY in the market will be taken only if the condition of the Plancton0618 strategy will trigger.


Bullish Flag or Descending Channel? OSU is trading in a bullish flag outlined in blue, and the red downward sloping line is potentially forming a descending channel.
On the RSI there is a similar bullish flag or descending triangle as to the price.
The KST is in an area where we have seen previous bullish crosses, see blue finger icon for examples.

Buying TSLA on dip. This could happen in the next week or so.. Filling the two recent gaps, bull flag shape.
