USDCAD 1D BULL FLAG LONG TRADEBull Flags are a form of Range Patterns and are repeatable trading chart patterns.
Bull Flag chart patterns will have a directional bias depending on the previous incoming trend.
Each chart pattern will have defining trendlines of the support/resistance levels creating the pattern.
What ever time frame you are trading this chart pattern, wait for a candle close outside of the trendline in the direction of the breakout candle. (Our time frame preference is the Daily chart).
Add volume indicator - Volume is the amount of $ that went into a particular candle or in Forex the # of trades that took place.
Add ATR indicator - Volatility is the amount of price movement that occurred. Use the ATR to measure the price movement.
When you see descending Volume bars and descending ATR line (which indicates volatility) this shows
a dis-interest in traders to invest in this pair creating consolidation which creates the chart pattern.
Trade Management after there is a breakout candle close.
1 - Position size (compare volume bar to volume ma line).
a - Breakout candle must be 100% of average volume for a full position size.
b - If 75% of average volume then ½ position size. (To find 75% of Volume
look at the charts volume settings – divide smaller # into larger # = 75%+)
2 - Enter two trades.
3 - SL for both trades will be 1.5 x ATR.
4 - 1st trade TP will be 1 x ATR.
5 - No TP on 2nd trade – letting profit run and adjusting SL to follow price.
6 - When 1st TP hit – move 2nd trade SL to breakeven.
7 - Adjust the 2nd trade SL to follow price.
*8 – After Breakout candle – if price closes back into chart pattern close trade
*9 - When breakout candle is more than 1 ATR from breakout candle open.
a - Enter 1st trade at candle close with ½ position size.
b - Enter 2nd trade with a pending limit order that is 1 ATR of breakout candle open.
c – Price should pullback to that pending limit order for 2nd trade.
d – If Price returns back into chart pattern close trade before SL is hit.
Bullflags

Broadcom Should Break Out SoonNASDAQ:AVGO is repeating the same pattern from 2 months ago before it broke out. Look for entries near trend line supports or on a break out. Support and resistance levels are clearly marked via the trend lines. Also, when the ADX crosses bullish it will be an extra long indicator.

BOOT is a buy immediately!Why is it a buy? As I stated in a previous post, I spotted a Cup & Handle forming in BOOT. In my opinion, the formation in BOOT is a complete...though the handle looks a little wonky lol. Who else is in BOOT?
NYSE:BOOT

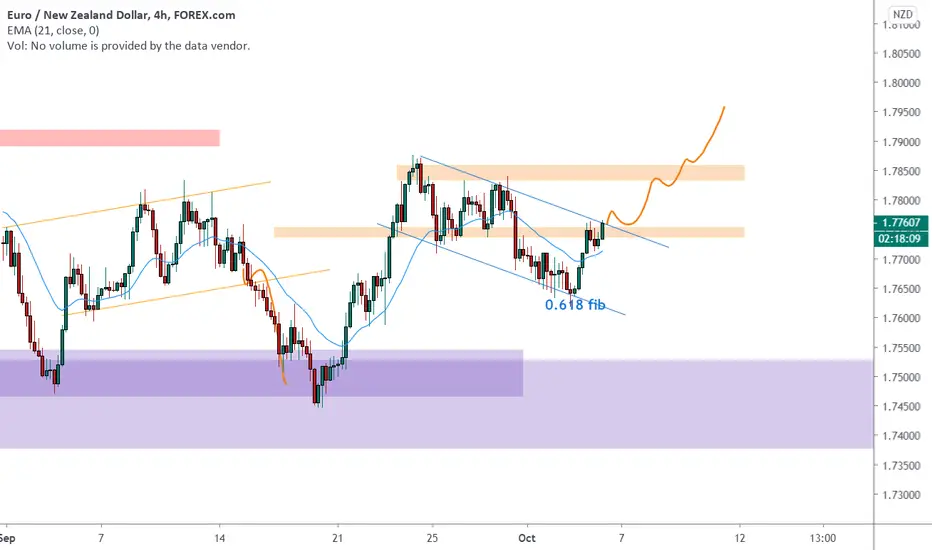
EURNZD 4h analysis 🦐EURNZD on the 4chart retraced back till the 0.618 fib level of the previous bullish leg.
Market is currently testing the minor resistance at the top of the minor descending channel or bull flag.
If the market will break and close above it we can set a nice long order according to Plancton's strategy for the new impulse.
–––––
Follow the Shrimp 🦐
Keep in mind.
• 🟣 Purple structure -> Monthly structure.
• 🔴 Red structure -> Weekly structure.
• 🔵 Blue structure -> Daily structure.
• 🟡 Yellow structure -> 4h structure.
• ⚫️ Black structure -> >4h structure.
Here is the Plancton0618 technical analysis , please comment below if you have any question.
The ENTRY in the market will be taken only if the condition of the Plancton0618 strategy will trigger.
LendingTree: Bullish Technicals and Fundamentals ExplainedIn this analysis, I'll be providing an in-depth analysis on LendingTree, as well as an explanation on megaphone patterns and its bullish upside.
What is LendingTree Inc.?
Lendingtree (TREE) is a company that offers a platform for borrowers and multiple lenders, offering the opportunity for its users to find the best possible deal on their loans.
Business Model
- Users of TREE gain access to multiple loan offers, and TREE’s clients gain the benefit of a cost-efficient customer acquisition.
- Essentially, LendingTree is a platform where people shop for money.
- Lendingtree works with major banks such as Citibank, Wells Fargo, as well as mortgage brokers, p2p specialty finance institutions, and small businesses.
- Their clients’ pain point is that borrower acquisition is a key constraint to growth.
- They offer a personalized platform called My LendingTree in which users can track their financial credit and performance
- Their cumulative user growth has been increasing at an exponential rate
- One fact many people misunderstand is that LendingTree does not take a markup fee.
- Their revenue comes from the payments made by lenders (their institutional clients), who pay to join the LendingTree marketplace.
- TREE also gets paid by their clients when its users sign up for their loans or services.
- While mortgage loans are their main focus, they are expanding into areas of: personal loans, auto loans, business loans, student loans, credit cards, saving accounts, and home equity loans.
Financials
- LendingTree’s revenue has tripled to $1.1 Billion by the end of 2019, almost triple the revenue of 2016.
- They continue to demonstrate tremendous growth as consumers shop for mortgages over time
- While their revenue was dominantly mortgage based, they have managed to diversify into generating revenue from non-mortgage related loans and services.
- However, their operating expenses have also significantly increased due to huge marketing budgets, and their operating income is not as exponential as their revenue growth
- Their quarterly revenue changes have been showing inconsistencies, and reported negative earnings for 2020 Q2.
- However, the company demonstrates steady and strong free cash flow
Technical Analysis
- We can take a look at TREE’s weekly chart for long term insight
- To begin with, the chart is currently trading within a textbook megaphone pattern
- A megaphone pattern can be a continuation or reversal pattern depending on how prices react near the resistance
- This pattern demonstrates 5 distinct swings, each getting larger than the previous one,
- As demonstrated above, we are currently in the middle of the fifth swing
- We can see that a reverse head and shoulders pattern has been forming since the third swing.
- We have temporarily broken out of the descending trend line resistance (marked by the dotted blue line), and forming what seems to be the right shoulder
- The formation of the right shoulder can also be seen as a bullish flag pattern, where prices are consolidating before a breakout
- On the short term, we are consolidating below the 0.618 Fibonacci retracement resistance.
- We have tested the pivot line support, as prices look to break out
- Even if we see a rejection at the trend line resistance on the fifth swing, there is a 60% upside potential based on the megaphone pattern structure
Conclusion
With the Fed having said that interest rates will remain at near zero, and considering the fact that the US housing market is still in an uptrend, given that we see more recovery in the economy, we could anticipate huge growth for LendingTree as more users seek to get loans. The technicals demonstrated on LendingTree’s chart are also extremely bullish, making this stock a solid mid-term investment.
If you like this analysis, please make sure to like the post, and follow for more quality content!
I would also appreciate it if you could leave a comment below with some original insight.

RAMP 53 breakout of base/bull flagThis is a very nice set up for under 53. look to buy in large sizes through 53 with a stop under 52. Nice RR.

$TWTR Watch for the break of the bull flagvery nice setup, looking for the break of the bull flag, can make a great day trade

A very nice bull flag forming, look for a bullish break out Nice bull flag formation on TSX:PLC . Look for longs on a break out or a break out + retest. Stop loss would be under $26 (support is just above that) and the minimum price target for a long would be around $30 where the previous swing high was. The ADX indicator is still red, if it can turn green before a break out, that would be even stronger.

DKNG BULLISH AS...DKNG 15 min chart... covered the daily chart on Friday. DKNG is in this bull flag! I am scalping Puts down to that .618 fib retracement at $46.13 and scaling in to Call Contracts for multi week swing, to be safe will get 2 week out exp. We have a gap down at 51.03 so I'm expecting some red early this week and we pick up some momentum to go up. Analyst have upgrade price targets and sports entertainment is starting to get back to normal. My PT is $60 by EOW if we see some good volume and news.
Key support levels: $43.50, $35.20
My plan: Scalp puts to $46-50 range, Scale in and start small for Call contracts exp: 10/9 or 10/16 expecting to increase the size of my positions closer to 46$

call with zoom make your profits great A very big support line with bull flags too continue the big move
if its breaking the flag and crossing the classter it could be a great entry
like follow and share if it was helpfull

Descending Triangle or Bullish Flag for Gold?Gold is trading in a noticeable Bullish Flag or Descending Triangle, and the RSI is displaying a similar pattern as well as the KST.
On the KST there's possibly a Triple Bottom and a Bullish cross happening on the third bottom, we'll have a better understanding of the third bottom if it remains a higher low in the upcoming trading days/weeks.
If the KST gets doesn't create a higher high & gets rejected at the blue downward sloping line Gold will start looking worrisome "if" the trend continues as suggested with the green line I've drawn to represent "potential" future price action.
If we see the KST develop like the blue line I've drawn Gold will look much healthier from a bullish perspective.

Another fake-out to the downside for GOLD?Gold is trading in a multi month descending triangle that just broke to the downside, keep in mind this pattern has been moderately adjusted since my last because Gold broke out bullishly to the upside, but has since corrected rather drastically, that was a sneaky fake-out to the upside.
If the green line of support doesn't hold the dark red line below is the next significant support area, and if that dark red line holds Gold will create a similar pattern just larger.
The KST is looking worrisome, as I suggested in my previous post, we have seen the blue downward sloping resistance come into play, I guess the
the next few weeks will determine the final outcome of this pattern if the upward baseline of support holds.
The KST did cross bearishly recently, hence the reason for the green line sharply crossing over the red downward, coinciding with a decrease in price.
The RSI is in a spot where we've seen previous bullish bounces, will history repeat itself? I've placed a green question mark icon to indicate where we will likely see a bounce.


NZDCHF shortThere is currently a large bull flag forming in NZDCHF.
It is also in the top of a rising wedge right now, so we should be seeing a correction down to our bottom trend line in our channel.
We should hold the support and then try and break out of bull flag.
we should get rejected right now but a breakout is possible now as well but i believe we will have one more leg down.

DOW JONES inside a daily channel 🦐DOW JONES is moving inside a channel and price after hitting the top has been rejected till the bottom trendline.
Price seem to create a bull flag and before finding a support where it created a triple bottom.
Now if the price will manage to break and close above the 4 structure we can set a nice long order according with Plancton's strategy.
–––––
Follow the Shrimp 🦐
Here is the Plancton0618 technical analysis , please comment below if you have any question.
The ENTRY in the market will be taken only if the condition of Plancton0618 strategy will trigger.

AUDCAD testing a weekly resistance 🦐AUDCAD on the weekly chart hit a weekly resistance and price started a retracement move.
On the Daily chart price moved inside an uptrending channel and recently broke a bull flag for a new test of the upper structure.
Price is now ranging between the 2 structure and price bounce over the 0.618 of the previous minor leg.
IF the price will break and close above the 0.96700 area we will set a nice long order according with Plancton's strategy.
–––––
Follow the Shrimp 🦐
Here is the Plancton0618 technical analysis, please comment below if you have any question.
The ENTRY in the market will be taken only if the condition of Plancton0618 strategy will trigger.

MTN - Bull flag in the makingClose above previous highs of R64 will trigger the long. Keep an eye for the break. First target is R68 with 2nd target at R72.30

THETABTC in inside a bull flag 🦐After amazing profit ( +62% previous idea the price is inside a bull flag an it finds 4h support.
IF the price will have a breakout from flag According to Plancton's strategy, we can set a nice order
–––––
Follow the Shrimp 🦐
Keep in mind.
🟣 Purple structure -> Monthly structure.
🔴 Red structure -> Weekly structure.
🔵 Blue structure -> Daily structure.
🟡 Yellow structure -> 4h structure.
Here is the Plancton0618 technical analysis, please comment below if you have any question.
The ENTRY in the market will be taken only if the condition of Plancton0618 strategy will trigger.

WAVES/BTC: Consolidation Before a Bullish BreakoutIf you like this analysis, please make sure to like the post!
I would also appreciate it if you could leave a comment below with some original insight.
In this analysis, I'll be analyzing Waves' technicals in order to assess its bullish probabilities.
Analysis
- To begin with, Waves is currently consolidating within a descending channel
- While creating lower highs and lower lows, this is a potential bull flag setup
- After reaching support, it has formed a bullish ascending triangle
- Within this triangle, we can see that it formed a textbook Elliott Triple Wave Combo Wave (ABCDE)
- From this bullish setup, it broke out and closed above the 0.236 Fibonacci retracement resistance
- We are yet to test the resistance at the 0.382 Fibonacci level, and could expect a rally to continue up to the 0.618 resistance
- A break above the descending channel trend line would confirm a further rally to retest local tops
Conclusion
Taking into consideration that Waves 2.0 Testnet will be released around September 30, and the current bullish setup, we could expect a huge upside for this altcoin.
Don't predict the market. Take it by levels, and play by probabilities.
- Michael Wang-

A clear Bull Flag on the one year chart.I think this is a very constructive chart. It looks like a clean break from a year-long channel and now consolidating into a well-defined bull flag.


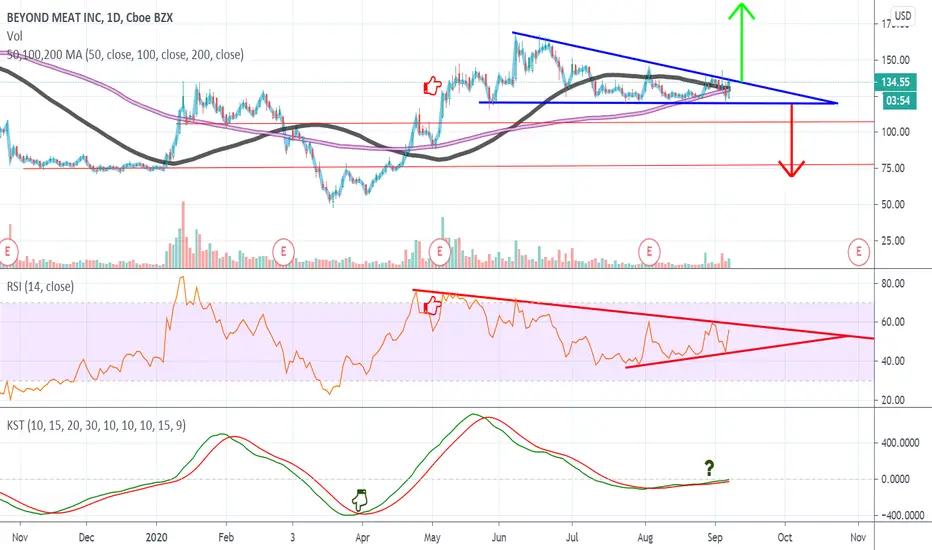
Bullish Flag or Descending Triangle for BYND?On the RSI there was a noticeable bearish divergence that started in May where I have the red finger pointing sideways, meaning, the price was increasing but the RSI was decreasing, it appears as though the divergence has completed.
On the KST there's potentially a bullish cross happening, I have placed a green finger icon to represent a previous bullish cross, and a question mark to represent where there's one potentially happening now.
Bullish Flag or Descending Triangle for TRUL?Notice on the KST there's been a bullish cross, I have placed three blue finger icons to represent previous bullish crosses.
The red finger icon on the KST is there to display some weakness in the previous bullish cross, notice how there was no higher high creation on a Macro perspective and the blue downward sloping resistance, if we get a bullish cross on the KST but no higher high and another rejection at the blue downward sloping line, it's possible we see a bearish outcome in relation price action.
I have drawn a green line on the KST to represent the hypothetical scenario I've suggested is possible.
