Silver is a buy here over GoldI said in my previous ideas on Gold and Silver that they were going to get hit for a few weeks to months but this was a healthy correction on the road to new all time highs. On the weekly and monthly charts we have formed a bull flag/bullish falling wedge and the price action is now bullish. I recommend you buy Silver over Gold because Silver is significantly more undervalued than Gold. The average Gold/Silver ratio is 1 oz of Gold = 60 oz of Silver. The current Gold/Silver ratio is 85. So expect Silver to outperform we are also seeing a breakout in Gold Miners Stocks. Typically when the yield curve normalizes the Gold/Silver ratio normalizes. However, the yield curve normalizing from being inverted now is not due to the market, it is due the the FED QE. The FED is buying bonds up to give the illusion of a healthy curve.
Bullflags

Is TNY trading in a Bull Flag or Symmetrical Triangle?Bullish flag formations are found in stocks with strong uptrends. They are called bull flags because the pattern resembles a flag on a pole. The pole is the result of a vertical rise in a stock and the flag results from a period of consolidation. The flag can be a horizontal rectangle, but is also often angled down away from the prevailing trend. Another variant is called a bullish pennant, in which the consolidation takes the form of a symmetrical triangle. The shape of the flag is not as important as the underlying psychology behind the pattern. Basically, despite a strong vertical rally, the stock refuses to drop appreciably, as bulls snap up any shares they can get. The breakout from a flag often results in a powerful move higher, measuring the length of the prior flag pole.
It is important to note that these patterns work the same in reverse & are known as bear flags & bear pennants, but the bullish volume recently indicates that it's unlikely to result in a bearish outcome...
Only time will tell, and when it comes to Tinley Beverages, "My favorite time frame for holding a stock is forever."
Warren Buffett
On a Macro level Tinley has held their share price impressively well comparable to "any cannabis related stock" over the past 4 years boasting roughly 523% gains...
On a Micro level we're potentially seeing a trend change from bearish to bullish, indicators that support my narrative is the recent Triple Bottom pattern that's linked to this chart. Also, the increase in buy volume indicates that short sellers are either losing money in their positions to the downside, or they're running short on shares available to short, or they've simply reached their target buy in price...
Keep in mind hopium is a schedule 1 narcotic & has killed many Moon Boys in the cannabis sector during 2019.....

TSLA @ Record hi & Breaking out of next bull flag! Short SqueezeTesla is killing it on execution and deliveries, short interest has gone down from record highs to 20% but $ value has actually grown by $2.3B to a record because shorts are shorting at much higher prices. Longs are sitting on Fat gains and will not sell by end of year. Shorts will cover to offset other huge gains which will cause more shorts to squeeze.Tesla is also releasing FSD preview in "Holiday Update" by end of year (maybe over the weekend), and Tesla will report Record Delivery numbers on Jan 2/3rd. All Indicators are also triggering buy signals... A Perfect storm. This is about to blow up!!!

SPLK - Bull Flag BreakoutThe daily chart of Splunk broke out of a bull flag pattern yesterday & has seen its bullish momentum continue in today's trading. The stock is also trading above heavy VPVR levels which can allow it to continue to run higher.
My first two price levels are based on a Fibonacci Extension. The third target is a combination of both the Extension level & the bull flag pattern price target so I am paying close attention to that level.

Is COT trading in a giant Bull Flag?Maybe a descending triangle as well, but seeing the recent bullish upward since Goldman Sachs recommended a buy rating from neutral.
It actually appears as though COT has formed a Triple Bottom, which also appears slightly as a Ascending Triangle. The triple bottom is similar to the double bottom chart pattern and may also look like ascending or descending triangles.
When STZ entered the Cannabis space they used Goldman Sachs to broker the deal.
Goldman Sachs went bullish on Cott a in July, and why? Well, we know Goldman Sachs is supportive of cannabis via the previous brokered deal with STZ & Canopy. They'd be privy to any Safe Banking & States Act regulations, so that may simply be the answer, front running Cott's entry into the cannabis space?
Cott has sold off several assets over the past couple years & have some cash to spend, and seeing so many previous Cott employees in the Cannabis space leads me to believe they may make a surprise entrance into the sector..

DT - Cup & HandleDynatrace has not been actively traded for very long but the daily chart has created a cup & handle pattern which just needs a breakout for confirmation. The backside of the pattern can be interpreted as a bull flag that would have broken out during today's trading session. Notice how the RSI held the 50 level as well as the stock exits an oversold condition. The Sector, Industry, & stock all have relative strength against the SPX as well.
My first two price targets that are noted on the chart are Fibonacci extension levels. The third target is based on the bull flag breakout while the fourth target would be if we receive confirmation of the cup & handle breakout.

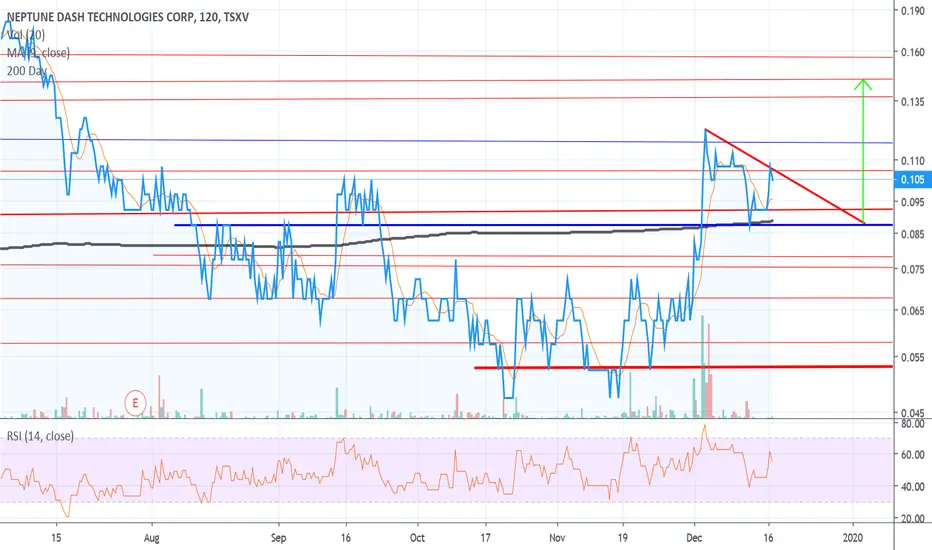
Is Neptune Dash trading in a Bull Flag?Maybe a descecnding triangle as well, but seeing how the share price bounced off the 200 Day MA fairly strong, we'll just have to wait & see how the pattern develops..
I am expecting to see the 200 Day MA at roughly 9c tested again this week, will it hold, only time will tell..
When Might Bitcoin Be Ready To Resume Its Bull Trend?Summary
•Potential Bull Flag continues to form, with Bitcoin falling as much as 52.9% from its 2019 peak.
•Nevertheless, a drop below the most recent low has Bitcoin next targeting the $5,900 to $5,427 price support zone.
•Recent weekly bearish moving average crossover adds to likelihood of further downside.
Bitcoin (BTC/USD) topped out at $13,868.44 in June of this year, thereby completing a 343.2% advance off the December 2018 corrective low of $3,128.89. That low ended a 1-year 84.3% decline off the bull market bubble top of around $19,892, reached in December 2017. Two weeks ago, Bitcoin completed a 61.8% Fibonacci retracement ($7,231.40) off the June high as it fell to a low of $6,526. That low put it 52.9% below the 2019 peak.
Bull Flag pattern
The price correction since the June high has been normal and well-constructed, forming a potential bull flag trend continuation pattern. This can be seen as the falling parallel trend channel in the enclosed charts.
Given the significant advance in the first half of the year, and the related signs of a trend change from bearish to bullish, Bitcoin has a good chance of eventually triggering a continuation of the new bull trend. The 2019 rally exceeded several prior swing highs and the 10-week exponential moving average (ema) crossed back above the 34-week ema.
Have we seen the bottom?
The question now is, has the bottom of the retracement been reached or might Bitcoin pullback further than it has so far? There’s no way to know this ahead of time but we can identify some important price levels to watch going forward.
As long as price stays above the $6,526 swing low, there is a chance for an upside breakout of the bull flag. If the falling trend channel is to further evolve and retain its general shape, a move up to at least the top trend line seems possible in the near-term.
A decisive daily close above the downtrend line is the first sign that a bullish breakout of the flag could be in the works. At that point, additional signs of strength will be needed. Watch for a daily close above the most recent swing high of $10,540.49 for confirmation of a bullish breakout. There is also a monthly high at $9,600 from November. Bitcoin has not had a move above a prior month high since the June peak. A move above a prior month high would be an additional sign of a change in the downtrend pattern, to an uptrend.
If we see further weakness
Alternatively, notice that the 10-week ema has just crossed below the 34-week ema, after being above it since early-May. By itself this is bearish, and supports a bearish scenario if Bitcoin falls below the most recent swing low, thereby triggering a continuation of the downtrend off the 2019 high. If that occurs, next watch for signs of support around the $5,900 to $5,427 (78.6% Fibonacci retracement) price zone, and then for indications of a bottom and subsequent bullish reversal.

MDT - Bull Flag ContinuationThe stock price created a bull flag pattern, more visible on the weekly chart. This is the daily chart which provides a zoomed-in look as the price has consolidated following its flag breakout.
Now that the bullish momentum seems ready to continue I have labeled my three potential price targets I'm aiming at. Note the lack of established volume above the current price. This stock has run potential.

Confirm SCBTC Bull FlagWe see that in order for this to be true, we will surely need a bump to stay above the bottom support line. If it breaks more than a few more days under, then the stoploss is 19.
-Trade safely, never more than what you can lose, and thank you for viewing this potentially agressive bull approach to this cloud decentralized approach to blockchain company
BNM


COTY - Exiting Oversold ConditionThe stock gapped up on October 21st & created a bull flag pattern. It broke out of this flag pattern on November 6th on an earnings announcement. The former resistance line of the flag pattern looks to have become support as the stock price is trying to move back up from this level.
Price target levels are noted on the chart.

BHE - Breakout + Re-TestBenchmark Electronics has been riding a bullish move since the May pullback completed. It has created a flag pattern that has since broken out & successfully re-tested. I have a couple of price targets noted, the first may be in sight soon.

Canadian Pacific Railway Flag BreakoutThe CP daily chart is breaking out of a bull flag pattern during today's session. Seems that a lot of charts have been forming this pattern lately, a very bullish sign overall for the market.
Note how price is beginning to move above where there would be much volume action. Let's see where this stock closes today & if there is any continuation in this breakout.

XAUUSD BuyCurrently gold is inside a bullish channel. its going to break this channel to the upside. There is same pattern earlier in this same trend.

SHOP Weekly BreakoutSHOP broke out of a bull flag pattern on the weekly chart in the week of November 18th. The following week continued the breakout & it is continuing to show strength early this week despite the overall market weakness. I am also noting the lack of volume above the current stock price according to the VPVR data.
I am targeting the $424.70 & $458.70 price levels.

BTC/USD : Continue Buy Upside BUY & SELL As Per Above Given Chart or
You Can Also set Own Risk reward.
Let see what Will be Next Move.
Warning- I m Not a Financial Advisor this idea Only For Educational Purpose Only.
Thank You !

GBP/NZD : Looking Big Upside Move | Simple and Best TRade Setups
BUY & SELL As Per Above Given Chart or
You Can Also set Own Risk reward.
Let see what Will be Next Move.
Warning- I m Not a Financial Advisor this idea Only For Educational Purpose Only.
Thank You !

IWM - Potential Bull Flag PatternThe Russell 2000 ETF has seen a price run-up since early October as it emerged from an oversold condition. The recent pullback has created what may be a bull flag (magenta trendlines) that is close to breaking out. The IWM also seems to be gaining some relative strength vs the SPX which should bode well for this ETF gaining in price.
Upon further evaluation of this daily chart, I might also be able to make a case for an Ascending Triangle pattern (orange horizontal trendline + magenta rising trendline) or a "W" bottom pattern (black trendlines). Regardless of which pattern you accept, all of them are bullish in nature.
I have labeled two potential price targets I am looking at using the Fibonacci Extension tool again. I used the 50% , 61.8%, & 100% levels for these price targets.


Is Ethereum trading in a Descending Triangle?Maybe a bull flag as well..
The rsi is showing higher lows & higher highs, but the recent high Is barely eclipsing the previous & may be a double top.
The 200 Day MA isn't far away, roughly 14% from the share price at the time of writing.


Calls for NFLX yo. Bull FlagNVDA is posting a nice bull flag here on pretty much every time frame. First target is 209, 210, 211. Should see this move by wednesday. Stop close Dont lose a lot on this very easy set up to navigate.
