BTC - Two Bullish Scenarios...Hello TradingView Family / Fellow Traders! This is Richard, also known as theSignalyst.
📉 BTC has been overall bearish, trading within the falling channel marked in red.
The $70,000 area is a key confluence zone — it aligns with the lower red trendline, horizontal support, a psychological round number, and a potential demand zone.
📚 According to my trading style:
As #BTC approaches the blue circle zone, I’ll be looking for bullish reversal setups — such as a double bottom pattern, trendline break, and more.
🏹In parallel, for the bulls to take over long-term, and shift the entire trend in their favor, a break above the last major high marked in red at $88,888 is needed!
📚 Reminder:
Always stick to your trading plan — entry, risk management, and trade management are key.
Good luck, and happy trading!
All Strategies Are Good, If Managed Properly!
~Rich
Bullish-signal

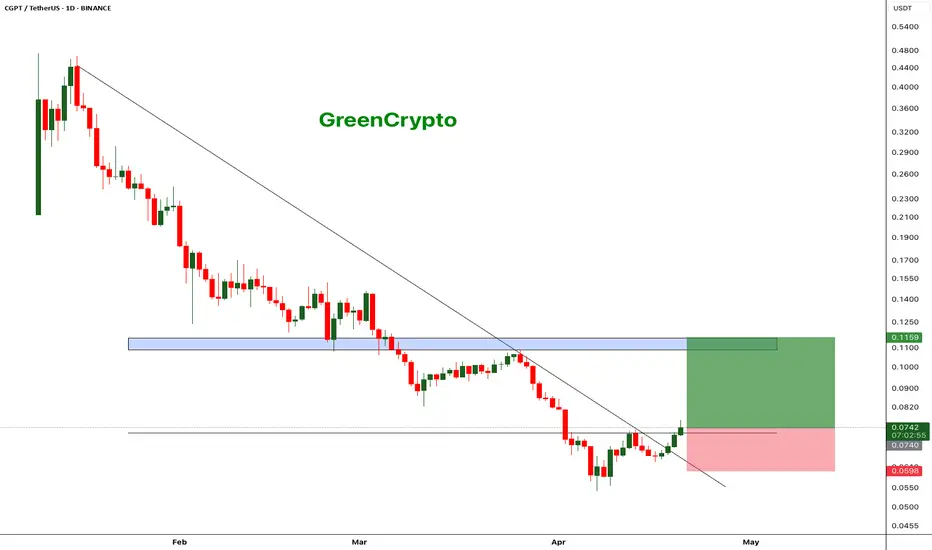
CGPT - Decent Swing Trade Opportunity $BINANCELCGPTUSDT (1D CHART) Technical Analysis Update
CGPT is currently trading at $0.0740 and successfully broke out from the local resistance and heading towards the next resistance. This gives a good opportunity for a quick swing trade with tight stoploss.
Entry level: $ 0.0740
Stop Loss Level: $ 0.0599
TakeProfit 1: $ 0.0818
TakeProfit 2: $ 0.0952
TakeProfit 3: $ 0.1114
Max Leverage: 2x
Position Size: 1% of capital
Remember to set your stop loss.
Follow our TradingView account for more technical analysis updates. | Like, share, and comment your thoughts.
Cheers
GreenCrypto
BNB - New Higher High is formingBINANCE:BNBUSDT (1W CHART) Technical Analysis Update
BNB is currently trading at $639 and showing overall bullish sentiment. Price is trading inside the channel and new Higher High is expected to formed soon if this bullish trend continues.
Entry level: $639
Stop Loss Level: $
TakeProfit 1: $685
TakeProfit 2: $750
TakeProfit 3: $850
TakeProfit 4: $900
TakeProfit 5: $999
Max Leverage: 2x
Position Size: 1% of capital
Remember to set your stop loss.
Follow our TradingView account for more technical analysis updates. | Like, share, and comment your thoughts.
Cheers
GreenCrypto

SUI - Falling Wedge - Confirmed BreakoutBINANCE:SUIUSDT (1D CHART) Technical Analysis Update
SUI is currently trading at $2.77 and showing overall bullish sentiment
Price has formed nice falling wedge and we see a clear breakout from the falling wedge pattern. I'm expecting this trend to hold and read the resistance level around $5.3
Entry level: $2.7
Stop Loss Level: $1.8
TakeProfit 1: $3.1
TakeProfit 2: $4
TakeProfit 3: $5.3
Max Leverage: 2x
Position Size: 1% of capital
Remember to set your stop loss.
Follow our TradingView account for more technical analysis updates. | Like, share, and comment your thoughts.
Cheers
GreenCrypto

BTC - Let's Keep It Simple!Hello TradingView Family / Fellow Traders. This is Richard, also known as theSignalyst.
🏢BTC Building Blocks:
📉 Short-Term Bearish:
BTC is currently trading within a short-term bearish block between $81,200 and $87,500.
📉 Long-Term Bullish:
If the $81,200 low is broken to the downside, BTC is expected to enter the long-term bearish block.
📈 Short-Term Bullish:
If BTC breaks above the short-term bullish block at $87,500, it will enter a short-term bullosh block phase towards the $95,000 structure.
📈 Long-Term Bullish:
If the $95,000 level is broken to the upside, a long-term bullish movement toward the all-time high would be expected.
📚 Always follow your trading plan regarding entry, risk management, and trade management.
Good luck!
All Strategies Are Good; If Managed Properly!
~Rich

REZ - Bullish Indeed!Hello TradingView Family / Fellow Traders. This is Richard, also known as theSignalyst.
📈REZ has been in a correction phase and it is currently approaching the lower bound of the its rising green channel.
Moreover, the red zone is a strong demand.
🏹 Thus, the highlighted blue circle is a strong area to look for buy setups as it is the intersection of a demand zone and lower green trendline acting as a non-horizontal support.
📚 As per my trading style:
As #REZ approaches the blue circle, I will be looking for bullish reversal setups (like a double bottom pattern, trendline break , and so on...)
📚 Always follow your trading plan regarding entry, risk management, and trade management.
Good luck!
All Strategies Are Good; If Managed Properly!
~Rich

EURCAD - Follow The Trend!Hello TradingView Family / Fellow Traders. This is Richard, also known as theSignalyst.
📈EURCAD has been in a correction phase and it is currently approaching the lower bound of the blue channel.
Moreover, the green zone is a strong support zone.
🏹 Thus, the highlighted blue circle is a strong area to look for buy setups as it is the intersection of support and lower blue trendline acting as a non-horizontal support.
📚 As per my trading style:
As #EURCAD approaches the blue circle, I will be looking for bullish reversal setups (like a double bottom pattern, trendline break , and so on...)
📚 Always follow your trading plan regarding entry, risk management, and trade management.
Good luck!
All Strategies Are Good; If Managed Properly!
~Rich
Disclosure: I am part of Trade Nation's Influencer program and receive a monthly fee for using their TradingView charts in my analysis.

On a Different SKALE: SKL Analysis!Hello TradingView Family / Fellow Traders. This is Richard, also known as theSignalyst.
📈SKL has been in a correction phase trading within the falling red wedge pattern and it is currently retesting the lower bound of it.
Moreover, the green zone is a strong support.
🏹 Thus, the highlighted blue circle is a strong area to look for buy setups as it is the intersection of support and lower red trendline acting as a non-horizontal support.
📚 As per my trading style:
As #SKL is around the blue circle, I will be looking for bullish reversal setups (like a double bottom pattern, trendline break , and so on...)
📚 Always follow your trading plan regarding entry, risk management, and trade management.
Good luck!
All Strategies Are Good; If Managed Properly!
~Rich

EURNZD - Strong Intersection!Hello TradingView Family / Fellow Traders. This is Richard, also known as theSignalyst.
📈EURNZD has been in a correction phase trading within the falling red channel and it is currently retesting the lower bound of the bullish channel marked in blue.
Moreover, the green zone is a strong structure and support zone.
🏹 Thus, the highlighted blue circle is a strong area to look for buy setups as it is the intersection of structure and lower blue and red trendlines acting as non-horizontal support.
📚 As per my trading style:
As #EURNZD approaches the blue circle, I will be looking for bullish reversal setups (like a double bottom pattern, trendline break , and so on...)
📚 Always follow your trading plan regarding entry, risk management, and trade management.
Good luck!
All Strategies Are Good; If Managed Properly!
~Rich
Disclosure: I am part of Trade Nation's Influencer program and receive a monthly fee for using their TradingView charts in my analysis.

Mirror, Mirror, on the Wall; Who’s the Fastest of Them All?Hello TradingView Family / Fellow Traders. This is Richard, also known as theSignalyst.
🪞 "Mirror, mirror on the chain, which L1 is fast and reigns?"
🔮 Solana: The fairest of them all! ⚡️🚀
📈After rejecting the upper bound of its channel, SOL has been in a correction phase and it is currently nearing the lower bound of the channel.
Moreover, the $175 - $190 zone is a strong support and structure.
🏹 Thus, the highlighted blue arrow zone is a strong area to look for buy setups as it is the intersection of support and lower green trendline acting as a non-horizontal support.
📚 As per my trading style:
As #SOL approaches the intersection zone, I will be looking for bullish reversal setups (like a double bottom pattern, trendline break , and so on...)
📚 Always follow your trading plan regarding entry, risk management, and trade management.
Good luck!
All Strategies Are Good; If Managed Properly!
~Rich

gold idea hidden orders sitting a bit higher $$$ #BookMap "Your income is directly related to your philosophy, not the economy." — Jim Rohn
This emphasizes the importance of mindset and attitude in achieving financial success.
We have orders sitting at the the top, you probably could see them if you were using book map
so I would buy and set a trailing stop loss as price rises up
VWAP will help us enter and exit so no need to list entry and exit
THanks and out
- Trade God

Visa (V): Bullish Momentum in the Financial SectorVisa (V): NYSE:V
Visa , a key player in the financial sector, is currently in the overarching cycle of Wave (5). It appears we've concluded Wave (4) at $174.60 and are on the path to finalizing Wave (5). However, this process will take some time, as we are now in a subordinate Wave 3, which is on the verge of completing a circled subordinate Wave ((iii)).
Consequently, Wave ((iv)) is likely next. While a rise to the maximum of $310.50 is possible, we anticipate a sell-off in the coming days for Visa, potentially down to $260 or even $243. Anything below this range would be excessively deep. This range should mark a potential turning point for Visa for Wave ((v)) or 3. We're closely monitoring the situation and will place a limit order upon observing any weakness.
On a daily timeframe, we are in the middle of the Wave 3 in red and are still bullish.

BAT is flying towards +270% Profit 🫰---------------------------------------------------------------
Description
---------------------------------------------------------------
+ BAT is retracing back to its support zone
+ This is critical zone for consolidation and resume its bullish trend
+ Overall BAT is looking bullish
---------------------------------------------------------------
VectorAlgo Trade Details
------------------------------
Entry Price : 0.2329
Stop Loss : 0.2117
------------------------------
Targets 1: 0.2426
Targets 2: 0.2493
Targets 3: 0.2645
Targets 4: 0.2742
Targets 5: 0.2972
------------------------------
Timeframe: 4H
Capital: 1-2% of trading capital
Leverage: 5-10x
---------------------------------------------------------------
Enhance, Trade, Grow
---------------------------------------------------------------
Agree or Disagree with the ideas ? lets discuss in the comments.
Like and follow us for more ideas.
Regards
VectorAlgo

FLOKI/USDT - Cup and handle patternFLOKI/USDT formed a cup and handle pattern.
What is cup and handle pattern ?
The "Cup and Handle" is a bullish stock chart pattern resembling a tea cup, with a "cup" formation showing a price drop and recovery, and a "handle" indicating a smaller, brief pullback before a potential upward trend.
We can see a strong upward momentum after this. Let's wait and see, share your thoughts.
Cheers
GreenCrypto!

DXY - Intraday Analysis (ICT)My DXY interest for today.
Assuming the last dump was to trap shorts, with the confluence of trading into a Monthly Bisi and Monthly Breaker (Body) and New Month Opening Gap. I am interested to see if this can now move higher.
It also traded off a Daily Bisi then broke higher, again playing around a 4h Sibi, and now seems to be moving lower. There is a 1h Balanced Price Range inside a Breaker on this timeframe at OTE of that range. I would like to see it react off of there, go higher, use the 4h gap as support, then move higher to target an actual liquidity void above.

🔥 Bitcoin Bull-Market Here? These Indicators Say YES! 🚀In this analysis I want to take a look at three lesser known long-term indicators. Since we're looking over a long period, I found the monthly chart to offer the most clarity.
Keep in mind that these indicators signal long-term (>2 years) changes in trend. We can still experience short-term dumps, whilst the long-term trend is bullish.
Indicator 1: Chaikin Oscillator
Chaikin Oscillator is a technical analysis tool used to measure the accumulation and distribution of moving average convergence-divergence (MACD).
Every time that this line crosses 0 from below, bullish price action follows. Note that this indicator needed two crosses in 2012 and 2020 before the "real" bull-run began. Since this indicator crossed the zero back in March this year and retested the 0 last month, I'm more confident that we might only need 1 cross this time.
Indicator 2: Stochastic Momentum Index - SMI
The Stochastic Oscillator and the Stochastic Momentum Index (SMI) are both tools used to indicate momentum and are often used by financial traders to understand psychological undercurrents and their relation to price movements.
Note that every time the SMI crosses the 40 line from below (and becomes green), Bitcoin starts a bull-market and huge moves follow.
Indicator 3: True Strength Index - TSI
The true strength index is a momentum oscillator used to provide trade signals based on overbought/oversold levels, crossovers, and divergence.
The blue (fast) line has crossed the red (slow) line for the third time in Bitcoin's history. A bull-market followed every time before.
Has the bull-market started?
According to these indicators, yes. I'm fairly confident that Bitcoin is currently at the start of a 2-3 year bullish period. Keep in mind that we can still get times of bearish price action during these years, as we always had.
On the other hand, there's a looming recession in the USA. Recessions are always bad for stocks, and therefore likely bad for crypto as well. There's a probability that crypto will be harmed less by the recession since stock-crypto correlation is currently very low, but that could easily change in the future.
All in all, there are risks, but I'm fairly certain we're now at the start of a new long-term bullish trend.
Share your views in the comments 🙏

GBPUSD (Everybody hands go UP!!!!!!)Too much Reversal confirmations over here ...
It could obviously be wrong but this is a good setup.
You can start off small and once the next higher high forms on the 1hour timeframe you can start adding positions at the pullback demand.

BTC will crazy uppreviously the speech of the powell has been made a really serious dump on the DXY rates so in that case BTC has broken the strong trend line which is made it dump.so in that case we could expect rejection higher on btc/USDt then create new movement .Also now it is in monthly resistance so we could expect a rejection higher as support become resistance.overall its bullish .
GBPUSD D1 - Long SignalGBPUSD D1 - Really want to see this upside break and retest before jumping into these longs. ***USD pairs are fast approaching some fairly significant daily resistance zones, lots of data out this week for both the GBP and USD. So this could really catalyse an upside break... We just have to wait and see what releases and what starts to unfold.

it's time to going up for WANETHbefore buying, please check for being sure about your opinion about this CRYPTOCURRENCY!!!
(in every target you want closed the position but our target is the third one)
be rich...
and
doing and living in the best quality *-*
(Guy's the entry place is importance things in enter in a position)

GMT - USDT Can Go HigherHi traders, as can be seen from the daily chart there are good bullish signals for this pair although overall the market still remains strongly bearish. First we see that the MA50 has been broken and the price right now uses it as a support. Second, there is a large bullish divergence in the RSI. In conclusion it is possible to see that after the first impulse from the 0.55 area, the price is now in a range that could with a good probability break up.
Not a financial advice!

Ethereum Expecting Bullish from here target will be $2300#Ethereum Technical Analysis:-
#ETHUSDT EQL ( Equal Low ) ✅
I am Still Bullish above $1700 ( EQL )
I Bought With $1690 Stop Loss ( Spot )
Expecting Bounce back from here and Target will be $1960 & $2350
RSI Trading above Support Level.

XVGUSDT - BULLISH SIGNAL UPDATE!!As you all know, XVG is not performing well from last 16 weeks and according to the Chart patterns, Decending Channel is formed, Breakout formation is also nearly there and also indicators giving bullish signal.
DYOR Before taking trade, as I'm not responsible for your loss.
RISK FACTORS:
Market/ BTC CRASH
Duration:
MID-Term (3 - 10 Months) Trade.
Happy Trading :)
Good Luck!
If you like my idea, please support:
Binance Smart Chain ( BSC ): 0x69Ea86D0f6B762fC36A322b0C833D2bd04534b3d
