Bitcoin's bullish 1hr Inverse H&S pattern 26th Sept 2018 [BTFD] Just spotted an Inverse H&S pattern on the 1 hour chart
Cycle of Power moves up into bullish zone
also looking bullish on my MT4 terminal also
6800 on the cards short term and could push towards the 0.618 fib around 7400
use yesterdays educational chart as a guide for next peak...
Bullish-signal

ZECBTC High risk but profitable opportunityThe price penetrates Ichimoku cloud where the lines intersect each other. Moreover the green cloud is above the red which means the trend reversed and our buying zone acts now like a strong support.
At the 4-hour timeframe there is Bullish XABCD pattern which can help to break through descending triangle. Nevertheless there is no strong fundamental and technical background for subsequent growth, indicators are bearish. There should be a downtrend to the triangle zone again when the price reaches all our target.
However mentioned at the chart bounce can bring a good profit in the short term
4 signals including ZEC and BAT were posted in the Premium channel 2 hours ago. The rest 2 signals are kept in secret as the are based on insider info and can bring huge x2-3 gains. Do not miss the opportunity

KMDBTC retracement movementThe price broken down through the strongest support, however it seems that market players do not want to trade this coin at the lower price. Indicators become bullish, EMA 20 is going to intersect the rest EMA lines while there is hidden bullish divergence and Gartley butterfly.
The price will pump back to the Fib 1 retracement level and then it will be possible to scalp using our targets. Stay tuned for updates

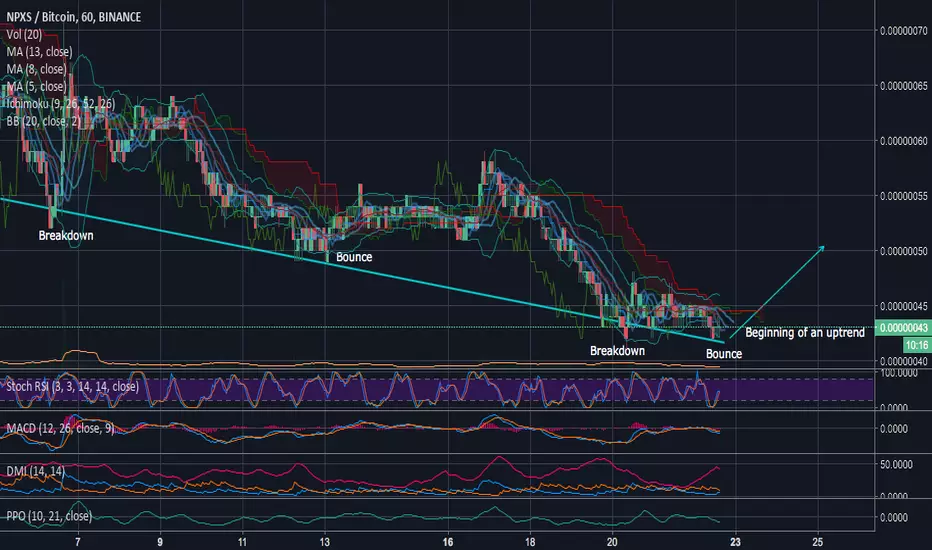
NPXSBTC consolidation is overOne of the new coins on Binance, faced a correction wave after listing. At the previous time we analyzed this coin it was at the side trend around 0.00000065, however it went down due to BTC fall. You can see a corrective pullback on the chart which is finished now and the price is again in the side trend. From this point it can bounce and go up to the previous height. Carefully track this coin and our updates
There is a great potential to move higher, and the price range provides a good entry opportunity. DMI shows a great possibility of impulse bounce, MACD and Stoch RSI intersected in a bullish critical area. We recommend this coin for medium term trade.
Signal was posted in the Premium channel 1 hour ago.
SYSBTC descending wedge bounceThe market has a good potential to touch the upper edge of the falling wedge. After breaking out of the triangle further growth is expected. The price will touch the first target then it will roll back a little and will go up again.
The price touched Fib 0.786 support level and is ready to bounce, indicators confirm it. Moreover the price is at the lower edge of the triangle and BB channel, if the price maintain this level there should be upward movement to the upper edge.
If the price goes below our STOP LOSS mention in the signal (the daylight candle will be closed below this level), we recommend to close the position and open it again with the same amount once it consolidates (we will inform you about it). However probability of the negative scenario is low

GOLOSBTC an opportunity after a global decreaseThe price tests a local resistance which is located around 0.00000890, where intersection of Ichi clouds change the trend. Consolidating above this level will start an impulsive wave of growth. If positive trend continues it will reach the next resistance levels around our target. Overall it is a mid term investment opportunity. Currently, price fluctuates in the analyzed range and seems a good entry.

DOPEBTC the reverse is hereSince the market fall we have been tracking this coin as it gives a decent profit on reverses. Currently there is a moment to buy this alt cheap and earn profit. The price bounced from Fib 1 retracement level, moreover there is hidden bullish divergence on the chart and BB contraction. The price should enter the Ichimoku cloud. Buy this coin at the suggested in the signal zone and accurately swing trade target by target as the growth won't be linear

EURUSD - Are the Monday bulls tired?Yes, probably.
Price has reached the top of the current ascending channel. Couple this with the bearish divergence shown on the chart above, shorting seems like an easy choice to make. Or at least taking profit at this area if you have been long all morning like I have.
The first target is shown. If the price reacts strongly to this resistance then it will be a good idea to close the whole trade there in profit.
And of course, to state the obvious... If price breaks above the upper end of this channel, then don't short. Obviously. That would indicate a good time to enter LONG ;D.

WPRBTC a good moment to buy a new coinThe coin looks great on the scale of the mid term time frame. Correction rollback has reached the level where the growth was last time, the 3-hour format indicators look very bullish and relevant for the upcoming upcoming movement, the price can fluctuate round 0.0000125. Breaking through the local resistance will let WPR to move up. Our targets are in the signal which was posted in the Premium channel. The range 0.0000110-115 looks like a good support zone. We will provide a free specifications for this signal in the Basic channel a bit later

XVGBTC Gartley butterfly is going to be formedThe coin is oversold according to various technical indicators, we took one of them to show you at the chart, it is Stoch RSI which is in a buy state now. Combining Ichimoku clouds with the rest indicators we forecast finishing of XABCD pattern and a huge bounce afterall. However XVG is a manipulated coin and the pattern may be broken, hence the growth will happen earlier.

EOSBTC A good long term opportunityEOS is a very interesting coin. We have been tracking it since June 2017 when we invest in its ICO. This project is fundamentally strong as its provide a scalable and decentralized solution. It is a new generation of cryptocurrencies which will be very demanded to build new blockchain apps. EOS is going to launch network and new tokens this summer.
We told that we provide you additional information when it will be okay to open long position. Currently it is a good moment to buy a bag of EOS for your long term part of portfolio

MODBTC a great mid term opportunityThe last analysis for this coin was about 2 month ago and we made a little profit. There is another opportunity to bust your portfolio. The price found support and an uptrend has started. The price went out of Ichi cloud, we expect a little consolidation before another bull run will start.

PIVXBTCAnother opportunity to make a good profit via this coin. At the 1-hour time frame chart the price touched ascending trend line and is ready to bounce from it. Indicators are positive and chart patterns are bullish. There is a double bottom formed right on the trend line forming a strong willingness of market players to see a higher price of this coin.

ASTBTC Three drivesWe found a confident breakout which started formation of Bull Flag with possible three drives scenario. Volume is rising and technical indicators are positive. We recommend this position for a mid term trade.

DASHBTC great fundamentals - great opportunitiesThe wedge seems like Bull's flag, however according to a deeper analysis it is 5 Elliott Impulse waves. MACD and HMA in a buy state, volume increasing. Moreover, fundamental analysis of this coin is also great: Abra has announced that it supports DASH now, NegocieCoins introduces Dash to Brazilian markets, Bitit offers many options for buying the crypto currency. We recommend this coin for a long term.

MUEBTC double bottom is formingVolume is rising, Stoch RSI is in the oversold state. We see a possibility of Double bottom formation to be finished on the 4-hour chart. Although BTC fluctuates hard this can be a safe long-term trade, targets are mentioned on the chart

BTCUSD: Bitcoin The First Real Bullish Sign for DaysToday's price action has effectively created another double bottom over a 40 hour period - showing that loss of downward momentum bulls and HODLers have been hoping for. It's the first bullish signal we've seen for days. So we can look to add or follow the next break higher when it comes.
Right now Bitcoin is making a small continuation pattern but so far holding up off the nearest support line at 9150. It can be bought or added to once the upper small parallel is broken on upside with stops under the same line.
In very near term it can spend some more time consolidating and if 9150 gives way should come back to 9012-9000 - so stops on any longs can be raised to just under 9150 looking to buy back at 9012 if struck.

DOPEBTC a chance for a swing tradeThe coin will be overbought soon. Momentum (10), MA and EMA indicate bearish mood too. Hence the bearish XABCD is confirmed. The price will go down to the level of 0.00000600 which is at Fib 1 support level, in case of successful consolidation we expect a bounce which will start a bullish trend. Buy zone and first 2 targets are mentioned on the chart.


EURGBP Long PositionBullish momentum intact from previous trading cycle
I don't set stop losses or targets, I manually close trades at end of day.

BULLISH SIGNAL FOR MURPHY USA INC (MUSA) ?Is it the end of the downtrend for the Murphy USA Inc (MUSA) stock ?
We can see a clear Triangle Breakout, plus a MA225 breakout, plus the MA50 crossing up the MA100
Is it time to buy ?

