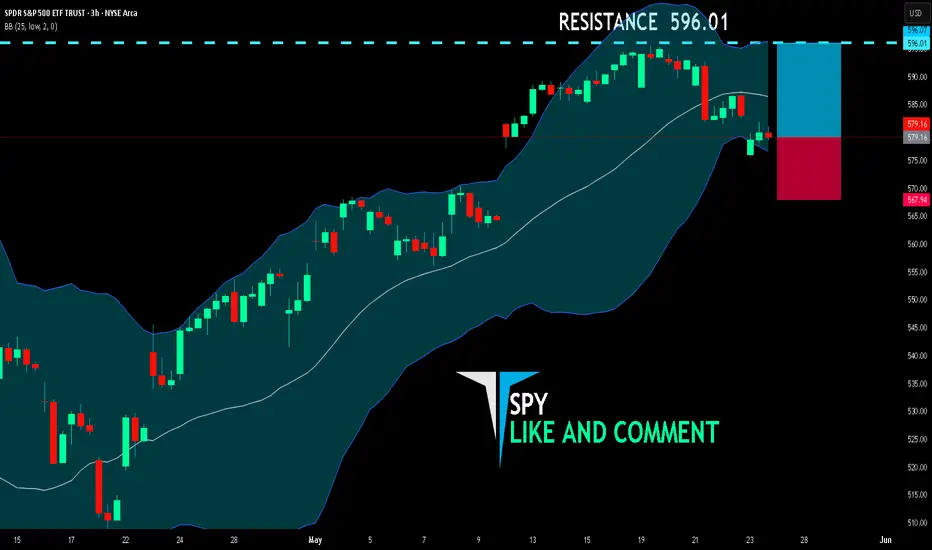
SPY LONG FROM SUPPORT
SPY SIGNAL
Trade Direction: long
Entry Level: 579.16
Target Level: 596.01
Stop Loss: 567.94
RISK PROFILE
Risk level: medium
Suggested risk: 1%
Timeframe: 3h
Disclosure: I am part of Trade Nation's Influencer program and receive a monthly fee for using their TradingView charts in my analysis.
✅LIKE AND COMMENT MY IDEAS✅
Bullish Patterns
Bitcoin - Confirmed Breakout#BTC/USDT #Analysis
Description
---------------------------------------------------------------
+ Bitcoin has successfully broken out from the resistance, this is the third time bitcoin has broken out from the resistance line, in the previous two breakouts bitcoin had significant growth and we can expect similar growth this time.
+ the next target for bitcoin is around 150k and this is an easy target for bitcoin.
+ Bitcoin can see some consolidation around previous resistance (around 109k) but this can be broken easily.
+ Lets see how this plays out.
---------------------------------------------------------------
Enhance, Trade, Grow
---------------------------------------------------------------
Feel free to share your thoughts and insights. Don't forget to like and follow us for more trading ideas and discussions.
Best Regards,
VectorAlgo

ARB - Beautiful Falling Wedge Pattern---------------------------------------------------------------
Description
---------------------------------------------------------------
+ Perfect falling wedge pattern has formed for ARB, a clear breakout from this falling wedge pattern is imminent.
+ breakout from this falling wedge pattern could push the price to previous All time high.
---------------------------------------------------------------
VectorAlgo Trade Details
------------------------------
Entry Price: 0.39
Stop Loss: 0.16
------------------------------
Target 1: 0.6229
Target 2: 0.9196
Target 3: 1.1430
Target 4: 1.6343
Target 5: 2.1129
------------------------------
Timeframe: 1W
Capital: 1-2% of trading capital
Leverage: 5-10x
---------------------------------------------------------------
Enhance, Trade, Grow
---------------------------------------------------------------
Agree or Disagree with the ideas ? lets discuss in the comments.
Like and follow us for more ideas.
Best Regards,
VectorAlgo

ICP - Perfect Long OpportunityDescription
---------------------------------------------------------------
+ ICP has started reversal inside the channel and the price is heading towards the resistance zone, this gives a bullish trade opportunity.
---------------------------------------------------------------
VectorAlgo Trade Details
------------------------------
Entry Price: 5.3
Stop Loss: 3.3
------------------------------
Target 1: 6.9
Target 2: 12.7
Target 3: 22.5
------------------------------
Timeframe: 1W
Capital Risk: 1-2% of trading amount
Leverage: 5-10x
---------------------------------------------------------------
Enhance, Trade, Grow
---------------------------------------------------------------
Feel free to share your thoughts and insights. Don't forget to like and follow us for more trading ideas and discussions.
Best Regards,
VectorAlgo

Its like a Privet Ethereum The tech on this coin is 2nd to monero
Its nothing short of bullish
Privacy coins are underrated

GOLD BULLS WILL DOMINATE THE MARKET|LONG
GOLD SIGNAL
Trade Direction: long
Entry Level: 3,297.95
Target Level: 3,337.98
Stop Loss: 3,271.20
RISK PROFILE
Risk level: medium
Suggested risk: 1%
Timeframe: 1h
Disclosure: I am part of Trade Nation's Influencer program and receive a monthly fee for using their TradingView charts in my analysis.
✅LIKE AND COMMENT MY IDEAS✅

Still bullish above the supportEthereum is still bullish above the support still strong but i can see bullish momentum towards 2700 above 2650 resistance. If it dips back to the support then the bear will be in control so please be cautious and becareful.
If the bullish breaks above 2650 and 2700 then likely will see 3000
Take profit: 2700 short buy
Long take profit: 3000

$BTC to Retest .786 Fib Next ~$102k - BTFD!timberrrrr
the crypto gods shall giveth one last chance.
buy the fckn dip!!!

doge buy midterm"🌟 Welcome to Golden Candle! 🌟
We're a team of 📈 passionate traders 📉 who love sharing our 🔍 technical analysis insights 🔎 with the TradingView community. 🌎
Our goal is to provide 💡 valuable perspectives 💡 on market trends and patterns, but 🚫 please note that our analyses are not intended as buy or sell recommendations. 🚫
Instead, they reflect our own 💭 personal attitudes and thoughts. 💭
Follow along and 📚 learn 📚 from our analyses! 📊💡"

GOLD - BULLISH MOVEHello Traders !
The Gold price formed a symmetrical triangle pattern.
The resistance line is broken !
So, I expect a bullish move🚀
_______________
TARGET: 3414🎯

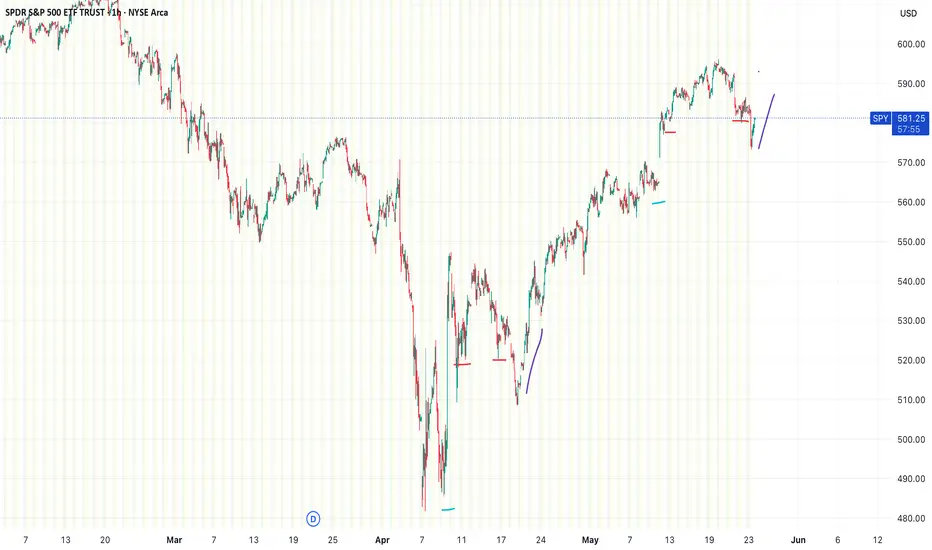
Repeat of Late Apr-May lows & rallyThe chart shows the SPDR S&P 500 ETF Trust (SPY) on a 1-hour timeframe, with a pattern appearing to be repeating itself from late April/May(Liberation day announcements) dip and then boot and rally from trade announcements, all marked by colored lines.
The colored lines (blue, red, purple) highlight a recurring price action setup. Each set of lines seems to mark a sequence of movements:
Blue: Sharp drop, then gap up
Red: Consolidation at a lower higher from gap up, return to high, consolidation back lower at previous lower high
Purple: Breakout & reversal upward.
UNI – Long Spot Trade Setup Following Breakout and RetestUniswap (UNI) has recently broken out of resistance and successfully retested it as support, forming a strong bullish structure. If Ethereum (ETH) continues upward, UNI is likely to benefit from correlated momentum, potentially kicking off a larger rally.
🔹 Entry Zone:
$5.46 – $5.95 (post-breakout retest zone)
🎯 Take Profit Targets:
🥇 $7.50 – $8.00
🥈 $10.00 – $10.50
🛑 Stop Loss:
$4.10

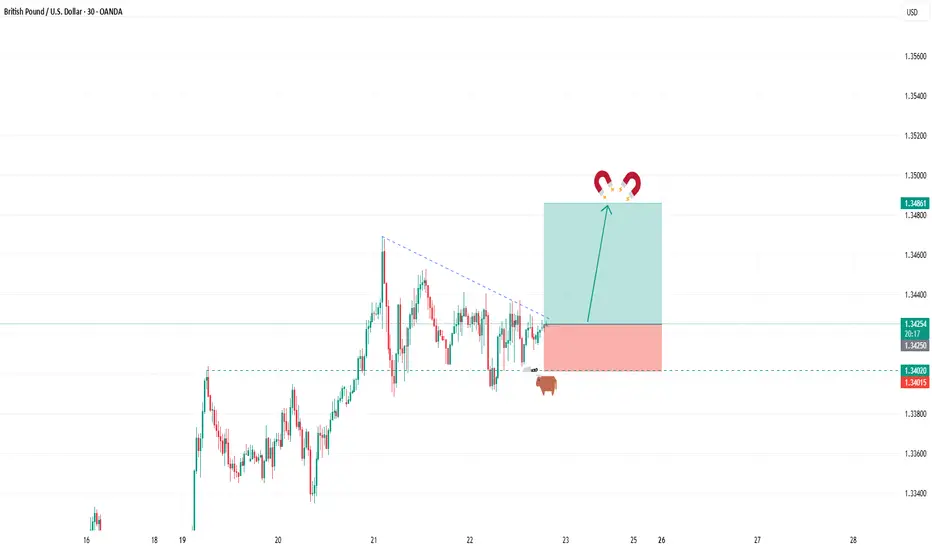
BUY GBPUSDIn todays session we are keenly monitoring CABLE for buying opportunity. Our buy entry is at 1.34258 and our target is at 1.34860 and our tight stop loss is at 1.3400. Use proper risk management. Cheers to you all.
BUY EURUSDAs we monitor DXY for selling opportunity we will also be focusing on EURUSD for buying opportunities. Our current buy is at 1.12878 and stops below 1.12544 our targets remains 1.13630 and higher. Use proper risk management.

US30 BULLISH BIAS RIGHT NOW| LONG
US30 SIGNAL
Trade Direction: long
Entry Level: 41,822.1
Target Level: 42,718.6
Stop Loss: 41,224.4
RISK PROFILE
Risk level: medium
Suggested risk: 1%
Timeframe: 9h
Disclosure: I am part of Trade Nation's Influencer program and receive a monthly fee for using their TradingView charts in my analysis.
✅LIKE AND COMMENT MY IDEAS✅

SEI Turns Bullish After A Zig-Zag CorrectionSEI Turns Bullish After A Zig-Zag Correction, as we see it sharply bouncing from projected support that can send the price higher by Elliott wave theory.
SEI with ticker SEIUSD is waking up exactly from the channel support line and equality measurement of waves A=C, which is perfect textbook support for subwave (5) of an impulse into wave C of an ABC zig-zag correction. It's actually nicely and impulsively rising for wave 1, so after current wave 2 pullback, be aware of a bullish continuation within wave 3 of a five-wave bullish cycle, especially if breaks above 0.30 first bullish evidence level.
Sei (SEI) is a high-performance Layer 1 blockchain designed specifically for decentralized finance (DeFi) and decentralized exchanges (DEXs). Launched in August 2023 by Sei Labs, it features innovations like Twin-Turbo Consensus for fast block finality, Optimistic Parallelization for high throughput, and SeiDB for efficient transaction handling. It supports EVM compatibility, enabling seamless deployment of Ethereum-based apps. The SEI token is used for transaction fees, staking, governance, and liquidity.

BNT Bullish Near TakeoffBNT I’ve been eyeballing for quite a while now. Just look at the chart with no support or resistant lines. ATH of nearly $10 to even $20. Sitting at $0.75 the time of posting. I have some of my money where my mouth is on this one. Keep your eyes peeled.
Good luck and have fun with it.
NC HAMMER CRYPTO

Core Scientific (CORZ) – Mining Bitcoin to Powering AICompany Snapshot:
Core Scientific NASDAQ:CORZ is evolving from a crypto miner into a high-density colocation provider, strategically pivoting into the explosive AI infrastructure space.
Key Catalysts:
Strategic Shift to AI Infrastructure 🧠📡
$1.2B agreement with CoreWeave expands AI compute colocation footprint
Signals institutional validation of CORZ’s infrastructure capabilities
Massive Power Footprint ⚡
1,300 MW capacity across North America
Ideal for power-hungry AI training and inference workloads
AI & HPC Market Tailwinds 🚀
AI infrastructure demand is surging; CORZ is positioned as a first-mover
Colocation demand outpacing supply = pricing power & revenue upside
Transformation Narrative 📈
Transitioning from volatile crypto dependence to stable, high-margin AI hosting
Increased diversification and enterprise appeal
Investment Outlook:
✅ Bullish Above: $8.75–$9.00
🚀 Upside Target: $15.00–$16.00
📈 Growth Drivers: Strategic AI pivot, large-scale power assets, and long-term demand for compute
💡 Core Scientific – No longer just mining blocks, now powering breakthroughs. #CORZ #AIInfrastructure #DigitalTransformation

ETH/USDT – Breaking Out After BTC!🚀 Hey Traders! 👋
If you’re finding value in this analysis, smash that 👍 and hit Follow for high-accuracy trade setups that actually deliver! 💹🔥
After BTC’s rally, it’s ETH’s turn to shine! 🔥
Ethereum has officially broken out of the descending channel on the 12H timeframe, a structure that’s been holding price down since late 2024. This breakout is significant — and here’s why:
📊 Technical Breakdown:
🔸 Broadening wedge finally broken after months of compression
🔸 Price holding well above the EMA, confirming short-term bullish momentum
🔸 Strong volume on breakout candle, suggesting genuine buying pressure
🔸 Breakout coincides with BTC’s surge — signaling altcoin rotation could be starting
📍 Key Levels:
➡️ Immediate Resistance: $2,850
➡️ Short Term Target Zone: $3,200–$3,500
➡️ Major Target Zone: $5000
➡️ Support to Watch: $2,480 (EMA + breakout retest)
💡 Why It Matters:
This move isn’t just technical — it’s psychological. ETH has been lagging BTC for weeks, and this breakout could shift trader sentiment back toward altcoins. If ETH holds above the breakout zone, we may see altcoins gain serious traction in the coming days.
📌 Strategy Note:
Look for a successful retest of the breakout zone for confirmation. A strong daily close above $2,700 could pave the way for a sustained uptrend.
What’s your ETH price prediction? Drop it in the comments and let’s ride this momentum together! 💥

BUY AUDUSDIn todays trading session we are monitoring AUDUSD for buying opportunities. Our entries are at 0.64236 and our targets are as high as 0.65611 all the way to 0.6600 (Yes you read that right!). Our current stops are at 0.63900. Use proper risk management.

SUI/USDT Potential UpsidesHey Traders, in today's trading session we are monitoring SUI/USDT for a buying opportunity around 3.85 zone, SUI/USDT is trading in an uptrend and currently is in a correction phase in which it is approaching the trend at 3.85 support and resistance area.
Trade safe, Joe.

ETH/USDT Potential UpsidesHey Traders. in today's trading session we are monitoring ETH/USDT for a buying opportunity around 2420 zone, Ethereum is trading in an uptrend and currently is in a correction phase in which it is approaching the trend at 2420 support and resistance area.
Trade safe, Joe.

MAGIC/USDT – From Consolidation to Explosion?🚀 MAGIC Bull Flag Formation – 200% Potential Incoming?! 👀🔥
Hey Traders! If you're all about high-conviction plays and real alpha, smash that 👍 and tap Follow for more setups that actually deliver! 💹💯
MAGIC is showing strong signs of a breakout from the descending channel on the 4H timeframe. After consolidating inside the channel for weeks, it has now approached the upper boundary and is testing it with bullish momentum supported by the EMA.
🟢 Long Position Activated
🔹 Breakout Confirmation waaiting
🔹 Volume Picking Up 📊
🔹 EMA Flip Incoming 🔄
🎯 Targets:
TP1: $0.25
TP2: $0.31
TP3: $0.39
TP4: $0.46+
🛑 Stop-loss: $0.151
📌 Leverage: 5x max
💡 A clean breakout from here can lead to a massive move—just like last time with a 273% pump! Don’t sleep on this one.
