TAO 4H - Downtrend bottom? Altcoins have certainly taken a backseat to BTC this cycle with Bitcoin dominance holding around 65%. Despite this, there are still some good setups in altcoins presenting themselves each day, one of which is TAO on the 4H.
To me it looks to be in a clear downtrend respecting the upper and lower limits while reacting off of support levels on the way down. As it stands price has reached a key S/R level that has proven to be support in the past and is in conjunction with the lower end of the trend channel.
With FOMC only hours away and TAO being at such a critical level this would be an interesting place to do business. A good reaction off the level would kickstart a move towards the trends upper limits. A loss of this level and it's very possible what has been support can turn into resistance.
To me the R:R here is good for a long position, the threat to the trade is bearish reaction to FOMC, escalation geo-politically which effects risk-on assets and therefor overalls TA.
Bullish Patterns

when price consolidates, its just setting upLooking for a bigger moving going into mid week. Tues spent the entire day consolidating. Now im thinking we getting ready for a bigger move. Just trying to be patient and wait for it. Price should give us some kinda sign on what it would like to do as we coming into the Asian Killzone.

BUY USDCADIn todays session we are anticipating a bullish dollar. Our entry for buys on USDCAD are at 1.35728 our targets are 1.36484 and stops below 1.35535. Use proper risk management. Stay safe

Theta Is Ready for a Strong Recovery Soon!Looking at Theta, I see strong potential for a recovery very soon. We just completed a classic ABC correction, very similar to what Amazon experienced back in the day. I expect a big bullish move on this coin shortly. We are primed for a strong reversal here.
Theta is undervalued on both the higher and lower time frames, and with such strong project fundamentals, I see this as a major mover in the upcoming altcoin bull market. There’s potential for insane gains on the larger time frames and a strong recovery on the smaller ones.
Don’t focus on the news or media—crypto is ready for big things. As always, stay profitable.
— Dalin Anderson

USDCHF - Now Bullish!Hello TradingView Family / Fellow Traders. This is Richard, also known as theSignalyst.
As per our last USDCHF analysis, attached on the chart, it rejected the upper bound of the orange channel and traded lower.
What's next?
📈USDCHF is now retesting the lower bound of the channel.
Moreover, the blue line is a strong weekly low.
🏹 Thus, the highlighted blue circle is a strong area to look for buy setups as it is the intersection of the lower orange trendline and weekly low.
📚 As per my trading style:
As #USDCHF is around the blue circle zone, I will be looking for bullish reversal setups (like a double bottom pattern, trendline break , and so on...)
📚 Always follow your trading plan regarding entry, risk management, and trade management.
Good luck!
All Strategies Are Good; If Managed Properly!
~Rich
Disclosure: I am part of Trade Nation's Influencer program and receive a monthly fee for using their TradingView charts in my analysis.

Bitcoin Pushed Crypto Market Into A Higher Degree CorrectionGood morning Crypto traders! Cryptos are coming lower and we can now see a five-wave drop on Bitcoin, which indicates for a deeper, higher degree correction, so Crypto TOTAL market cap chart may stay in consolidation within an ABC correction, which can retest 3.0T – 2.8T support zone before bulls return.
Bitcoin has impulsive characteristics on 4h time frame, and we can clearly see five waves up that can send the price even higher after a pullback. Now that it’s back to all-time highs, we can see it making a higher degree ABC correction, which can take some time, and it can retrace the price back to 97k-93k support zone before a bullish continuation.
However, we may now see a temporary corrective recovery in wave B, where some ALTcoins could still be doing well, if we consider that ALTcoin dominance may start kicking in. Yesterday we shared a chart of the ratio of TOTAL3(ALTcoins) market cap against Bitcoin with ticker TOTAL3ESBTC, which shows that ALTcoins may start outperforming BTC soon. It can be finishing final subwave C of (Y) of a correction in blue wave B which may cause a new strong rally into wave C that can bring the ALTseason similar as in the beginning of 2021.

Could BOJ's "HOLD" on Rates Turn AUDJPY "On Its Head"?Here I have a Multi-Timeframe analysis on OANDA:AUDJPY which is giving multiple signs of Higher Prices potentially to come!!
First on the Daily we can see that Price formed a Hammer Candle after testing the March 11th Support Zone and as the next Daily candle forms (Today), we are already seeing a Bullish Confirmation candle begin!
*Bullish Engulfing would be a textbook Confirmation Candle!
Now zooming into the 4Hr / 1 Hr Charts, this Hammer is formed by what looks to be a very Strong Reversal Pattern, the Inverted Head and Shoulders!
Now we are still waiting for the Confirmation of the Pattern where Price needs to rise to the "Neckline" or Resistance Level.
Once Confirmed, we will look for a Breakout of the Pattern and if Validated, could deliver great Long Opportunities as a Breakout and Retest of the Inverted Head and Shoulders Pattern!
If the Pattern is Successful, we could expect the Price Target to be at the next level of Resistance being the 95.3 - 95.6 Area!
Fundamentally, the BOJ begins the week with Policy Rate decision Monday evening where they forecast a HOLD on Interest Rates, staying at .5%. This could have drastic implications on the JPY, potentially weakening it.

Gold is giving up a Set up! Been waiting for this set up. But trying to remain disciplined on this one. I Need to see a sweep of lows at this point in order to be interested in the buy. Once we see that its on. Until then we sit on hands and wait.

AUDJPY Potential UpsidesHey Traders, in today's trading session we are monitoring AUDJPY for a buying opportunity around 93.600 zone, AUDJPY is trading in an uptrend and currently is in a correction phase in which it is approaching the trend at 93.600 support and resistance area.
Trade safe, Joe.

GBP/USD LONG FROM SUPPORT
Hello, Friends!
GBP/USD pair is trading in a local uptrend which know by looking at the previous 1W candle which is green. On the 4H timeframe the pair is going down. The pair is oversold because the price is close to the lower band of the BB indicator. So we are looking to buy the pair with the lower BB line acting as support. The next target is 1.358 area.
Disclosure: I am part of Trade Nation's Influencer program and receive a monthly fee for using their TradingView charts in my analysis.
✅LIKE AND COMMENT MY IDEAS✅

AUD/USD BULLISH BIAS RIGHT NOW| LONG
Hello, Friends!
AUD/USD pair is in the downtrend because previous week’s candle is red, while the price is clearly falling on the 15m timeframe. And after the retest of the support line below I believe we will see a move up towards the target above at 0.651 because the pair oversold due to its proximity to the lower BB band and a bullish correction is likely.
Disclosure: I am part of Trade Nation's Influencer program and receive a monthly fee for using their TradingView charts in my analysis.
✅LIKE AND COMMENT MY IDEAS✅

Global Activities are looking to Push Gold bullishWaiting to see a full on break out before confirming its going to be bullish for the week but it sure does look like that's what its going to be for the next few days. Just be patient and wait for price to confirm.

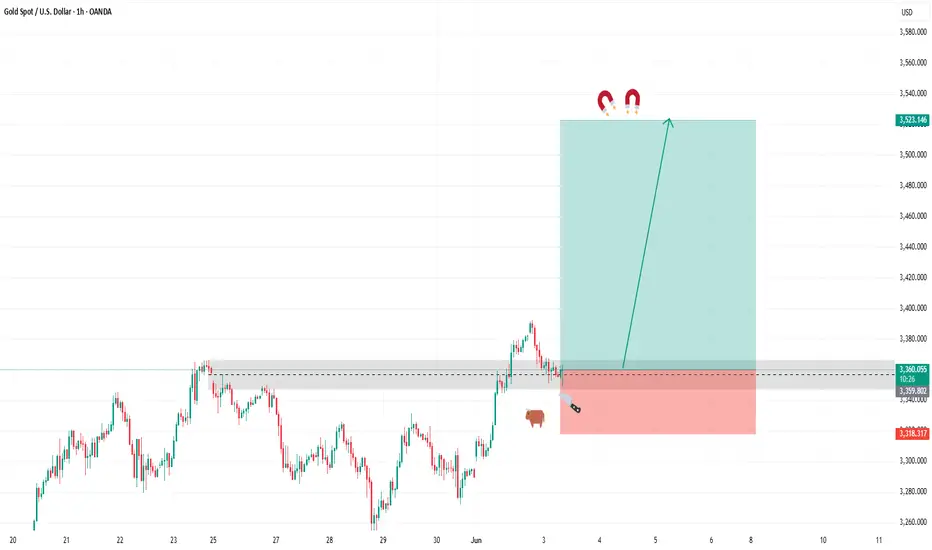
GOLD NEW HIGHGOLD is ready to make a RUN for the money. We are monitoring GOLD for bullish scenario. Our buys are locked in at 3299.110 our stops are below 3241.00 and targets above previous ATH at 3523.750. Use proper risk management. Bets of luck.

BULLISH GOLDIn todays session we are adding more buys to our initial bias on bullish gold heading for new highs. Our entry is at 3360.84 tp new highs of 3523.15 and stop for this one is 3318. Adjust your positions according to your risk management. Use proper money management. Best of luck
Turbulent Week Ahead? Gold Outlook June 9-13, 2025Hey fellow traders,
Let's dive into the OANDA:XAUUSD outlook for the upcoming week, June 9-13, 2025. The recent price action has been a rollercoaster 🎢, and the next few days promise even more fireworks 🎇.
Looking back at the 30-minute chart from May 22 to June 6, gold saw an initial consolidation, then a strong rally to multi-week highs near 3,420. However, this was followed by a sharp, dramatic reversal, pushing prices back below 3,300. This "bull trap" 🐂 pattern suggests underlying weakness and potential preemptive market positioning.
Another view on this could be the possibility that a gap on the chart at 3300-3295 of around $5 could get closed. Since strong support is right below this, it could serve as a good launchpad 🚀 for an upward rally. Let's see if the upcoming Asia session on Monday triggers this because its only - $14 from $3309.
Key Drivers for the Week Ahead:
📅 June 9, 2025 (Monday)
US-China High-Level Trade Talks Commence in London
High-level delegations from the United States and China began trade discussions in London. This meeting followed an announcement by President Donald Trump on Friday, June 6, 2025, who described a preceding 90-minute phone call with Chinese President Xi Jinping as "very positive".
The US delegation included Treasury Secretary Scott Bessent, Commerce Secretary Howard
Lutnick, and US Trade Representative Jamieson Greer, reflecting a coordinated approach to addressing complex trade issues. The talks were primarily aimed at resolving the ongoing bilateral trade war, with a particular focus on tariffs and the global supply of critical rare earth minerals.5 While no specific time for the commencement of talks was provided, it is understood they began during London's daytime, approximately (10:12 CEST / 04:12 EDT).
These discussions occurred in the context of a temporary 90-day agreement reached on May 12, 2025, which had seen the US reduce its tariffs on Chinese imports from 145% to 30%, and China reciprocate by lowering its tariffs on US goods from 125% to 10%.9 However, this temporary truce is set to expire in early August, and President Trump had recently accused China of violating the agreement, specifically regarding critical mineral exports. The broader bilateral relationship remains strained by issues extending beyond tariffs, including restrictions on advanced chips, student visas, and concerns over China's state-dominated economic model.
The prompt scheduling of these high-level talks immediately after a leader-to-leader call suggests a tactical move towards de-escalation of immediate trade tensions, aiming to prevent a full-blown trade war. The objective appears to be managing current conflicts rather than achieving a fundamental resolution, especially with the May 12 agreement nearing its expiration. The core disputes, such as control over rare earths and technology, are deeply entrenched and reflect a broader geopolitical competition rather than mere economic disagreements. This pattern of temporary de-escalation followed by persistent underlying tensions indicates a long-term,structural competition. It suggests that trade policy is increasingly intertwined with national security and geopolitical strategy, implying that businesses should anticipate continued volatility and strategic decoupling in certain sectors, rather than a return to pre-trade war normalcy.
Other big movers for gold will be the US inflation reports. 💥
📅 Wednesday, June 11 (14:30 CEST / 08:30 EDT):
We get the crucial US Consumer Price Index (CPI) data.
Watch for Core CPI (YoY) with a forecast of 2.9% and headline CPI (YoY) at 2.5%.
📅 Thursday, June 12 (14:30 CEST / 08:30 EDT):
The US Producer Price Index (PPI) follows.
Forecasts are for Core PPI (YoY) at 3.0% and headline PPI (YoY) at 2.6%.
📊 These numbers are critical. If inflation comes in hotter 🔥 than expected, it will likely strengthen the US Dollar 💵 and push real interest rates higher 📈, making gold less attractive. This could trigger further declines 📉, especially given the current market structure. Conversely, cooler 🧊 inflation could spark a significant rebound 🔄.
Beyond US data, keep an eye 👁️ on speeches from various European Central Bank (ECB) officials throughout the week, including President Lagarde on Tuesday (23:15 CEST / 17:15 EDT). Their collective tone 🎤 could influence EUR/USD dynamics and indirectly impact the US Dollar Index, offering a counterbalance ⚖️ or amplification to gold's movements.
Key Numbers and Technical Levels to Watch:
Gold is currently sitting on a substantial speculative net long position of 187.9K contracts. This is a massive amount of bullish bets 📊🐂, making gold highly vulnerable to rapid liquidation 💣 if the fundamental picture turns sour. A "long squeeze" could amplify any downside move.
Immediate Support: The 3,300 level is paramount. A decisive break below it would signal further weakness. Below that, 3,250 is strong technical support where we saw a bounce previously.
Overhead Resistance: Look for resistance at 3,350-3,360, and then the recent peak of 3,420. Reclaiming these levels would require a significant shift in sentiment.
Expect high volatility ⚡, especially around the US inflation releases. Trade smart 🧠, manage your risk ⚖️, and stay nimble! 🏃
Geopolitical News Landscape 🌍
India / Pakistan
The ceasefire from May 10 is holding, but diplomatic relations remain frosty. India has launched a global image campaign to gain support, while Pakistan insists on dialogue and accountability.
Outlook: Without substantial agreements on border terrorism and water issues, tensions will stay latently high, with potential for new escalation risks. ⚠️
Gaza Conflict
Violence escalated again in early June. Israel intensified attacks, killing civilians seeking aid in Gaza City, and at least six people were killed at a distribution point.
Outlook: The humanitarian situation continues to worsen 🚨, and international mediation efforts are urgently needed. However, an immediate ceasefire seems unrealistic. ❌
Russia / Ukraine
In the first week of June, Russia launched one of its largest series of attacks: hundreds of drones and missiles hit Kharkiv and Kyiv, resulting in civilian casualties. Simultaneously, a planned prisoner exchange has stalled.
Outlook: Strategic air attacks will likely continue 💥, and the prisoner exchange remains deadlocked. Without a diplomatic initiative, the conflict will stay entrenched. 🕳️
U.S.–China Trade War
Following talks between Trump and Xi, new negotiation rounds are expected in London. China has opened up rare earth exports, a sign of cautious de-escalation.
Outlook: If dialogue channels open 🗣️, systemic trust could grow, but genuine reforms remain uncertain. 🤔
🌐 Global Trade War
The OECD has lowered its growth outlook to 2.9%, warning of protectionism 🧱 and delayed investments. The ECB is also maintaining synchronization with the FED.
Outlook: Without de-escalation, the world faces a global economic slowdown 🐌 and permanent fragmentation of supply chains. 🔗
🏛 Trump vs. Powell
Trump has again complained about the FOMC's hesitancy, nicknaming Powell “Too Late,” and demanding a full 1% interest rate cut.
Outlook: Pressure is mounting 📣. Whether the Fed yields depends on if inflation and labor data allow for a loose policy. 🎯
💵 U.S. Inflation – May 2025
Forward-looking data shows a weakening services sector and consumer prices rising again as tariffs pass through. Official CPI data for May 2025 will be released on June 11.
Outlook: Higher inflation could halt the Fed's "dereflexion" course — a dilemma ⚖️ between growth 📈 and price stability. 🛑
Technical View 📐
Regarding the major Head and Shoulders (H&S) reversal pattern on the 4H chart I shared previously, I'd like to explain some new developments that are altering its potential outcome.
Since the price has re-entered and fallen below the neckline, I activated my "second brain cell" 🧠 to guess what could be next. This led me to revise the larger 4-hour chart structure with the adjustments shown in the accompanying image.
As you can also see in the updated version below, a reversed H&S pattern remains a possibility, as the proportions still appear valid. 🔄
Potential Scenarios for Gold 🧩
Under this revised idea, Gold could potentially reach the neckline entry at 3397 (+88) from the current price. This is one plausible scenario. ✅
Alternatively, the price could drop further to the "Head" at 3120 (-191 from the current 3309), which would, of course, invalidate this H&S pattern. ❗
While this is speculative 🔮, given that trading often involves psychological movements and their resulting impacts, I believe this is a favorable approach to forecasting.
Another reason to see it as bullish is the formed standard bull flag 🚩🐂.
Please take the time to let me know what you think about this. 💬
-------------------------------------------------------------------------
This is just my personal market idea and not financial advice! 📢 Trading gold and other financial instruments carries risks – only invest what you can afford to lose. Always do your own analysis, use solid risk management, and trade responsibly.
Good luck and safe trading! 🚀📊

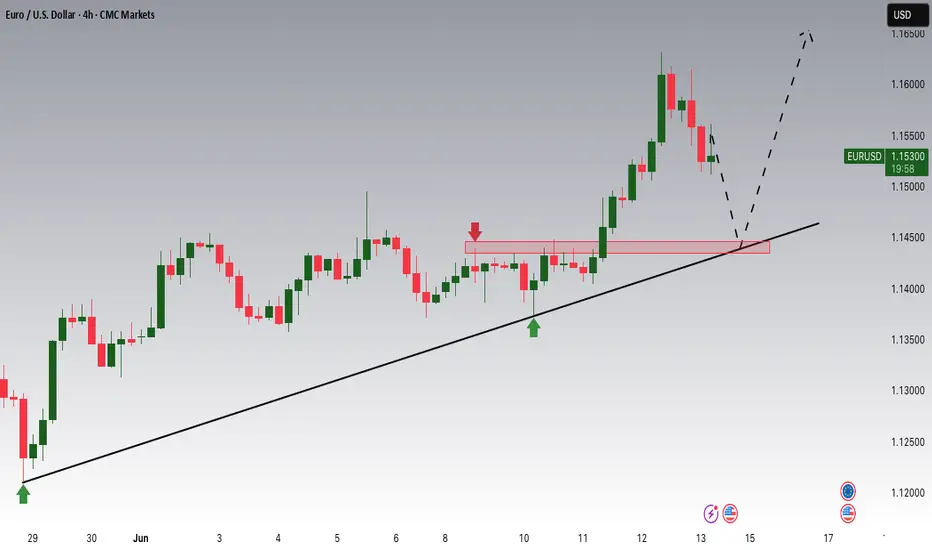
EURUSD Potential UpsidesHey Traders, in today's trading session we are monitoring EURUSD for a buying opportunity around 1.14500 zone, EURUSD is trading in an uptrend and currently is in a correction phase in which it is approaching the trend at 1.14500 support and resistance area.
Trade safe, Joe.
US30 BULLISH BIAS RIGHT NOW| LONG
US30 SIGNAL
Trade Direction: short
Entry Level: 42,200.7
Target Level: 42,556.5
Stop Loss: 41,963.5
RISK PROFILE
Risk level: medium
Suggested risk: 1%
Timeframe: 6h
Disclosure: I am part of Trade Nation's Influencer program and receive a monthly fee for using their TradingView charts in my analysis.
✅LIKE AND COMMENT MY IDEAS✅

XAUUSD FULL DAILY OUTLOOK — 16 JUNE 2025👋 Hello traders, welcome to a key week for gold.
The bullish expansion continues to unfold cleanly, following weeks of calculated breakout sequences.
After liquidating major liquidity pockets below 3120 earlier this year, gold shifted into controlled higher timeframe expansion.
The breakout above May’s consolidation confirms full bullish structure control. However, we are now entering premium exhaustion territory, where liquidity traps become increasingly dangerous for emotional traders.
This is where most fail — chasing late breakouts — but we stay patient and execute only inside clean zones.
🔎 STRUCTURE PROGRESSION
✅ Weekly BOS fully confirmed → higher timeframe bullish structure intact.
✅ Daily has printed higher lows at 3120 → 3246, leading to the recent higher high at 3448.
✅ Price is now extended into premium expansion.
✅ EMA 5/21/50 fully locked bullish — trend continuation bias.
✅ RSI remains firm but near extended levels.
✅ Fibonacci extensions above are now fully in play.
🎯 DAILY BIAS — 16 JUNE 2025
Primary bias remains bullish as long as price holds above 3355 structure.
Price sits inside premium expansion, where liquidity traps may unfold near 3448–3505.
Controlled pullbacks into 3405–3385 remain healthy for continuation, while deeper dips into 3325 open better risk-reward positioning.
Bullish continuation remains the base case, but aggressive premium sweeps before FOMC remain highly probable.
🔼 DAILY SUPPLY ZONES
Price Zone Context
3448 – 3460 Breakout premium supply (first liquidity trap zone)
3500 – 3505 1.272 Fibonacci extension — major liquidity pocket
3570 – 3575 1.618 Fibonacci extension — exhaustion premium trap
🔽 DAILY DEMAND ZONES
Price Zone Context
3405 – 3385 Shallow pullback liquidity zone
3355 – 3325 Main Daily OB demand — structure protection
3290 – 3255 Deep flush zone — extreme HL recalibration zone
⚠ THE BATTLE THIS WEEK
✅ Price may attempt premium sweeps above 3448 → 3505 before any deeper correction.
✅ Below 3385 lies the first reactive zone for controlled pullbacks.
✅ FOMC remains the dominant macro driver — liquidity will likely front-run into Wednesday.
✅ Patience is key — the market may trigger both traps before any clear directional expansion unfolds.
🔐 Mindset Reminder:
In premium we don't chase — we wait for the market to exhaust liquidity and show real intent.
Our job is not to predict reversals, but to execute once liquidity confirms displacement.
🚀 If this helped you build your map for the week, hit that 🚀, drop your thoughts below, follow for full sniper insights.
We trade clean. We execute precise.
— GoldFxMinds

XAUUSD Weekly Outlook 16-20 JuneHello traders 👋,
A powerful week ahead with extremely sensitive fundamentals in play.
🔎 Macro Fundamentals
🔥 FOMC rate decision + press conference coming up. This will set the tone for USD and risk markets.
🏦 FOMC statement + economic projections will guide the next dollar liquidity wave.
📊 Key US consumer data via Retail Sales and Core Retail Sales.
🏠 Housing sector updates: Permits, Starts, NAHB.
📈 Business inventories, Philly Fed, CB Leading Index, TIC flows.
⚠ Volatility expected to spike heavily mid-week during the Fed.
The market is positioned for liquidity grabs, with strong potential for traps both sides. Execution requires sniper discipline.
🔬 Technical Structure — Weekly Chart Context
Weekly bullish BOS confirmed.
Weak High sitting at 3448, currently challenged.
We are extended in premium territory after multiple bullish expansions.
Main premium OB zone: 3445 - 3465, highly reactive zone.
Discount demand stands lower around 3320 - 3280 and 3100 key weekly equilibrium.
EMAs remain fully locked bullish.
RSI approaching extended levels (71), risk of profit-taking spikes remains.
🎯 Key Weekly Levels
Type Zone Comment
🔼 Resistance 3445 – 3465 Active premium trap zone
🔼 Resistance 3502 1.272 Fibonacci extension
🔼 Resistance 3572 1.618 Fibonacci extension
🔼 Resistance 3649 2.0 Fibonacci extension
🔽 Support 3320 – 3280 Last valid weekly OB
🔽 Support 3100 Weekly equilibrium & demand
🧭 Weekly Bias
🔧 Primary bias: bullish continuation still intact while weekly structure remains protected. Watch for sweeps above 3445-3465.
🔧 Potential correction risk from high-impact fundamentals (FOMC). Buy dips if structure holds.
🔥 If you enjoy this clean breakdown: hit that 🚀, follow & drop your thoughts below!
Stay sharp traders — we execute with precision.
— GoldFxMinds

AUDUSD Potential UpsidesHey Traders, in the coming week we are monitoring AUDUSD for a buying opportunity around 0.64500 zone, AUDUSD is trading in an uptrend and currently is in a correction phase in which it is approaching the trend at 0.64500 support and resistance area.
Trade safe, Joe.

GE Vernova Inc. (GEV) – Powering the Global Energy TransitionCompany Overview:
GE Vernova NYSE:GEV is becoming a cornerstone of the global clean energy shift, providing advanced power generation, transmission, and renewable energy technologies that are now mission-critical for national energy strategies.
Key Catalysts:
Explosive Electrification Growth ⚡
Grid Solutions backlog tripled YoY, driven by demand for modern, resilient, and clean grids.
HVDC & FACTS technologies place GEV at the forefront of a global multi-decade grid overhaul.
Recurring Revenue from Wind Repowering 🌬️
1 GW of upgraded capacity in 2024 under the Repower program.
GEV operates the most widely installed wind platform in the U.S., giving it dominance in the high-margin retrofit market.
Strategic Manufacturing Expansion 🏭
$600M+ in investments across Florida and India expand capacity and de-risk the supply chain.
Supports global demand from infrastructure stimulus and decarbonization mandates.
Investment Outlook:
Bullish Case: We are bullish on GEV above $410.00–$415.00, as clean energy investment accelerates.
Upside Potential: Price target of $600.00–$610.00, backed by order momentum, retrofit leadership, and global energy reform.
🔋 GE Vernova – Electrifying the Future. #GEV #CleanEnergy #GridModernization #WindPower

New Highs for Gold = New bull RunHere it is!! the breakout I been talking about in my other updates. doing it on a Friday cause Israel is starting ish! Sitting this out cause it can get volatile.

Teva: The flag’s ready — someone just needs to hit “launch”Teva Pharmaceutical (TEVA) is setting up for a potential continuation move after a clean impulse. On the daily chart, we have a textbook bull pennant — and not just any sloppy one. Price has broken above the 200-day moving average, and all key EMAs (50/100/200) now sit below price, confirming a solid bullish structure.
Volume behavior fits the script: declining inside the pennant, signaling pressure is building. More importantly, the Volume Profile reveals a low-volume void above current levels — meaning there’s little resistance until we hit the $22+ zone. In other words, once this breaks, it could run fast.
RSI is comfortably in bullish territory without being overheated, and the flagpole projection gives us clean upside targets:
– Entry: breakout above pennant resistance
– Target: $22.80 — full flagpole height
– Support: $17.60 — confluence of 0.5 Fib + volume base
TEVA isn’t asking for confirmation anymore — it’s showing it. All systems are technically armed. Now we just wait for the market to press the button.
