GBPUSD Potential UpsidesHey Traders, in today's trading session we are monitoring GBPUSD for a buying opportunity around 1.35400 zone, GBPUSD is trading in an uptrend and currently is in a correction phase in which it is approaching the trend at 1.35400 support and resistance area.
Trade safe, Joe.
Bullish Patterns

LINK Long Setup – Retrace to Key Support After Strong RallyLINK saw a strong rally from April to mid-May, and is now undergoing a healthy retracement. Price is approaching the $13.00–$13.50 support zone, offering a potential long spot entry as the market cools.
📌 Trade Setup:
• Entry Zone: $13.00 – $13.50
• Take Profit Targets:
o 🥇 $15.00 – $16.00
o 🥈 $17.00 – $18.00
• Stop Loss: Daily close below $12.00

Kiniksa (KNSA) – Rare Disease Revenue & Pipeline Momentum Company Overview:
Kiniksa NASDAQ:KNSA is establishing itself as a high-growth biopharma player, with a sharp focus on autoimmune and inflammatory diseases. The company’s strategy is paying off through commercial execution and a robust, de-risked pipeline.
Key Catalysts:
🏆 Arcalyst Commercial Success
Core driver in recurrent pericarditis treatment
Delivering double-digit YoY revenue growth
Expanding potential in broader inflammatory indications
🧬 Deep Clinical Pipeline
KPL-404 (anti-CD40): Targets autoimmune diseases like lupus and rheumatoid arthritis
Mavrilimumab: Late-stage potential in rare inflammatory conditions
Orphan Drug & Breakthrough Therapy designations → accelerated approvals + exclusivity
📊 Strong Earnings Momentum
Recent beat on both revenue and EPS
Reinforces credibility in commercial & clinical execution
May attract institutional investors and technical breakout traders
Investment Outlook:
✅ Bullish Above: $23.00–$24.00
🎯 Target Price: $38.00–$40.00
📈 Thesis Drivers: Proven revenue engine (Arcalyst), high-potential pipeline, regulatory tailwinds, and institutional attention
🔬 Kiniksa is not just a clinical-stage story—it's a commercial growth engine with rare disease upside. #KNSA #BiotechStocks #RareDisease

GBP/NZD LONG FROM SUPPORT
GBP/NZD SIGNAL
Trade Direction: long
Entry Level: 2.245
Target Level: 2.268
Stop Loss: 2.229
RISK PROFILE
Risk level: medium
Suggested risk: 1%
Timeframe: 12h
Disclosure: I am part of Trade Nation's Influencer program and receive a monthly fee for using their TradingView charts in my analysis.
✅LIKE AND COMMENT MY IDEAS✅

GBP/AUD BULLS WILL DOMINATE THE MARKET|LONG
Hello, Friends!
GBP/AUD is making a bearish pullback on the 6H TF and is nearing the support line below while we are generally bullish biased on the pair due to our previous 1W candle analysis, thus making a trend-following long a good option for us with the target being the 2.095 level.
Disclosure: I am part of Trade Nation's Influencer program and receive a monthly fee for using their TradingView charts in my analysis.
✅LIKE AND COMMENT MY IDEAS✅

EUR/GBP BULLS WILL DOMINATE THE MARKET|LONG
EUR/GBP SIGNAL
Trade Direction: long
Entry Level: 0.837
Target Level: 0.843
Stop Loss: 0.832
RISK PROFILE
Risk level: medium
Suggested risk: 1%
Timeframe: 9h
Disclosure: I am part of Trade Nation's Influencer program and receive a monthly fee for using their TradingView charts in my analysis.
✅LIKE AND COMMENT MY IDEAS✅

EUR/CHF BULLISH BIAS RIGHT NOW| LONG
EUR/CHF SIGNAL
Trade Direction: long
Entry Level: 0.933
Target Level: 0.936
Stop Loss: 0.931
RISK PROFILE
Risk level: medium
Suggested risk: 1%
Timeframe: 2h
Disclosure: I am part of Trade Nation's Influencer program and receive a monthly fee for using their TradingView charts in my analysis.
✅LIKE AND COMMENT MY IDEAS✅

GBP/CHF BULLS ARE GAINING STRENGTH|LONG
Hello, Friends!
GBP/CHF is trending up which is obvious from the green colour of the previous weekly candle. However, the price has locally plunged into the oversold territory. Which can be told from its proximity to the BB lower band. Which presents a classical trend following opportunity for a long trade from the support line below towards the supply level of 1.112.
Disclosure: I am part of Trade Nation's Influencer program and receive a monthly fee for using their TradingView charts in my analysis.
✅LIKE AND COMMENT MY IDEAS✅

Nightly $SPY / $SPX Scenarios for June 5, 2025🔮 Nightly AMEX:SPY / SP:SPX Scenarios for June 5, 2025 🔮
🌍 Market-Moving News 🌍
🇺🇸 JOLTS Job Openings Surprise to Upside
U.S. job openings unexpectedly rose to 7.39 million in April—well above forecasts—indicating that labor demand remains robust despite macro headwinds and trade-policy uncertainty
🛢️ OPEC+ Greenlights July Supply Increase
OPEC+ agreed to boost production by 411 K barrels per day starting in July, adding downward pressure to oil prices and weighing on energy equities
📈 Fed’s John Williams Signals Patience
New York Fed President John Williams reiterated that the Fed sees no urgency to cut rates, citing mixed inflation signals and a balanced labor market—keeping investors cautious on rate-cut timing
📊 Key Data Releases 📊
📅 Thursday, June 5:
8:30 AM ET – JOLTS Job Openings (April)
Measures total U.S. job vacancies, a leading indicator of labor-market strength.
10:00 AM ET – OPEC+ Press Conference (Post-Meeting)
Details on production quotas for July, guiding energy market supply expectations.
⚠️ Disclaimer:
This information is for educational and informational purposes only and should not be construed as financial advice. Always consult a licensed financial advisor before making investment decisions.
📌 #trading #stockmarket #economy #news #trendtao #charting #technicalanalysis

COMP/USDT Breakout Alert !!COMPUSDT has broken out of a long-term downtrend line on the daily timeframe, signaling a potential bullish reversal.
Chart Analysis:
Downtrend line broken with a strong bullish candle
RSI recovering to 57.28 — showing improving momentum
Price holding above local support near $36.41
Key Levels:
Support: $36.41
Resistance Levels / Targets:
Target 1: $54.68
Target 2: $89.71
Final Target: $123.13
Bias: Bullish — as long as price sustains above the downtrend line and holds support
Timeframe: 1D
Strategy: Watch for retest of breakout zone ($43–$45) as potential entry, with targets as mentioned.
This is not financial advice, please research before investing, as we are not responsible for any of your losses or profits.
Please like, share, and comment on this idea if you liked it.
#COMPUSDT #CryptoTrading #TechnicalAnalysis #Altcoins #Breakout #BullishSetup

EURUSD Breakout and Potential RetraceHey Traders, in today's trading session we are monitoring EURUSD for a buying opportunity around 1.13700 zone, EURUSD was trading in a downtrend and successfully managed to break it out. Currently is in a correction phase in which it is approaching the retrace area at 1.13700 support and resistance area.
Trade safe, Joe.

AUDUSD Breakout and Potential RetraceHey Traders, in today's trading session we are monitoring AUDUSD for a buying opportunity around 0.64900 zone, AUDUSD was trading in a downtrend and successfully managed to break it out. Currently is in a correction phase in which it is approaching the retrace area at 0.64900 support and resistance zone.
Trade safe, Joe.

NuScale Power Corp. (SMR) – Leading the Nuclear RenaissanceCompany Overview:
NuScale NYSE:SMR is pioneering small modular reactor (SMR) technology—offering a scalable, carbon-free solution for baseload energy at a time when AI, quantum computing, and data centers are driving unprecedented power demand.
Key Catalysts:
Regulatory Leadership 🏛️
Only SMR design approved by the U.S. Nuclear Regulatory Commission (NRC) ✅
Creates a regulatory moat—a multi-year head start over competitors
Enhances institutional credibility and accelerates deployment
Global Flagship Project: RoPower, Romania 🇷🇴
462 MW project → pre-orders already underway
Final investment decision by year-end could validate tech and unlock global markets
First major deployment in Europe signals international expansion readiness
Explosive Growth Outlook 🚀
77% forecasted revenue CAGR through 2025 vs. industry avg of 8.3%
62% reduction in per-share losses expected → strong operating leverage
Positioned to meet clean energy mandates and private sector demands for resilient, low-carbon power
Investment Outlook:
✅ Bullish Above: $27.00–$28.00
🎯 Price Target: $48.00–$50.00
📈 Thesis Drivers: First-mover advantage, regulatory approval, and global SMR project pipeline
⚛️ NuScale isn’t just building reactors—it’s building the future of energy. #SMR #NuclearEnergy #CleanPower

GOLD - Third Wave Next!Hello TradingView Family / Fellow Traders. This is Richard, also known as theSignalyst.
📈After breaking above the $3,330 structure, GOLD's momentum shifted to bullish again from a short-term perspective.
Moreover, the $3,310 is a strong demand as Gold made an explosive movement from it.
🏹 Thus, the highlighted blue circle is a strong area to look for buy setups as it is the intersection of support, demand and red trendline acting as a non-horizontal support.
📚 As per my trading style:
As #XAUUSD retests the blue circle zone, I will be looking for bullish reversal setups (like a double bottom pattern, trendline break , and so on...)
📚 Always follow your trading plan regarding entry, risk management, and trade management.
Good luck!
All Strategies Are Good; If Managed Properly!
~Rich
Disclosure: I am part of Trade Nation's Influencer program and receive a monthly fee for using their TradingView charts in my analysis.

GU Bulls Raise "Flag" Eyeing Higher PricesFX:GBPUSD has formed a Bull Flag and we could be getting ready to see the Bulls take the spotlight!
After Price broke through the Previous Level of Structure, Price retraces the High of 1.35589 to the 50% Fibonacci Level @ 1.35022 and is supported pushing Price back up from the Previous Level of Structure.
-The 50% retracement signals the end of the Consolidation Phase of the Pattern.
Now with a Bull Flag being a Continuation Pattern, we can suspect that Price will give us a Bullish Breakout of the Descending Channel and Retest before moving higher Confirming the Pattern and once the Breakout is Validated!
Based off the "Flagpole" of the Pattern, if a Bullish Breakout is Validated and the Retest is Successful, the extension of the Set-up would place the Price Target @ 1.3640 which is at the next big level of Resistance.

NXPC/USDT: FALLING WEDGE BREAKOUT ALERT!!NXPC Breakout Alert – 100%+ Potential on the Table
Hey Traders — if you're into high-conviction setups with real momentum, this one’s for you.
NXPC has broken out of a falling wedge pattern on the 4H timeframe and is now retesting the breakout zone. As long as it holds above the green support box, a strong upside move remains likely.
Entry Range: $1.38 – $1.44
Targets: $1.70 / $2.30 / $2.70 / $3.10
Stop-loss: $1.26
Leverage: Use low leverage (Max 5x)
This setup has the potential to kick off a powerful rally.
Keep it on your radar and trade with discipline.
Let me know if you're in this one or watching from the sidelines.

GOLD (XAUUSD) 1H Chart | Bullish Breakout Idea With Key Zones > "Gold is showing strong bullish structure on the 1H timeframe. Price is approaching key breakout zones with momentum building. This idea highlights critical support/resistance levels and potential breakout targets. Watch for confirmation before entry."
This is just idea not a financial advice !

PENDLE – Bullish Continuation Setup from Key Support ZonePENDLE remains one of the standout performers in the crypto space, maintaining its bullish market structure even amid broader market uncertainty. With price currently holding well above key support, this presents a favorable opportunity for a swing long position, especially if the broader market stabilizes.
📥 Entry Zone:
$3.50 – $4.30
🔹 Confluence with previous resistance turned support
🔹 Demand zone within bullish structure
🔹 Ideal for scaling in
🎯 Take Profit Targets:
🥇 $5.45
🥈 $6.30
🥉 $6.85
🛑 Stop Loss:
Daily close below $3.00
Structure breakdown

RNDR (Render) – Higher Low Setup for Potential Upside ExpansionRENDER is holding strong above the $3.50–$4.00 support zone, forming what appears to be a higher low — a classic sign of potential trend continuation. This setup provides a favorable risk-to-reward ratio with clearly defined invalidation and upside targets.
📥 Entry Zone:
$3.50 – $4.00
🔸 Holding above demand
🔸 Prior resistance now acting as support
🔸 Potential higher low setup
🎯 Take Profit Targets:
🥇 $6.00 – Previous local top / liquidity pocket
🥈 $8.00 – Major resistance zone from prior cycle
🥉 $10.00 – Psychological round number + HTF extension target
🛑 Stop Loss:
Daily close below $2.50
Clears invalidation of the structure
Below HTF support base

AUD/NZD SENDS CLEAR BULLISH SIGNALS|LONG
Hello, Friends!
AUD/NZD pair is trading in a local downtrend which we know by looking at the previous 1W candle which is red. On the 1D timeframe the pair is going down too. The pair is oversold because the price is close to the lower band of the BB indicator. So we are looking to buy the pair with the lower BB line acting as support. The next target is 1.089 area.
Disclosure: I am part of Trade Nation's Influencer program and receive a monthly fee for using their TradingView charts in my analysis.
✅LIKE AND COMMENT MY IDEAS✅

DEXE/USDT: FALLING WEDGE BREAKOUT!!DEXE Breakout Alert – 80% Move Loading?
Hey Traders! If you're into high-conviction plays and real alpha — hit that like and tap Follow for trade setups that actually deliver.
DEXE has broken out of a falling wedge pattern on the daily timeframe and has successfully retested the breakout level. The structure looks strong, and momentum is starting to build.
Entry Zone: $13.4 – $14.4
Targets: $16.1 / $18.2 / $21.2 / $24.4
Stop-loss: $12.60
Leverage: Use low leverage (Max 5x)
This could be the beginning of a powerful upward move.
Keep this setup on your radar and manage risk accordingly.
Let me know your thoughts or if you're riding this one too.

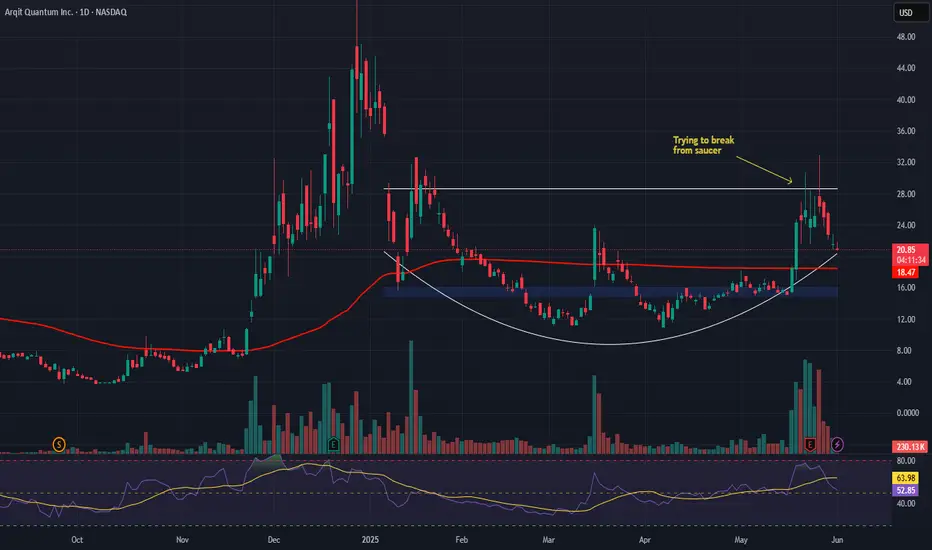
Arqit Quantum Inc. (ARQQ) – Securing the Future of DataCompany Overview:
Arqit NASDAQ:ARQQ is redefining cybersecurity by offering quantum-resilient encryption solutions—future-proofing critical communications infrastructure for governments, enterprises, and hyperscale cloud networks.
Key Catalysts:
Strategic Acquisition of Ampliphae 📡
Adds a powerful risk management suite + experienced innovation team
Expands Arqit’s capability to serve end-to-end encryption needs across cloud, edge, and IoT systems
Government Validation & Traction 🏛️
Multi-year license deal with a government client in EMEA
Signals institutional confidence, even with deferred revenue accounting
Quantum Threat = Rising Demand 📈
As quantum computing advances, the need for quantum-safe encryption becomes urgent
Arqit’s cloud-based QKD platform is uniquely suited to meet these demands at scale
Enterprise-Grade Solutions 🌐
Positioned to become a go-to cybersecurity partner for mission-critical infrastructure in a post-quantum world
Targeting global clients across finance, defense, telecom, and more
Investment Outlook:
✅ Bullish Above: $15.00–$16.00
🚀 Upside Target: $43.00–$44.00
🔒 Key Drivers: Strategic M&A, government adoption, quantum-resilient tech, first-mover advantage
Arqit isn’t just building encryption—it’s building the cybersecurity foundation for the quantum era. #ARQQ #QuantumSecurity #FutureProof
Crypto Market Slows Down For A Correction Within UptrendCrypto market nicely slowed down as expected and Crypto TOTAL market cap chart can now be finishing a projected wave 4 correction right at the former wave "iv" swing low and channel support line, which is ideal textbook technical picture that can now send the Crypto market higher for wave 5, especially if bounces back above 3.3T area and channel resistance line.
However, even if it's going to face deeper and more complex correction within higher degre wave (2) down to 3.0T - 2.8T area, sooner or later we can expect a bullish continuation, as Crypto TOTAL market cap chart is not at the all-time highs yet.
