ETH/USDT – Breaking Out After BTC!🚀 Hey Traders! 👋
If you’re finding value in this analysis, smash that 👍 and hit Follow for high-accuracy trade setups that actually deliver! 💹🔥
After BTC’s rally, it’s ETH’s turn to shine! 🔥
Ethereum has officially broken out of the descending channel on the 12H timeframe, a structure that’s been holding price down since late 2024. This breakout is significant — and here’s why:
📊 Technical Breakdown:
🔸 Broadening wedge finally broken after months of compression
🔸 Price holding well above the EMA, confirming short-term bullish momentum
🔸 Strong volume on breakout candle, suggesting genuine buying pressure
🔸 Breakout coincides with BTC’s surge — signaling altcoin rotation could be starting
📍 Key Levels:
➡️ Immediate Resistance: $2,850
➡️ Short Term Target Zone: $3,200–$3,500
➡️ Major Target Zone: $5000
➡️ Support to Watch: $2,480 (EMA + breakout retest)
💡 Why It Matters:
This move isn’t just technical — it’s psychological. ETH has been lagging BTC for weeks, and this breakout could shift trader sentiment back toward altcoins. If ETH holds above the breakout zone, we may see altcoins gain serious traction in the coming days.
📌 Strategy Note:
Look for a successful retest of the breakout zone for confirmation. A strong daily close above $2,700 could pave the way for a sustained uptrend.
What’s your ETH price prediction? Drop it in the comments and let’s ride this momentum together! 💥
Bullish Patterns

BUY AUDUSDIn todays trading session we are monitoring AUDUSD for buying opportunities. Our entries are at 0.64236 and our targets are as high as 0.65611 all the way to 0.6600 (Yes you read that right!). Our current stops are at 0.63900. Use proper risk management.

SUI/USDT Potential UpsidesHey Traders, in today's trading session we are monitoring SUI/USDT for a buying opportunity around 3.85 zone, SUI/USDT is trading in an uptrend and currently is in a correction phase in which it is approaching the trend at 3.85 support and resistance area.
Trade safe, Joe.

ETH/USDT Potential UpsidesHey Traders. in today's trading session we are monitoring ETH/USDT for a buying opportunity around 2420 zone, Ethereum is trading in an uptrend and currently is in a correction phase in which it is approaching the trend at 2420 support and resistance area.
Trade safe, Joe.

MAGIC/USDT – From Consolidation to Explosion?🚀 MAGIC Bull Flag Formation – 200% Potential Incoming?! 👀🔥
Hey Traders! If you're all about high-conviction plays and real alpha, smash that 👍 and tap Follow for more setups that actually deliver! 💹💯
MAGIC is showing strong signs of a breakout from the descending channel on the 4H timeframe. After consolidating inside the channel for weeks, it has now approached the upper boundary and is testing it with bullish momentum supported by the EMA.
🟢 Long Position Activated
🔹 Breakout Confirmation waaiting
🔹 Volume Picking Up 📊
🔹 EMA Flip Incoming 🔄
🎯 Targets:
TP1: $0.25
TP2: $0.31
TP3: $0.39
TP4: $0.46+
🛑 Stop-loss: $0.151
📌 Leverage: 5x max
💡 A clean breakout from here can lead to a massive move—just like last time with a 273% pump! Don’t sleep on this one.

NEAR is here to stay!Hello TradingView Family / Fellow Traders. This is Richard, also known as theSignalyst.
After breaking above the falling wedge pattern, CBOE:NEAR has been overall bullish, trading within a rising broadening wedge 🔼 marked in blue and red.
📉 As it approaches the lower bound of the wedge — which perfectly intersects with the green support zone — we’ll be watching for short-term long opportunities 🎯.
From a long-term perspective, for the bulls to fully take control, a break above the $3.6 resistance is needed to confirm the next bullish wave 🚀.
📚 Always follow your trading plan regarding entry, risk management, and trade management.
Good luck!
All Strategies Are Good; If Managed Properly!
~Rich

USDCHF - Bulls Are Almost Ready! Are You?Hello TradingView Family / Fellow Traders. This is Richard, also known as theSignalyst.
📈USDCHF has been overall bullish trading within the rising channel marked in blue.
Moreover, the green zone is a strong support and structure!
🏹 Thus, the highlighted blue circle is a strong area to look for buy setups as it is the intersection of support and lower blue trendline acting as a non-horizontal support.
📚 As per my trading style:
As #USDCHF is around the blue circle zone, I will be looking for bullish reversal setups (like a double bottom pattern, trendline break , and so on...)
📚 Always follow your trading plan regarding entry, risk management, and trade management.
Good luck!
All Strategies Are Good; If Managed Properly!
~Rich
Disclosure: I am part of Trade Nation's Influencer program and receive a monthly fee for using their TradingView charts in my analysis.

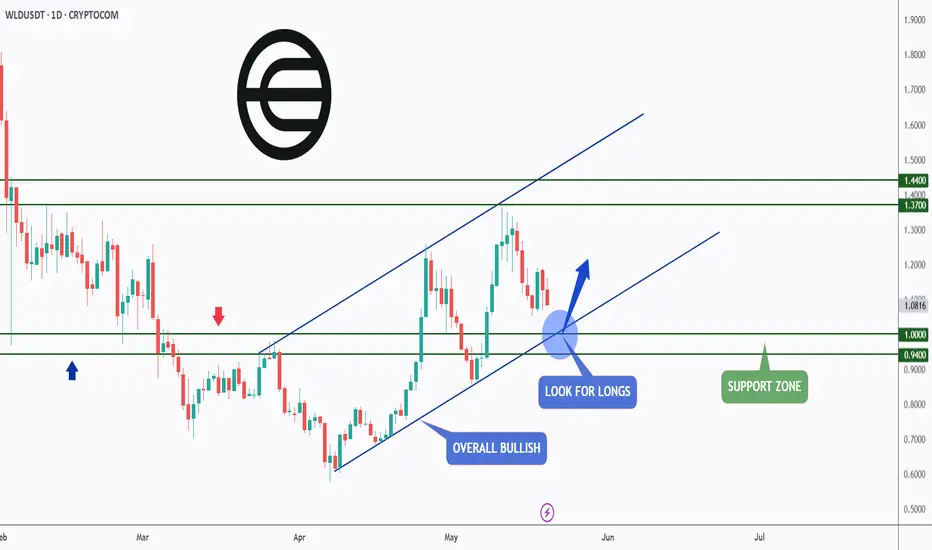
WLD - AI Cycle Is Back!Hello TradingView Family / Fellow Traders. This is Richard, also known as theSignalyst.
📈WLD has been in a correction phase. However it is still overall bullish long-term trading within the rising channel marked in blue.
Moreover, the green zone is a strong support and round number $1.
🏹 Thus, the highlighted blue circle is a strong area to look for buy setups as it is the intersection of support and lower blue trendline acting non-horizontal support.
📚 As per my trading style:
As #WLD retests the blue circle zone, I will be looking for bullish reversal setups (like a double bottom pattern, trendline break , and so on...)
📚 Always follow your trading plan regarding entry, risk management, and trade management.
Good luck!
All Strategies Are Good; If Managed Properly!
~Rich
USD/CAD BUYERS WILL DOMINATE THE MARKET|LONG
Hello, Friends!
We are targeting the 1.400 level area with our long trade on USD/CAD which is based on the fact that the pair is oversold on the BB band scale and is also approaching a support line below thus going us a good entry option.
Disclosure: I am part of Trade Nation's Influencer program and receive a monthly fee for using their TradingView charts in my analysis.
✅LIKE AND COMMENT MY IDEAS✅

$ETH / $BTC Inverse Head and Shoulders Confirmed! NGL pretty much every chart i'm looking at rn looks crazy bullish 🐂
Inverse Head and Shoulder confirmed on ETH / BTC 🤯
The real test comes at the 200DMA as CRYPTOCAP:ETH has not traded above it in the past 307 days.

$BTC Historic Daily Close Above ATH - Pullback Warning*HISTORIC Daily Close for ₿itcoin marking a new ATH 🥇
Some hefty volume poured in as the Golden Cross nears.
If CRYPTOCAP:BTC breaks down from this impulsive trend we should see a pullback to the .786 Fib ~$102k to confirm this new ATH.
Bulls need the Weekly Close above $109k to prevent that.
Nonetheless, this confirms the start of the parabola I’ve mentioned over the past month in my analysis 💯
Next big target is the 1.618 Fib ~$130k 🤑
Congrats Hodlers 🥳

$IREN has the lowest all-in cost of mining a single coinNASDAQ:IREN is mining a single bitcoin at $40,000 all-in costs. When bitcoin appreciates to $150-200k, the miners with their rigs, land, infrastructure, balance sheet, hardware etc will be repriced higher. Thats the gain I would like to capture with this entry here at $9 a share.
This phenomenon will be seen throughout the entire sector, all miners will appreciate from here.

Bitcoin Potential UpsidesHey Traders, in today's trading session we are monitoring BTC/USDT for a buying opportunity around 102,000 zone, Bitcoin is trading in an uptrend and currently is in a correction phase in which it is approaching the trend at 102,000 support and resistance area.
Trade safe, Joe.

KAS (Kaspa) – Long Swing Setup from Key SupportKAS is retracing into a key support zone around $0.108, which has previously acted as a springboard for bullish reversals. This level aligns with a potential higher low structure on the daily chart, and offers a favorable risk/reward setup for a swing long.
🔹 Entry Zone:
$0.108
🎯 Take Profit Targets:
🥇 $0.13 – $0.154
🥈 $0.175 – $0.19
🛑 Stop Loss:
Just below $0.097 (breakdown below support invalidates setup)

Gold Completes A Correction Within Bullish TrendGold made another sharp leg to the upside in first half of April, even showed some accelerating price action away from the 3,000 level. This suggests it might have been part of wave three when looking at the Daily and 4-hour time frame, so there can be more upside within a much more extended impulse structure. Possibly already now after blue wave four consolidation shows first signs of a bottom near 3120. Notice that pullback from recent high is in three legs, while price recovered out of wave (C) channel, so looks like new recovery is in the cards.

Gold is Giving up Set ups this week! Lets get it!Nice run up yesterday. Looking for it to continue. Want to see a nice pull back to give us entry for it to continue. Its a waiting game to wait for the killzones for best entries!

TRUMP is Back on the Move! Breakout Trade Setup Inside!!🚀 TRUMP Bull Pennant Breakout – 40% Potential Incoming?! 👀🔥
Hey Traders! If you're all about high-conviction plays and real alpha, smash that 👍 and tap Follow for more setups that actually deliver! 💹💯
TRUMP is breaking out of a symmetrical triangle in the 4H time frame — signaling the potential for a massive upside move! The last time we saw similar consolidation, it exploded with over 40% gains.
📈 Entry: Current Market Price
🎯 Target: $18.70+
🛑 Stop Loss: $12.58
Lev: Use low lev (Max 5x)
📊 Risk/Reward: High-reward setup for breakout traders
🔥 With momentum building and volume picking up, this setup could deliver strong returns if the breakout sustains.
💬 What are your thoughts on this move? Are you trading $TRUMP?

ADA (Cardano) – Long Swing Setup from Major Support ZoneADA is currently trading within a critical support area ($0.71–$0.73), offering a compelling higher low opportunity. With BTC holding strength, ADA may be gearing up for a rebound, particularly if it maintains structure above the support.
🔹 Entry Zone:
$0.71 – $0.73
🎯 Take Profit Targets:
🥇 $0.80 – $0.84
🥈 $0.98 – $1.02
🛑 Stop Loss:
Daily close below $0.66 (loss of higher low and structural invalidation)

doge buy midterm"🌟 Welcome to Golden Candle! 🌟
We're a team of 📈 passionate traders 📉 who love sharing our 🔍 technical analysis insights 🔎 with the TradingView community. 🌎
Our goal is to provide 💡 valuable perspectives 💡 on market trends and patterns, but 🚫 please note that our analyses are not intended as buy or sell recommendations. 🚫
Instead, they reflect our own 💭 personal attitudes and thoughts. 💭
Follow along and 📚 learn 📚 from our analyses! 📊💡"

LINK (Chainlink) – Breakout Setup Aligned With BTC Macro MoveWith BTC on the verge of a new all-time high, the market is poised for high-beta altcoins like LINK to follow with strength. LINK is currently testing the 200-day EMA — a critical momentum indicator. If BTC confirms breakout and LINK holds this zone, it sets up a high-probability continuation play.
🔹 Entry Zone:
$16 (on confirmation of support at 200-day EMA)
🎯 Take Profit Targets:
🥇 $20 (prior range high / psychological resistance)
🥈 $25 (multi-month breakout level)
🥉 $30 (macro extension target)
🛑 Stop Loss:
Daily close below $14.50 (breakdown of EMA support and invalidation of current structure)

POL/USDT Potential UpsidesHey Traders, in today's trading session we are monitoring POL/USDT for a buying opportunity around 0.2200 zone, POL/USDT is trading in an uptrend and currently is in a correction phase in which it is approaching the trend at 0.2200 support and resistance area.
Trade safe, Joe.

USDJPY - New Impulse Soon!Hello TradingView Family / Fellow Traders. This is Richard, also known as theSignalyst.
📈USDJPY has been overall bullish trading within the rising broadening wedge pattern marked in blue and it is currently hovering around the lower bound of it.
Moreover, the orange zone is a strong structure and support.
🏹 Thus, the highlighted blue circle is a strong area to look for buy setups as it is the intersection of structure and lower blue trendline acting as a non-horizontal support.
📚 As per my trading style:
As #USDJPY is around the blue circle zone, I will be looking for bullish reversal setups (like a double bottom pattern, trendline break , and so on...)
📈The bullish impulse will begin after a break above the last minor high and upper red trendline.
📚 Always follow your trading plan regarding entry, risk management, and trade management.
Good luck!
All Strategies Are Good; If Managed Properly!
~Rich
Disclosure: I am part of Trade Nation's Influencer program and receive a monthly fee for using their TradingView charts in my analysis.

NZDJPY - Off We Go... Again!Hello TradingView Family / Fellow Traders. This is Richard, also known as theSignalyst.
📈NZDJPY has been overall bullish trading within the rising channel marked in red.
Moreover, the green zone is a strong demand!
🏹 Thus, the highlighted blue circle is a strong area to look for buy setups as it is the intersection of demand and lower red trendline acting as a non-horizontal support.
📚 As per my trading style:
As #NZDJPY approaches the blue circle zone, I will be looking for bullish reversal setups (like a double bottom pattern, trendline break , and so on...)
📚 Always follow your trading plan regarding entry, risk management, and trade management.
Good luck!
All Strategies Are Good; If Managed Properly!
~Rich
Disclosure: I am part of Trade Nation's Influencer program and receive a monthly fee for using their TradingView charts in my analysis.
