USDCAD - BULLISH MOVEHello Traders !
The USDCAD price formed a descending triangle.
Currently, The Resistance line is broken !
So, I expect a bullish move🚀
______________
TARGET: 1.39260🎯
Bullish Patterns

KAS – Long Spot Trade Setup (Structural Recovery in Play)KAS is beginning to show early signs of reversal, reclaiming the 20-day SMA after forming a double bottom near the $0.087 zone. This signals a potential shift in momentum and offers a favorable risk-reward opportunity.
🔹 Entry Zone:
$0.087 – $0.094
🎯 Take Profit Targets:
🥇 $0.108 – $0.120
🥈 $0.133 – $0.154
🛑 Stop Loss:
Just below $0.080

ETH - Is $3,000 next?Today marked a significant milestone for Ethereum as it successfully rolled out its much-anticipated Pectra upgrade. The update, which introduces a number of technical enhancements aimed at improving scalability, security, and developer experience, has already had a noticeable impact on market sentiment. In the hours following the upgrade, Ethereum (ETH) surged more than 13%, breaking through key resistance levels and igniting fresh bullish momentum.
From a technical standpoint, ETH is currently breaking out of a descending wedge pattern, a structure often seen as a bullish reversal signal. The price action has decisively pushed through the wedge’s upper boundary, signaling a potential end to the recent downtrend. Additionally, ETH is now testing a significant resistance zone, often referred to as the "resistance box," which has historically served as a key battleground between bulls and bears.
Should Ethereum manage to secure a clean breakout above this resistance area with strong volume. The next major upside target lies around the $3,000 level, a psychologically and technically important price point. This move could mark the beginning of a larger bullish cycle if market conditions remain favorable and momentum continues to build.
With the broader crypto market showing signs of recovery and Ethereum's fundamentals strengthening post-upgrade, traders and investors alike will be closely watching to see whether ETH can sustain its breakout and confirm this bullish trend.
-------------------------------
Thanks for your support.
- Make sure to follow me so you don't miss out on the next analysis!
- Drop a like and leave a comment!

GOLD BEST PLACE TO BUY FROM|LONG
GOLD SIGNAL
Trade Direction: long
Entry Level: 3,341.45
Target Level: 3,414.79
Stop Loss: 3,292.55
RISK PROFILE
Risk level: medium
Suggested risk: 1%
Timeframe: 2h
Disclosure: I am part of Trade Nation's Influencer program and receive a monthly fee for using their TradingView charts in my analysis.
✅LIKE AND COMMENT MY IDEAS✅

EUR/JPY LONG FROM SUPPORT
Hello, Friends!
EUR/JPY is making a bearish pullback on the 3H TF and is nearing the support line below while we are generally bullish biased on the pair due to our previous 1W candle analysis, thus making a trend-following long a good option for us with the target being the 163.264 level.
Disclosure: I am part of Trade Nation's Influencer program and receive a monthly fee for using their TradingView charts in my analysis.
✅LIKE AND COMMENT MY IDEAS✅

BANK / USDT Long Trade Setup – Big Breakout Watch!🚀 BANK Breakout Alert – 100%+ Potential Incoming?! 👀🔥
Hey Traders! If you're all about high-conviction plays and real alpha, smash that 👍 and tap Follow for more setups that actually deliver! 💹💯
BSE:BANK has broken out of a massive symmetrical triangle on the 1H chart — signaling a potential continuation move after a long consolidation! ⚡📈
📌 Entry Zone: $0.0372 – $0.0390 (current breakout area)
🎯 Targets:
• Target 1 → $0.0450
• Target 2 → $0.0520
• Target 3 → $0.0600
Target 4 → $0.0720
Target 5 → $0.0820
🛡 Stop Loss (SL): $0.0350 (below breakout support)
🔑 Why this setup matters:
✅ Clean breakout after long consolidation
✅ Strong bullish volume on breakout
✅ Previous breakout gave +114% move!
⚠️ Always manage your risk — breakouts can retest!
💬 What’s your target on BSE:BANK ? Drop your thoughts below! 👇👇👇

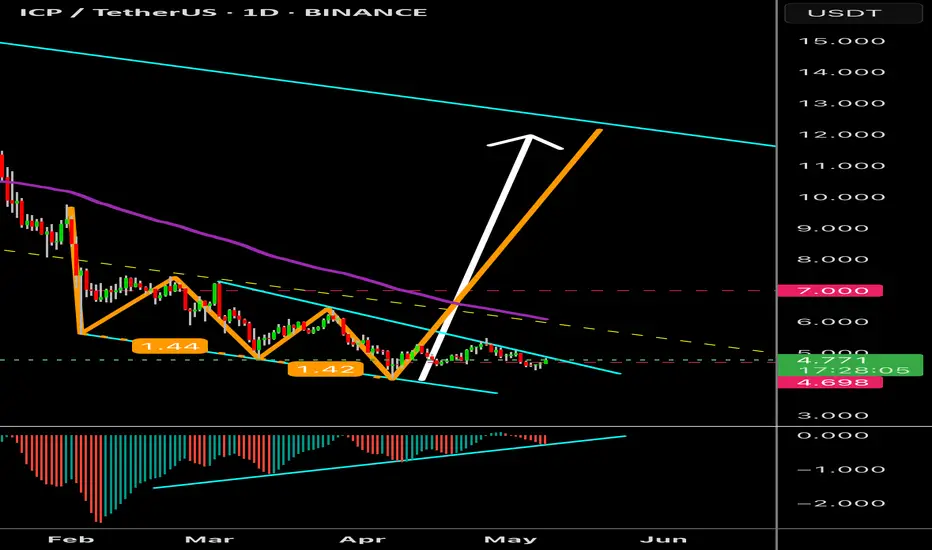
Potential Bullish 3 drive pattern in action We might see the results of a potential bullish 3 drive pattern, confirmation can be when price action breaks resistance of pattern, and support holds! Bullish divergence!
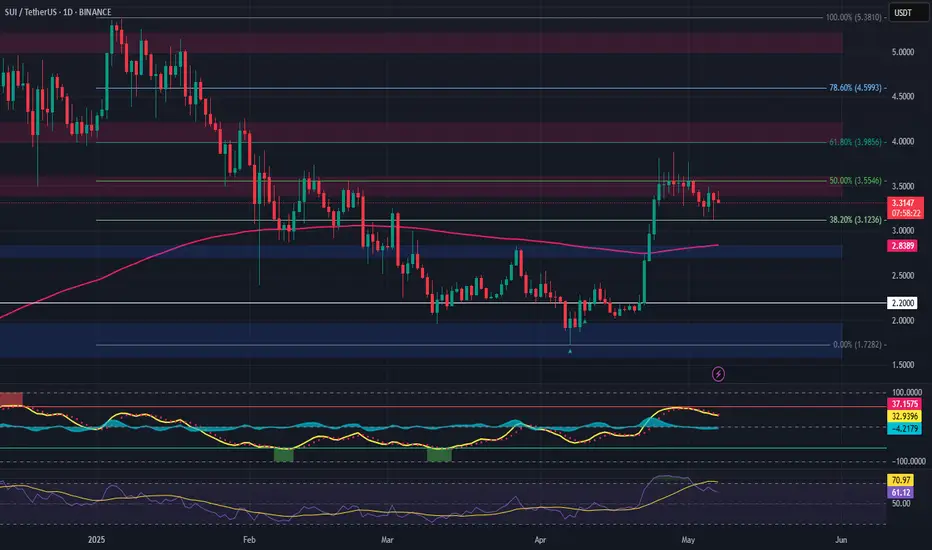
SUI – Long Trade Setup After Trend ReversalSUI has broken out of its downtrend, hitting all prior upside targets and now pulling back toward a key support area and the 200-day EMA, potentially forming a higher low—an ideal spot for re-entry.
🔹 Entry Zone:
Around $2.80
🎯 Take Profit Targets:
🥇 $3.40 – $3.60
🥈 $4.00 – $4.20
🥉 $5.00 – $5.20
🛑 Stop Loss:
Daily close below $2.20
📌 Strategy Notes:
Look for bullish confirmation (e.g., wick rejections, bullish engulfing candle) near $2.80
Structure remains intact as long as price holds above $2.20
EMA retests often precede strong continuation if trend strength remains
ADA (Cardano) – Long Spot Trade Setup at SupportCardano has pulled back to a key support zone around $0.66, providing a potential entry opportunity for a long spot position as the broader structure attempts to hold.
🔹 Entry Zone:
$0.66
🎯 Take Profit Targets:
🥇 $0.80 – $0.84
🥈 $0.98 – $1.02
🛑 Stop Loss:
Just below $0.59 (to protect against deeper breakdowns)

POPCAT Breakout Alert – Fresh Rally Incoming?🚀 POPCAT Breakout Alert – 60% Potential Incoming?! 👀🔥
Hey Traders! If you're all about high-conviction plays and real alpha, smash that 👍 and tap Follow for more setups that actually deliver! 💹💯
POPCAT has just broken out cleanly from its ascending triangle pattern on the 4H timeframe 🔥. This follows a strong consolidation phase after its last explosive move of 61% gains—and it’s looking primed for a fresh leg up! 📈
Key Levels:
💥 Entry: $0.416 and add more in dip
🎯 Targets:
1️⃣ $0.48
2️⃣ $0.55
3️⃣ $0.61+
🛡 Stop-loss: Below $0.378
Why I Like This Setup:
✅ Clear breakout from a textbook pattern
✅ Strong volume pickup
✅ Previous breakout history shows solid momentum
Keep your eyes on this one 👀—momentum could build fast! Let’s ride the trend 🚀

GBP/CHF BULLS ARE GAINING STRENGTH|LONG
GBP/CHF SIGNAL
Trade Direction: long
Entry Level: 1.098
Target Level: 1.103
Stop Loss: 1.095
RISK PROFILE
Risk level: medium
Suggested risk: 1%
Timeframe: 1h
Disclosure: I am part of Trade Nation's Influencer program and receive a monthly fee for using their TradingView charts in my analysis.
✅LIKE AND COMMENT MY IDEAS✅

GOLD BULLISH BIAS RIGHT NOW| LONG
GOLD SIGNAL
Trade Direction: long
Entry Level: 3,217.01
Target Level: 3,287.27
Stop Loss: 3,170.16
RISK PROFILE
Risk level: medium
Suggested risk: 1%
Timeframe: 3h
Disclosure: I am part of Trade Nation's Influencer program and receive a monthly fee for using their TradingView charts in my analysis.
✅LIKE AND COMMENT MY IDEAS✅

Morning Star To Wake GU TradersFX:GBPUSD has fallen into a Wedge Pattern after breaking Mondays Highs!
Price this morning has seemingly found Support at the 50% Retracement level signaling the potential ending of the Consolidation phase of the Wedge!
This Retracement comes in the form of a Morning Star, a strong Triple Candle Reversal Pattern!
If Price is supported in this area, we could see a Bullish Break to this Pattern delivering a Long Opportunities as a Break and Retest Set-up!

Price currently Bullish...But will it continue for the week?This is bullish price action i was expecting. Im just now waiting for a solid area for entry. Just have to wait for the killzones and things to line up inside of the killzone. cause outside of the killzones its nothing but chop and impulsive action that can throw you off.

AMD BULLISH MAY6TH 2025AMD has its earnings today & I am bullish as per the price action. I have managed my risk, and I am long irrespective of any news. I have discussed in depth analysis of AMD. If you have any questions, feel free to leave a comment below.
NOTE: I AM LONG ONLY WITH STOCKS

ETH (Ethereum)–High-Risk, High-Reward Setup Near Fair Value GapEthereum is showing early bullish signals within a broader downtrend, and a pullback toward the $1,700 zone—where it meets the underside fair value gap and 21-day moving average—may set the stage for a higher low and potential trend reversal.
🔹 Entry Zone:
$1,700
🎯 Take Profit Levels:
🥇 $2,000
🥈 $2,200
🥉 $2,400
🛑 Stop Loss:
$1,550 (below structure and invalidation point)

MOG (Mog Coin) Bounce Trade Setup – Early Recovery in PlayMOG is showing early reversal signs by reclaiming a key HTF support zone and forming a higher low near the 21-day moving average. This indicates a potential momentum shift and a solid bounce opportunity if follow-through volume confirms.
🔹 Entry Zone:
$0.00000060
🎯 Take Profit Levels:
🥇 $0.00000084
🥈 $0.00000110
🛑 Stop Loss:
$0.00000050 (below structure, protects against invalidation)

doge buy midterm "🌟 Welcome to Golden Candle! 🌟
We're a team of 📈 passionate traders 📉 who love sharing our 🔍 technical analysis insights 🔎 with the TradingView community. 🌎
Our goal is to provide 💡 valuable perspectives 💡 on market trends and patterns, but 🚫 please note that our analyses are not intended as buy or sell recommendations. 🚫
Instead, they reflect our own 💭 personal attitudes and thoughts. 💭
Follow along and 📚 learn 📚 from our analyses! 📊💡"

DOW JONES - BULLISH MOVE !Hello Traders !
The Dow Jones Index failed to create a new lower low
The price broke the higher high (Break of structure).
So, I expect a bullish move🚀
_______________
TARGET: 41600🎯

EURNZD - Strong Intersection!Hello TradingView Family / Fellow Traders. This is Richard, also known as theSignalyst.
📈EURNZD has been in a correction phase trading within the falling red channel and it is currently retesting the lower bound of the bullish channel marked in blue.
Moreover, the green zone is a strong structure and support zone.
🏹 Thus, the highlighted blue circle is a strong area to look for buy setups as it is the intersection of structure and lower blue and red trendlines acting as non-horizontal support.
📚 As per my trading style:
As #EURNZD approaches the blue circle, I will be looking for bullish reversal setups (like a double bottom pattern, trendline break , and so on...)
📚 Always follow your trading plan regarding entry, risk management, and trade management.
Good luck!
All Strategies Are Good; If Managed Properly!
~Rich
Disclosure: I am part of Trade Nation's Influencer program and receive a monthly fee for using their TradingView charts in my analysis.

Bullish Breakout for Gold???Waiting to see what they want to do. Price was bullish all day yesterday and Im trying to see if they want to give a pullback before continuing with the action. I know its best to just wait for the killzone to get the best entry.

FORM / USDT Long Setup – Major Breakout Alert!🚀 FORM Breakout Alert – 50% Potential Incoming?! 👀🔥
Hey Traders! If you're all about high-conviction plays and real alpha, smash that 👍 and tap Follow for more setups that actually deliver! 💹💯
FORM has officially broken out of a massive symmetrical triangle on the 4H chart after weeks of tight consolidation. This is a classic technical setup that often leads to explosive moves, and the market is starting to pay attention! ⚡📈
📍 Entry Zone: $2.12 – $2.16
✅ Entry around the current breakout zone to catch early momentum.
🎯 Targets:
• Target 1 → $2.60 (key horizontal resistance)
• Target 2 → $2.90 (major breakout extension zone)
• Target 3 → $3.10+ (blue-sky breakout level)
🛡 Stop Loss (SL): $2.06 (just below the lower trendline and support zone)
💥 Why this setup is exciting:
✅ Clean triangle breakout after multi-week compression
✅ Strong historical pattern — last breakout ran over +50%
✅ EMA alignment turning bullish
✅ Volume spike on breakout confirmation
✅ Market sentiment improving with higher lows on the chart
🔑 Pro Trading Tips:
Watch for a retest of the $2.15 breakout zone — it may offer a second-chance entry.
Scale out profits gradually at each target zone to lock in gains.
Always use proper position sizing and stick to your SL to manage risk.
📢 Final Thoughts:
This setup has the technicals lined up for a potential trend expansion. If momentum continues and we see a confirmed retest, NASDAQ:FORM could deliver a textbook bullish move. Don’t ignore the opportunity — but trade smart!
💬 What’s your game plan for NASDAQ:FORM ? Share your targets, strategies, and thoughts below — let’s learn and win together! 👇👇👇

BTC | WHY Bitcoin is BULLISH | 2021 Fractal5 reasons why I say BTC is on it's way to a new ATH (All Time High) :
✅1️⃣ Support zone reclaimed
BTC has successfully reclaimed the support zone ABOVE the neckline resistance, a topic that I've been discussing over the past two weeks. If you'll recall, I pointed out either 70k or 90k. We have our answer:
✅2️⃣ Trendlines
Trendlines are BULLISH as BTC continues to make highger lows, a key indication of bullish sentiment even when a pullback is present:
✅3️⃣ Moving Averages
BTC has reclaimed ALL moving averages in the daily, a bullish indication:
✅4️⃣ Trend Based Indicators
A bullish flash in the weekly is a strong sign:
✅5️⃣ Fractal
It's possible that BTC plays out similarly to the previous ATH fractal from 2021:
________________________
BINANCE:BTCUSDT
