MSTR–Institutional Bitcoin Proxy with Conviction and Leverage ₿Company Snapshot:
MicroStrategy NASDAQ:MSTR remains the largest corporate holder of Bitcoin, positioning itself as a leveraged equity proxy for BTC exposure—while still operating a profitable enterprise software business.
Key Catalysts:
Massive Bitcoin Treasury Strategy 💰
Recently acquired $1.42 billion in BTC, reinforcing commitment
Total holdings exceed 200,000 BTC, making it the most visible and transparent institutional crypto holder
Acts as a high-beta vehicle for Bitcoin bulls, especially as ETF flows drive demand
Financial Engineering = Firepower for More BTC 🚀
$722 million in refinanced fixed-income notes, lowering costs and extending maturity
Provides capital flexibility to accumulate BTC at opportunistic levels
Reflects strong capital market access and investor confidence
BTC ETF Tailwind + Institutional Validation ✅
Bitcoin ETFs provide broader adoption and liquidity, indirectly benefiting MSTR
MSTR offers a regulated, equity-based alternative to direct BTC ownership
Ideal for funds restricted from holding digital assets directly
Dual Business Model Stability ⚙️
Core enterprise software business contributes revenue and operational stability
Reduces perceived risk relative to pure-play crypto companies
Investment Outlook:
✅ Bullish Above: $325.00–$326.00
🚀 Upside Target: $490.00–$500.00
🔑 Thesis: High-conviction BTC accumulation + balance sheet optimization = leveraged upside for Bitcoin-focused investors
📢 MSTR: The go-to equity for institutional Bitcoin exposure—with built-in leverage and transparency.
#Bitcoin #MSTR #CryptoStocks #DigitalAssets #MichaelSaylor #InstitutionalCrypto
Bullish Patterns

doge buy midterm"🌟 Welcome to Golden Candle! 🌟
We're a team of 📈 passionate traders 📉 who love sharing our 🔍 technical analysis insights 🔎 with the TradingView community. 🌎
Our goal is to provide 💡 valuable perspectives 💡 on market trends and patterns, but 🚫 please note that our analyses are not intended as buy or sell recommendations. 🚫
Instead, they reflect our own 💭 personal attitudes and thoughts. 💭
Follow along and 📚 learn 📚 from our analyses! 📊💡"

INJUSDT Potential UpsidesHey Traders, in today's trading session we are monitoring INJUSDT for a buying opportunity around 9.50 zone, INJUSDT is trading in an uptrend and currently is in a correction phase in which it is approaching the trend at 9.50 support and resistance area.
Trade safe, Joe.

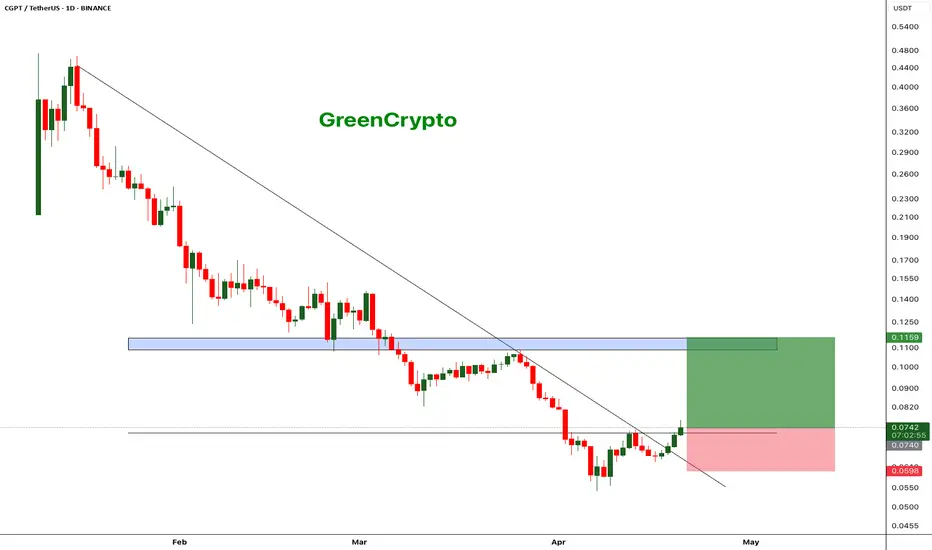
CGPT - Decent Swing Trade Opportunity $BINANCELCGPTUSDT (1D CHART) Technical Analysis Update
CGPT is currently trading at $0.0740 and successfully broke out from the local resistance and heading towards the next resistance. This gives a good opportunity for a quick swing trade with tight stoploss.
Entry level: $ 0.0740
Stop Loss Level: $ 0.0599
TakeProfit 1: $ 0.0818
TakeProfit 2: $ 0.0952
TakeProfit 3: $ 0.1114
Max Leverage: 2x
Position Size: 1% of capital
Remember to set your stop loss.
Follow our TradingView account for more technical analysis updates. | Like, share, and comment your thoughts.
Cheers
GreenCrypto
SPY WEEKLY 2ND MAY 2025Welcome to Spy weekly. I have clearly discussed the price action. If you have any doubts, feel free to leave a comment or DM me.
NOTE:DO NOT SHORT

CHF/JPY BULLS ARE STRONG HERE|LONG
CHF/JPY SIGNAL
Trade Direction: long
Entry Level: 172.570
Target Level: 175.428
Stop Loss: 170.661
RISK PROFILE
Risk level: medium
Suggested risk: 1%
Timeframe: 8h
Disclosure: I am part of Trade Nation's Influencer program and receive a monthly fee for using their TradingView charts in my analysis.
✅LIKE AND COMMENT MY IDEAS✅

Lows Swept! Now we should get Bullish action on Gold!Waited for price to sweep lows before looking for areas to buy. We got that sweep and its now the end of the week. We have been bearish all week. I'm not sure if it will go full on bullish cause we are in a new month and its Friday. They might just move sideways and wait for next week to push. We will take what we can get.

$BTC Huge Daily Close Above the .618 Fib !Very BIG Daily Close for ₿itcoin above the .618 Fib 🥵
CRYPTOCAP:BTC needs to close the next week in or above the green box demand area in order to keep the rally alive and flip resistance into support.
As I originally mentioned in my idea, PA either needs to correct accordingly or this is the long-awaited PARABOLA in the making.
I still stand with my original belief on how this will play out, and have numbered my ideas accordingly.
1. Correct to 200DMA
2. Correct to 50DMA
3. Inverse Head and Shoulders reversal pattern
4. PARABOLA 🚀
I hope it's time to MOON more than anyone!
but I still have a good chunk of cash on the sideline in case the market needs more time 🤓

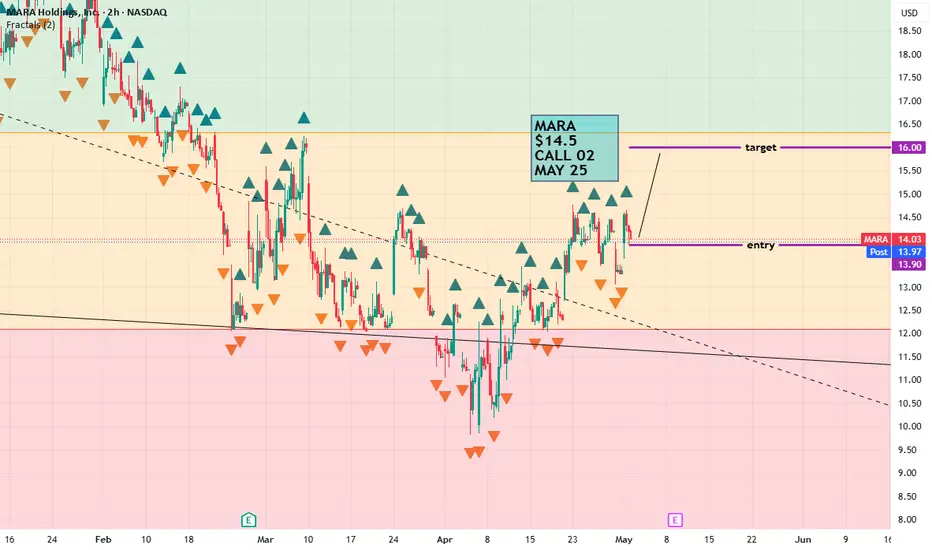
$MARA $14.5 call *This is not financial advice, so trade at your own risks*
*My team digs deep and finds stocks that are expected to perform well based off multiple confluences*
*Experienced traders understand the uphill battle in timing the market, so instead my team focuses mainly on risk management
!! This chart analysis is for reference purposes only !!
If you want to see more, please like and follow us SimplyShowMeTheMoney
SUSDT Potential UpsidesHey Traders, in today's trading session we are monitoring SUSDT for a buying opportunity around 0.4890 zone, SUSDT is trading in an uptrend and currently is in a correction phase in which it is approaching the trend at 0.4890 support and resistance area.
Trade safe, Joe.

LINK Trade Setup – Pullback to Support OpportunityChainlink (LINK) is currently testing resistance, and a retracement into the next support zone offers a clean long entry with solid upside potential.
🔹 Entry Zone:
$13.00 – $13.40
🎯 Take Profit Targets:
🥇 $15.00 – $16.00
🥈 $17.00 – $18.00
🛑 Stop Loss:
Just below $12.00

MEME/USDT: BREAKOUT ALERT!!🚀 MEME Breakout Alert – 40%+ Potential Incoming?! 👀🔥
Hey Traders! If you're all about high-conviction plays and real alpha, smash that 👍 and tap Follow for more setups that actually deliver! 💹💯
🚀 AMEX:MEME / USDT Long Setup – Breakout Watch! 🚀
AMEX:MEME is squeezing inside a symmetrical triangle on the 1H chart and is now testing breakout levels! Get ready for a potential explosive move! 📈⚡
📊 Trade Setup:
✅ Entry: CMP and add more in dip
✅ Targets:
• Target 1 → $0.00260
• Target 2 → $0.00290
• Target 3 → $0.00302+
🛡 Stop Loss (SL): $0.00207 (below triangle support)
📌 Why this setup?
Tight consolidation near apex
Strong EMA support
Previous breakout gave ~40% move!
⚠️ Risk management is key! Wait for confirmation, and always stick to your SL.
💬 Share your thoughts below — bullish or cautious on MEME? Let’s discuss! 👇👇

GOLD setting up for a bigger Bullish PlayBeen waiting for price to get down close to this FVG. Now it looks like it setting up for the bigger play. The key is to wait for the killzone.

sol buy midterm"🌟 Welcome to Golden Candle! 🌟
We're a team of 📈 passionate traders 📉 who love sharing our 🔍 technical analysis insights 🔎 with the TradingView community. 🌎
Our goal is to provide 💡 valuable perspectives 💡 on market trends and patterns, but 🚫 please note that our analyses are not intended as buy or sell recommendations. 🚫
Instead, they reflect our own 💭 personal attitudes and thoughts. 💭
Follow along and 📚 learn 📚 from our analyses! 📊💡"

ONDO Trade Setup – Range Support + Fibonacci ConfluenceONDO has retraced to a key confluence zone, aligning with both lower range support and the 38.2% Fibonacci retracement level. This presents a solid opportunity for a long spot entry, especially if bullish confirmation follows.
🔹 Entry Zone:
Around $0.90
🎯 Take Profit Targets:
🥇 $1.15 – $1.25
🥈 $1.40 – $1.55
🛑 Stop Loss:
Just below $0.85

ETH ANALYSIS🔮 #ETH Analysis 🚀🚀
💲💲 #ETH is trading between support and resistance area. There is a potential rejection again from its resistance zone and pullback from trendline. If #ETH sustains above major resistance area then we will a bullish move till its major resistance area
💸Current Price -- $1,755
⁉️ What to do?
- We have marked crucial levels in the chart . We can trade according to the chart and make some profits. 🚀💸
#ETH #Cryptocurrency #DYOR

Price Takes a Breath Before the Next RunBINANCE:HBARUSDT has been moving in a smooth uptrend, followed by a brief consolidation — forming a classic bullish pennant pattern. This indicates a temporary pause before a potential continuation toward the main target zone at 0.21182 – 0.21855.
A breakout above 0.19195 confirms the validity of the pennant pattern, especially after the price successfully held above the demand zone at 0.18907 – 0.18633. The next key level to watch is the prior high of the pennant (highlighted with a red arrow).
For a solid bullish continuation, ensure the breakout is clean — no fakeouts or re-entries back into the pennant. If a false breakout occurs, it's wise to either trim your position or set a break-even stop to protect your capital.
Note: Manage risk with proper stop loss just below the demand zone.

ETH - Longs on the Go!Hello TradingView Family / Fellow Traders. This is Richard, also known as theSignalyst.
📈ETH has been overall bullish from a medium-term perspective trading within the rising channel marked in blue.
Moreover, the red zone is a strong resistance turned support!
🏹 Thus, the highlighted blue circle is a strong area to look for buy setups as it is the intersection of support and lower blue trendline acting as a non-horizontal support.
📚 As per my trading style:
As #ETH approaches the blue circle zone, I will be looking for bullish reversal setups (like a double bottom pattern, trendline break , and so on...)
📚 Always follow your trading plan regarding entry, risk management, and trade management.
Good luck!
All Strategies Are Good; If Managed Properly!
~Rich

USOIL BULLS WILL DOMINATE THE MARKET|LONG
USOIL SIGNAL
Trade Direction: long
Entry Level: 59.70
Target Level: 63.67
Stop Loss: 57.06
RISK PROFILE
Risk level: medium
Suggested risk: 1%
Timeframe: 12h
Disclosure: I am part of Trade Nation's Influencer program and receive a monthly fee for using their TradingView charts in my analysis.
✅LIKE AND COMMENT MY IDEAS✅

XRP Potential Falling Wedge / Bull PennantBINANCE:XRPUSDT is consolidating within a structure that could be interpreted as either a Falling Wedge or a Pennant — both typically bullish in the current context.
Dual Scenario Setup
• Falling Wedge – A classic bullish continuation structure. Breakout target: ~$4.00.*
• Bull Pennant – A high-conviction continuation pattern. Breakout target: ~$5.30.*
* Both targets are measured from the presumed breakout point and are only valid if price breaks out in the near term.
Key Technical Levels
• Resistance: ~$2.40 – The descending trendline capping price since January.
• Support: ~$1.60 – Confluence of support support trendline + 0.618 Fib retracement of the rally + 1-Year EMA.
• Supply Zone: ~$3.40
• A break below ~$1.60 would invalidate both patterns and shift bias to bearish.
Volume Note: Gradual decline during consolidation supports both wedge and pennant interpretations. A spike in volume post-breakout would confirm strength.
Until a confirmed breakout above ~$2.40 resistance, this remains in a No-Trade Zone for me — but one worth watching closely.

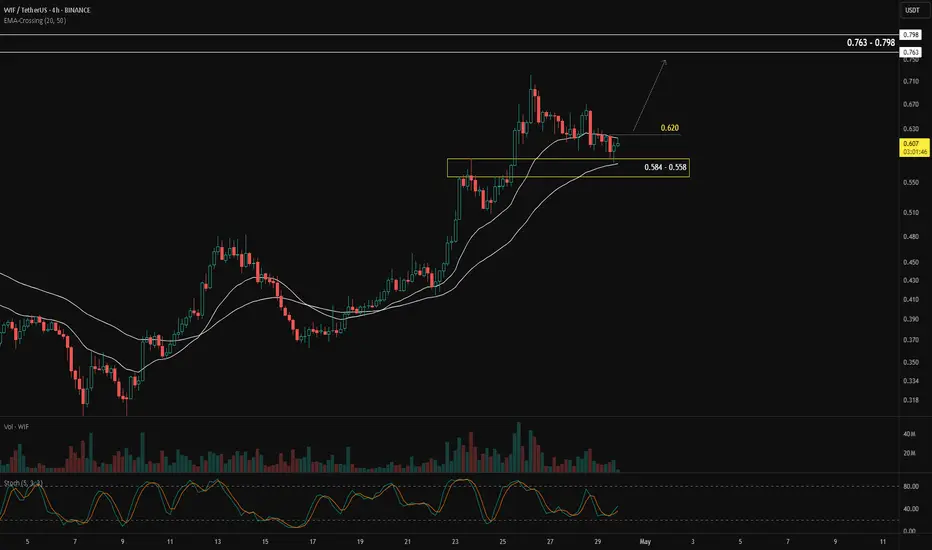
When Moving Averages Meet the Demand ZoneOne of the simplest ways to identify the market trend is by using the moving average (MA) indicator.
When price moves above the MA, it's generally considered an uptrend.
When price moves below the MA, it's seen as a downtrend.
Aside from showing the trend, moving averages can also act as dynamic support and resistance:
In an uptrend, the MA acts as support — meaning if price retraces into the MA, it often bounces back and continues upward.
In a downtrend, the MA acts as resistance — price tends to reject the MA and move lower.
In BINANCE:WIFUSDT , the moving average is currently acting as support, and price is pulling back into a confluence zone between 0.584 – 0.558, where the MA meets a demand zone. This setup increases the probability of the pullback ending and the uptrend continuing.
The confirmation for a bullish continuation would be a break and close above 0.620.
If that happens, the next target zone is between 0.763 – 0.789.
Keep a close eye when price approaches the previous high. The ideal scenario is a strong impulsive breakout. The worst-case scenario would be a rejection or false breakout from that level.
Alright, what's your take on BINANCE:WIFUSDT ?
SOL Trade Setup – Structure Shift & Higher Low FormationSolana (SOL) has shown significant strength after deviating below range lows and tagging $95, quickly recovering and reclaiming key support, indicating a bullish structural shift. We’re now watching for a retrace into the $120 zone, which could confirm a higher low and set up a strong medium-term long entry.
🔹 Entry Zone:
Around $120
🎯 Take Profit Targets:
🥇 $162
🥈 $187
🥉 $213
🛑 Stop Loss:
Daily close below $110

XAUUSDIs XAUUSD building for massive breakout?
If XAUUSD sustains 3300 level then it can target 3400 in no time.
