Bullish Patterns
SUI Long Spot Trade Setup – Oversold Bounce PotentialSUI has dropped into a key support zone ($1.60 – $1.96) after an extended selloff. The price is showing oversold conditions, making this a potentially high-reward setup if a bounce confirms from this zone.
📌 Trade Setup:
Entry Zone: $1.60 – $1.96
Take Profit Targets:
🥇 $2.50 – $2.90
🥈 $3.25 – $3.60
Stop Loss: Just below $1.50
RSR/USDT: FALLING WEDGE BREAKOUT! 100%+ PROFIT POTENTIAL!!🚀 Hey Traders! RSR Breakout Alert – 100%+ Rally Incoming? 👀🔥
If you’re hyped for big moves and real alpha, smash that 👍 and hit Follow for high-accuracy trade setups that actually deliver! 💹🚀
RSR has just broken out of a falling wedge structure on the daily timeframe—a powerful bullish pattern. The chart’s signaling a potential 100–150% upside move if momentum picks up from here. 📈
📍 Entry Zone: CMP – Add more on dips down to $0.0066
🎯 Target: 100%–150% upside
🛑 Stop-Loss: $0.0054
📊 Trade Plan:
✅ Buy from current levels
✅ Add on dips near breakout support
✅ Ride the breakout wave with tight risk control!
💬 What’s Your Take?
Are you riding this RSR breakout or waiting on confirmation? Drop your thoughts and targets in the comments—let’s ride this wave together! 💰🔥
$BTC Not Out Of The Weeds Yet - Must Break $84kIf CRYPTOCAP:BTC can break back above ~$84k then we could continue to follow my OG setup (yellow) and rip,
but since PA dumped slightly below the 50WMA it technically invalidated my inverse h & s idea.
A rejection of $84k would dump us back to ~$78k to form the right shoulder (red) and complete the setup.
nonetheless, i believe we've seen the bottom 👋
HAPPENING NOW?! HERTZ CUP AND HANDLE BREAKOUT 1D CHART?HERTZ (HTZ) Price rose significantly to $4.26 on the 1 Day chart. Is this a sign of an impending bullish breakout? My personal target opinion for bullish movement is $5.50. Will this be a major bullish turning point for Hertz? Or will it be a easy grab for traders running short positions?
BTC UPDATE: Flash Crash? Or Bullish Retest?🚀 Hey Traders! 👋
If you’re enjoying this analysis, smash that 👍 and hit Follow for high-accuracy trade setups that actually deliver! 💹🔥
📉 BTC just dropped nearly $10K in a single day, sliding from $84K to $74K amidst growing tariff tensions and broader market turmoil.
But here’s the bullish twist—this dump might just be a healthy retest.
BTC recently broke out of a strong inverse head & shoulders pattern, and what we’re seeing now looks like a classic neckline retest.
📌 Key Support: $72K
As long as BTC holds above this level, there’s no reason to panic. Once the dust settles from this bloody Monday, momentum could shift back to the upside.
🟢 This could be a golden accumulation zone—low risk, high potential reward.
❌ Invalidation Level: Weekly close below $72K
💬 What’s Your Take?
Will BTC bounce from this level, or is there more downside ahead? Drop your analysis and predictions below—let’s navigate this together and secure those gains! 💰🔥🚀
Monster Beverage Corp (MNST) – Energizing Global GrowthCompany Snapshot:
Monster NASDAQ:MNST continues to dominate the $60B+ global energy drink market, expanding across 159 countries with a diverse portfolio and strong executive leadership.
Key Catalysts:
Global Market Expansion 🌐
Strategic brands like Predator and Fury targeting emerging markets
New geographies = incremental revenue & brand exposure
Category Leadership & Diversification 🥤
Strong lineup: Monster Energy®, Reign®, Bang®, Java Monster®, NOS®
Broad consumer appeal → fuels market share gains in both premium & value tiers
Industry Tailwinds 📊
Energy drink market projected to grow at 7.6% CAGR (2025–2029)
Monster well-positioned with affordable, recognizable, and global brands
Leadership & ESG Strength 💼💚
Longtime Co-CEOs Rodney Sacks & Hilton Schlosberg driving global strategy
Involvement in charitable events reinforces brand goodwill and consumer trust
Investment Outlook:
✅ Bullish Above: $50.00–$51.00
🚀 Upside Target: $75.00–$76.00
📈 Growth Drivers: Emerging market expansion, brand strength, leadership, and rising category demand
⚡️ Monster – Powering growth from the shelf to the streets. #MNST #EnergyDrinks #GlobalLeader
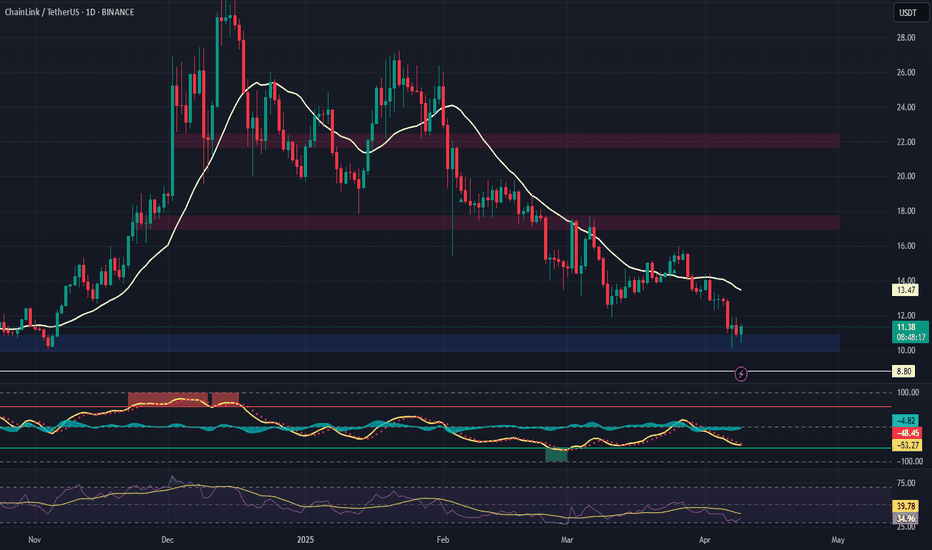
LINK Long Spot Trade Setup – Major Support TestLINK has retraced sharply and is now sitting at a critical support zone ($10.00–$11.00), historically a strong base for reversals. This offers a solid risk/reward opportunity for a potential bounce and test of upper resistance zones.
📌 Trade Setup:
Entry Zone: $10.00 – $11.00
Take Profit Targets:
🥇 $17.00 – $17.70
🥈 $21.70 – $22.40
Stop Loss: Around $8.80
USOIL SENDS CLEAR BULLISH SIGNALS|LONG
USOIL SIGNAL
Trade Direction: long
Entry Level: 57.67
Target Level: 66.44
Stop Loss: 51.82
RISK PROFILE
Risk level: medium
Suggested risk: 1%
Timeframe: 12h
Disclosure: I am part of Trade Nation's Influencer program and receive a monthly fee for using their TradingView charts in my analysis.
✅LIKE AND COMMENT MY IDEAS✅
EUR/CHF BULLISH BIAS RIGHT NOW| LONG
Hello, Friends!
Previous week’s red candle means that for us the EUR/CHF pair is in the downtrend. And the current movement leg was also down but the support line will be hit soon and lower BB band proximity will signal an oversold condition so we will go for a counter-trend long trade with the target being at 0.943.
Disclosure: I am part of Trade Nation's Influencer program and receive a monthly fee for using their TradingView charts in my analysis.
✅LIKE AND COMMENT MY IDEAS✅
USDJPY Analysis: Reversal Estimations Based on Trading MathDear Trader,
Please find attached my analysis of $Subject, which uses mathematical calculations to identify potential reversal times and price levels. The analysis details projected south and north price targets (horizontal lines on the chart), along with estimated time frames for possible reversals (vertical lines on the chart, accurate to within +/- 1-2 candles). Please note that all times indicated on the chart, including the vertical lines representing potential reversal times, are based on the UTC+4 time zone.
To increase the probability of these analyses, I recommend monitoring the 5-minute and 15-minute charts for the following key reversal candlestick patterns:
Doji’s
Double Bottom/Top
Engulfing Bullish /Bearish
Hanging Man
Hammer/Inverted Hammer
Morning Star
Shooting Star
Triple Top/Bottom
For those interested in further developing their trading skills based on these types of analyses, consider exploring the mentoring program offered by Shunya Trade.
I welcome your feedback on this analysis, as it will inform and enhance my future work.
Regards,
Shunya Trade
Price levels
Price DH Price DL
144.52194 144.63007
144.48096 144.67107
144.38595 144.76618
144.19602 144.95648
144.00622 145.14691
143.81654 145.33746
143.62698 145.52814
143.43756 145.71894
143.24825 145.90987
143.05907 146.10093
142.30361 146.86639
141.55015 147.63385
140.79868 148.40332
140.04922 149.17478
139.30176 149.94824
138.55630 150.72370
137.81283 151.50117
137.07137 152.28063
⚠️ Disclaimer: This post is educational content and does not constitute investment advice, financial advice, or trading recommendations. The views expressed here are based on technical analysis and are shared solely for informational purposes. The stock market is subject to risks, including capital loss, and readers should exercise due diligence before investing. We do not take responsibility for decisions made based on this content. Consult a certified financial advisor for personalized guidance.
Bond Futures Back At SupportTrade is fairly simple here. Go long treasuries and if it breaks down cut.
- A bounce and push back up could be another ugly catalyst for the US stock market.
- A breakdown however would push yields up (and economic growth forecasts) which would be quite bullish for stocks especially down at these levels
ONDO Long Spot Trade Setup – Bullish Divergence PotentialONDO is showing relative strength amid the broader altcoin pullback, holding key levels and now pulling into the $0.50 support zone. This area lines up for a possible RSI bullish divergence, which could spark the next leg up.
📌 Trade Setup:
Entry Zone: ~$0.50
Take Profit Targets:
🥇 $0.85
🥈 $1.13
🥉 $1.34
Stop Loss: Daily close below $0.42
LTO - Shift in Momentun in Action!Hello TradingView Family / Fellow Traders. This is Richard, also known as theSignalyst.
📚 LTO is a perfect practical example of a momentum shift in action.
It’s clear that the bears are losing steam — the impulse moves marked in red are becoming flatter and smaller, forming a wedge pattern.
Moreover, LTO just tapped into a key weekly support zone near the $0.03 round number, making it a prime area to look for potential long setups.📈
🚀For the bulls to confirm this momentum shift in their favor and aim for the $0.05 round number as the first target 🎯, a break above the last major high marked in green at $0.0345 is essential ✅.
📚 Always follow your trading plan regarding entry, risk management, and trade management.
Good luck!
All Strategies Are Good; If Managed Properly!
~Rich
Ripple May Face Another Rally This YearRipple with ticker XRPUSD hit all-time highs for the final blue wave V as expected, so we should be aware of limited upside this year. However, despite recent slowdown, which we see it as an ABC correction within red subwave (IV), there can still be room for another rally this year, at least up to 4-5 area to complete final subwave (V) of V of an impulse on a daily chart.
GOLD BEST PLACE TO BUY FROM|LONG
GOLD SIGNAL
Trade Direction: long
Entry Level: 3,008.04
Target Level: 3,136.65
Stop Loss: 2,921.80
RISK PROFILE
Risk level: medium
Suggested risk: 1%
Timeframe: 12h
Disclosure: I am part of Trade Nation's Influencer program and receive a monthly fee for using their TradingView charts in my analysis.
✅LIKE AND COMMENT MY IDEAS✅
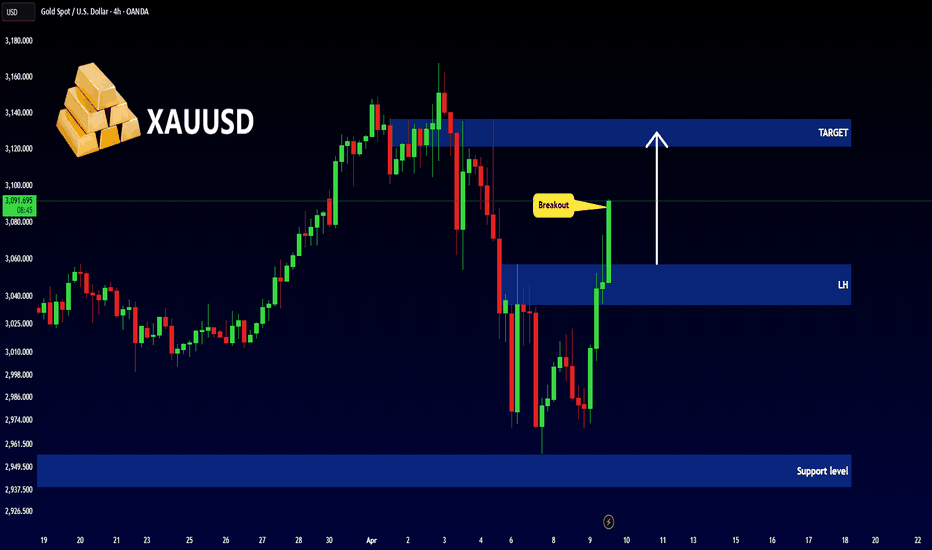
Gold (XAU/USD) 4H Analysis – Bullish Momentum Building Up?**Gold (XAU/USD) | 4H Chart | Bullish Bias**
Gold continues to shine as it builds a solid bullish structure on the 4H timeframe. After a healthy pullback, price has bounced back strongly, holding above key support zones and aiming higher.
**What's happening now?**
- Price is forming *higher highs and higher lows*, respecting the bullish trendline.
- Strong demand kicked in around the *$2,950* zone — a key level to watch for potential pullbacks.
- The next resistance lies near *$3,050*, a psychological and technical level that could act as the next target for buyers.
**Technical Confluence:**
- *Fibonacci retracement* aligns with recent pullbacks around $2,950 – offering strong support.
- *RSI* is hovering above 50, confirming ongoing bullish momentum.
- Price remains above the *50-period EMA*, supporting the uptrend.
---
**Bullish Scenario:**
If gold holds above $2,950 and breaks above $3,010 with volume, we could see a push toward *$3,050–$3,070* in the short term.
**Invalidation:**
A confirmed break below *$2,940* could weaken the bullish outlook and shift momentum.
---
**Educational Insight:**
In trending markets, pullbacks to key zones like Fibonacci levels or prior support often offer higher-probability trades. Instead of chasing breakouts, look for *retests* with confirmation.
---
What’s your take on gold right now? Are we headed toward new highs or due for a pause?
eth buy midterm "🌟 Welcome to Golden Candle! 🌟
We're a team of 📈 passionate traders 📉 who love sharing our 🔍 technical analysis insights 🔎 with the TradingView community. 🌎
Our goal is to provide 💡 valuable perspectives 💡 on market trends and patterns, but 🚫 please note that our analyses are not intended as buy or sell recommendations. 🚫
Instead, they reflect our own 💭 personal attitudes and thoughts. 💭
Follow along and 📚 learn 📚 from our analyses! 📊💡"


