Bitcoin Rebounds Strongly from Key SupportCritical Support Zone:
Bitcoin has rebounded sharply from the $80,000-$78,000 support level, which previously served as the breakout zone in late October 2024. This strong reaction suggests significant buying interest and potentially a higher low within the broader uptrend.
Healthy Market Correction:
After reaching an all-time high of $108,000, Bitcoin experienced a typical bull market retracement of about 30%. The strong bullish engulfing candle at support signals a possible shift back to the upside.
Key Levels to Watch:
Support: Holding above $80,000-$78,000 is crucial for maintaining the bullish outlook.
Immediate Resistance: $88,000-$90,000 range.
Upside Target: If bullish momentum continues, Bitcoin could push toward $100,000 in the next phase of its uptrend.
With momentum potentially shifting, Bitcoin is at a decisive point—will it reclaim new highs? Stay tuned! 🚀📈
#Bitcoin #BTC #Crypto #MarketAnalysis #Trading #Bullish #Support #Resistance
Bullish Patterns

TG Therapeutics (TGTX) – Biotech Innovation & Global ExpansionCompany Overview:
TG Therapeutics NASDAQ:TGTX is a biotech leader focused on novel cancer and autoimmune treatments, gaining momentum as an IBD Leaderboard and IBD 50 Top 10 Growth Stock.
Key Catalysts:
Regulatory Approvals & Expansion 🌍
BRIUMVI secured approvals in Europe & the UK, unlocking new revenue streams in key markets.
Strong Profitability & Growth 💰
88.3% gross margin ensures sustainable reinvestment into R&D and future pipeline advancements.
High-Growth Stock Recognition 📊
Technical strength is validated by its inclusion in top-performing stock lists, signaling strong investor confidence.
Investment Outlook:
Bullish Case: We are bullish on TGTX above $34.00-$35.00, driven by global expansion, financial strength, and biotech leadership.
Upside Potential: Our price target is $55.00-$56.00, supported by continued innovation and market penetration.
🔥 TG Therapeutics – Pioneering the Future of Cancer Treatment. #TGTX #Biotech #GrowthStocks

Nasdaq pushIv been watching this chart for a long time now and it seems on the 6month chart we are retesting the last candle close and coming down to lower-time frames i can see consolidation and a mix on reversals here im looking at it as one big break and retest

AUD/NZD BULLS ARE STRONG HERE|LONG
Hello, Friends!
AUD/NZD pair is trading in a local downtrend which we know by looking at the previous 1W candle which is red. On the 3H timeframe the pair is going down too. The pair is oversold because the price is close to the lower band of the BB indicator. So we are looking to buy the pair with the lower BB line acting as support. The next target is 1.100 area.
Disclosure: I am part of Trade Nation's Influencer program and receive a monthly fee for using their TradingView charts in my analysis.
✅LIKE AND COMMENT MY IDEAS✅

USDCAD - Get Ready Bulls!Hello TradingView Family / Fellow Traders. This is Richard, also known as theSignalyst.
📈USDCAD has been overall bullish trading above the blue trendline acting as a non-horizontal support.
This week, USDCAD has been in a correction phase trading within the falling red channel.
Moreover, the green zone is a strong demand.
🏹 Thus, the highlighted blue circle is a strong area to look for buy setups as it is the intersection of demand and lower red and blue trendlines acting as non-horizontal support.
📚 As per my trading style:
As #USDCAD approaches the blue circle zone, I will be looking for bullish reversal setups (like a double bottom pattern, trendline break , and so on...)
📚 Always follow your trading plan regarding entry, risk management, and trade management.
Good luck!
All Strategies Are Good; If Managed Properly!
~Rich
Disclosure: I am part of Trade Nation's Influencer program and receive a monthly fee for using their TradingView charts in my analysis.

PIPPIN/USDT: LONG TRADE SETUP!!🚀 Hey Traders! PIPPIN Breakout Alert – Big Move Incoming? 👀🔥
If you’re excited for this setup, smash that 👍 and hit Follow for high-quality trade ideas that actually deliver! 💹🔥
🔥 PIPPIN Breakout & Retest – Time to Pump?
PIPPIN has broken out of a falling wedge on the 2H timeframe and is now retesting the breakout level. If this retest holds, we could see a strong rally ahead! 🚀
💰 Trade Setup:
📍 Entry: CMP, add more up to $0.019
🎯 Targets: $0.0225 / $0.0252 / $0.0294 / $0.0334
🛑 Stop-Loss: $0.018
⚡ Leverage: Low (Max 5x)
🔎 Strategy: Enter with low leverage now, scale in on dips, and ride the momentum to key targets!
💬 What’s Your Take?
Are you bullish on PIPPIN’s breakout? Drop your thoughts, analysis, and predictions in the comments! Let’s secure those gains and ride this wave together! 💰🚀🔥

Gold Potential UpsidesHey Traders, in today's trading session we are monitoring XAUUSD for a buying opportunity around 2920 zone, Gold is trading in an uptrend and currently is in a correction phase in which it is approaching the trend at 2920 support and resistance area.
Trade safe, Joe.

SOLUSD Potential UpsidesHey Traders, in today's trading session we are monitoring SOLUSD for a buying opportunity around 123 zone, SOLUSD is trading in an uptrend and currently is in a correction phase in which it is approaching the trend at 123 support and resistance area.
Trade safe, Joe.

BNBUSD Potential UpsidesHey Traders, in today's trading session we are monitoring BNBUSD for a buying opportunity around 590 zone, BNB is trading in an uptrend and currently is in a correction phase in which it is approaching the trend at 590 support and resistance area.
Trade safe, Joe.

US30 BULLS WILL DOMINATE THE MARKET|LONG
US30 SIGNAL
Trade Direction: long
Entry Level: 41,378.4
Target Level: 43,046.4
Stop Loss: 40,263.5
RISK PROFILE
Risk level: medium
Suggested risk: 1%
Timeframe: 1D
Disclosure: I am part of Trade Nation's Influencer program and receive a monthly fee for using their TradingView charts in my analysis.

EPIC Is Building An Uptrend! Hey Traders, in today's trading session we are monitoring EPICUSDT for a buying opportunity around 1.75 zone, Epic is trading in an uptrend and currently is in a correction phase in which it is approaching the trend at 1.75 support and resistance area.
Trade safe, Joe.

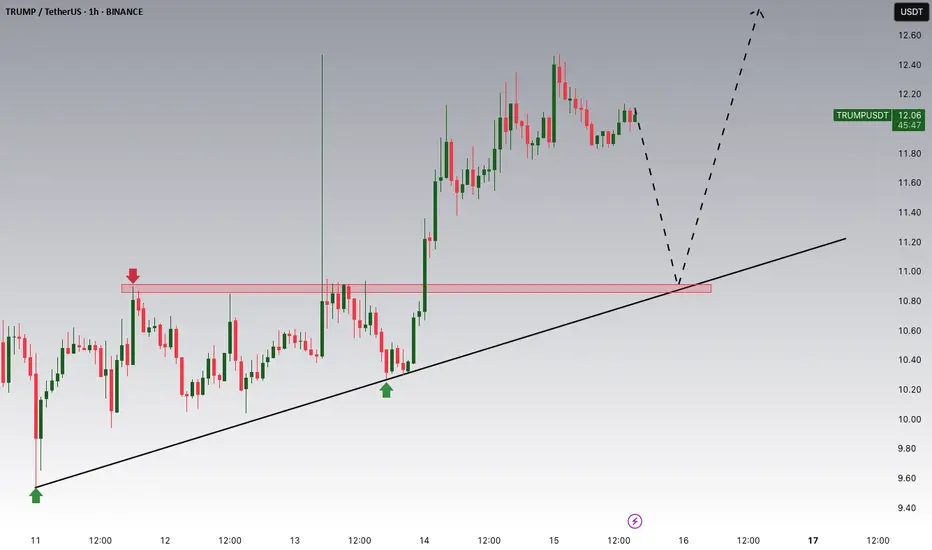
TRUMP Is Trying To SpikeHey Traders, in today's trading session we are monitoring TRUMPUSDT for a buying opportunity around 11 zone, Trump is trading in an uptrend and currently is in a correction phase in which it is approaching the trend at 11 support and resistance area.
Trade safe, Joe.
Ripple is Nearing Important SupportHey Traders, in today's trading session we are monitoring XRPUSDT for a buying opportunity around 2.35 zone, XRP is trading in an uptrend and currently is in a correction phase in which it is approaching the trend at 2.35 support and resistance area.
Trade safe, Joe.

MDT ANALYSIS📊 #MDT Analysis
✅There is a formation of Descending Channel Pattern in daily chart. Currently #MDT is in bearish way.
After a breakout of the pattern and major resistance level we would see a bullish momentum otherwise the price will drop more 🧐
👀Current Price: $0.02980
⚡️What to do ?
👀Keep an eye on #MDT price action and volume. We can trade according to the chart and make some profits⚡️⚡️
#MDT #Cryptocurrency #Breakout #TechnicalAnalysis #DYOR

AAPL BULLS ARE GAINING STRENGTH|LONG
AAPL SIGNAL
Trade Direction: long
Entry Level: 213.28
Target Level: 232.17
Stop Loss: 200.88
RISK PROFILE
Risk level: medium
Suggested risk: 1%
Timeframe: 9h
Disclosure: I am part of Trade Nation's Influencer program and receive a monthly fee for using their TradingView charts in my analysis.

EURNZD Price has been extremely bullish the past few weeks so I'd continue looking for buys until price breaks the previous H4 higher low/support around the 1.88900 area. IF that support is BROKEN, then I'd look for sells towards the 1.85400 area.

$BTC Closed Above 200DMA + Bullish DivergenceCRYPTOCAP:BTC closed the day a tick above the 200DMA.
Need to trade a few days above $85k to show strength for Bulls.
Ideal setup would be an inverse H & S from here.
RSI showing Bullish Divergence.

EURCHF - Important BreakoutHello Traders !
After a huge bullish move, The EURCHF broke the resistance level (0.95814 - 0.95644).
This key level becomes new support !
So, I expect a bullish move🚀
____________
TARGET: 0.96700🎯

$PENGU Falling Wedge Bullish Daily CSECY:PENGU forming a falling wedge this will explote soon guaranteed I’m loading hard already! See you at the top!

dydx buy midterm "🌟 Welcome to Golden Candle! 🌟
We're a team of 📈 passionate traders 📉 who love sharing our 🔍 technical analysis insights 🔎 with the TradingView community. 🌎
Our goal is to provide 💡 valuable perspectives 💡 on market trends and patterns, but 🚫 please note that our analyses are not intended as buy or sell recommendations. 🚫
Instead, they reflect our own 💭 personal attitudes and thoughts. 💭
Follow along and 📚 learn 📚 from our analyses! 📊💡"

XRP Approaches Critical Support at $2.00Key Technical Level:
XRP is testing the strong $2.00 support level, which has consistently acted as a key price floor since December.
Descending Triangle Formation:
The price action is forming a descending triangle, where decreasing volatility suggests an imminent breakout. This pattern emerges as XRP approaches the intersection of descending resistance and horizontal support.
Bullish or Bearish?
A confirmed breakout above resistance could trigger a strong rally.
A sustained drop below $2.00 would invalidate the bullish outlook, potentially leading to a retracement toward $1.60-$1.80.
Market Perspective:
XRP’s rally from $0.60 to over $3.40 since November suggests that the current correction is likely a phase of profit-taking rather than a full trend reversal. However, traders should remain cautious and watch for confirmation of direction.
Stay alert—XRP is at a decisive moment! 🚀📉
#XRP #Crypto #MarketAnalysis #Trading #TechnicalAnalysis #Cryptocurrency #Bullish #SupportLevel

Rocket Companies (RKT) – Fintech-Driven Mortgage GrowthCompany Overview:
Rocket Companies NYSE:RKT is a fintech leader in mortgage and real estate solutions, leveraging AI-driven efficiency to enhance profitability and market share.
Key Catalysts:
Surging Profitability & Efficiency 💰
Adjusted EBITDA margin rose to 18% in Q4 2024, up from 2% a year prior, reflecting strong financial performance.
Rocket Mortgage Growth 📊
Net rate lock volume surged 47% YoY to $23.6 billion, far outpacing industry trends.
Expanding Servicing Portfolio 📈
The $593 billion servicing portfolio (+17%) provides stable revenue and cross-selling opportunities, acting as a hedge against rate volatility.
Resilient Market Share Expansion 🏆
Despite industry headwinds, Rocket continues to grow market share, proving its competitive edge in mortgage lending.
Investment Outlook:
Bullish Case: We are bullish on RKT above $11.80-$12.00, driven by profitability gains, market expansion, and portfolio strength.
Upside Potential: Our price target is $20.00-$21.00, reflecting sustained growth and operational efficiency.
🔥 Rocket Companies – Powering the Future of Mortgage & Fintech. #RKT #MortgageTech #FintechGrowth

#BTCUSDT: BULLISH BREAKOUT IN LTF!!🚀 Hey Traders!
If you're finding value in this analysis, smash that 👍 and hit Follow for high-accuracy trade setups that actually deliver! 💹🔥
BTC is breaking out from an inverse head & shoulders pattern on the 1H timeframe, signaling strength! 📈 If it holds above the neckline, we could see a strong rally toward $90K– GETTEX:92K in the coming days! 🚀
🔹 Key Levels to Watch:
✅ Target: $90K– GETTEX:92K
❌ Invalidation: Close below $81,200
Momentum is building—can bulls take control? Let us know in the comment section.
