10/03/25 Weekly outlookLast weeks high: $93,745.25
Last weeks low: $80,029.90
Midpoint: $86,887.58
Last week in crypto saw the first White House Digital Assets Summit. An event that only as recently as the last bull cycle we could only dream of taking place. In the summit that hosted the biggest names in the space a vow was made by the US Gov never to sell their BTC, to establish stablecoin regulatory clarity and to stockpile various US made altcoins. A historic moment but how did that relate to the chart?
Well BTC dropped 14.6% from weekly high set at the beginning of the week to weekly low set at the end of the week. The most important aspect is how this now looks on the higher time frames, the once strong support level of $91K has now been confirmed as new resistance as BTC tried several times to reclaim it and in the end fell away. This now puts BTC in the FVG area from $91-73K. With no real support until the $73,000 level this is knife catching territory and with the SP:SPX rolling over too I would need a lot more evidence that BTC will turn around before going long with any real size.
This week I anticipate further sell-off, now I would be happy to be proven wrong on that however it does look like we are heading towards FWB:73K where I would like to see buyers stepping up and start to dominate the orderbooks. Structurally that would fill a large inefficiency area with an eye to bounce off support and move back towards currently levels ~ GETTEX:82K as that would be the midpoint of the FVG although that is a few steps in the future.
CPI takes place this week and so volatility may be expected but unless the result is wildly different to the forecast numbers the whipsaw PA should level out fairly neutral.
Invalidation on this idea would be a successful reclaim of $91K which is previous mini range low & 4H 200 EMA resistance.
Bullish Patterns

btc buy shortterm"🌟 Welcome to Golden Candle! 🌟
We're a team of 📈 passionate traders 📉 who love sharing our 🔍 technical analysis insights 🔎 with the TradingView community. 🌎
Our goal is to provide 💡 valuable perspectives 💡 on market trends and patterns, but 🚫 please note that our analyses are not intended as buy or sell recommendations. 🚫
Instead, they reflect our own 💭 personal attitudes and thoughts. 💭
Follow along and 📚 learn 📚 from our analyses! 📊💡"

GOLD BEST PLACE TO BUY FROM|LONG
Hello, Friends!
GOLD is making a bearish pullback on the 1H TF and is nearing the support line below while we are generally bullish biased on the pair due to our previous 1W candle analysis, thus making a trend-following long a good option for us with the target being the 2,920.193 level.
✅LIKE AND COMMENT MY IDEAS✅

USD/JPY BULLS WILL DOMINATE THE MARKET|LONG
Hello, Friends!
USD/JPY downtrend evident from the last 1W red candle makes longs trades more risky, but the current set-up targeting 150.469 area still presents a good opportunity for us to buy the pair because the support line is nearby and the BB lower band is close which indicates the oversold state of the USD/JPY pair.
✅LIKE AND COMMENT MY IDEAS✅

AUDUSD Potential UpsidesHey Traders, in today's trading session we are monitoring AUDUSD for a buying opportunity around 0.62100 zone, AUDUSD is trading in an uptrend and currently is in a correction phase in which it is approaching the trend at 0.62100 support and resistance area.
Trade safe, Joe.

BTC 12000-19000 ?!!! Possibly yes...If BTC falls below $49,000, we could see a major drop to the $12,000 - $19,000 range! This level is a critical support, and losing it could trigger a cascade of liquidations.
📉 Watch for confirmation and manage your risk accordingly!
💭 What are your thoughts? Bullish or bearish? Let’s discuss!
#Bitcoin #BTC #Crypto #Trading #CryptoMarket #Bearish #Bullish
Let me know if you want any tweaks! 🚀

Bear trap or the beginning of a bear market?A bear trap is on the border between a bear and a bull market. If it is really just a trap, then after a false breakout through support there should be a pullback and a subsequent run to the heights without any chance of buying on suitable positions. However, if it is not a bear trap, then it will only be a confirmation of the beginning of a bear market.

SPY SENDS CLEAR BULLISH SIGNALS|LONG
Hello, Friends!
SPY pair is in the downtrend because previous week’s candle is red, while the price is evidently falling on the 9H timeframe. And after the retest of the support line below I believe we will see a move up towards the target above at 593.41 because the pair oversold due to its proximity to the lower BB band and a bullish correction is likely.
✅LIKE AND COMMENT MY IDEAS✅

BTC ANALYSIS🔮 #BTC Analysis
💲💲 #BTC is trading in a Symmetrical Triangle Pattern. If the price of #BTC breaks and sustain the higher price then will see a pump. Also there is an instant strong support zone. We may see a retest towards the support zone first and then a reversal📈
⁉️ What to do?
- We have marked crucial levels in the chart . We can trade according to the chart and make some profits. 🚀
#BTC #Cryptocurrency #Support #Resistance #DYOR

$BTC Bearish Divergence on the Weekly !? NO!!!Someone on Twitter sent me a chart showing Bearish Divergence on the Weekly for BTC and asked me to analyze it.
(hopefully this link shows the chart)
pbs.twimg.com
My response is below.
---
This is a really good question!
Caught me off guard for a second and I had to really analyze it.
That chart assumes we’re at the end of the cycle, so its showing bearish divergence prematurely in Mar ’25.
But the fractal it’s being compared to shows divergence with the peak in Nov ’21.
Here’s the correct way to draw the trends.
If you draw from the bear market low to current date, you see we are just getting warmed up.
This cycle is mimicking 2017 as I’ve mentioned a lot over the past year.
I marked where we are so you can see the Feb - Mar ’21 dip in RSI.
Imagine tapping out right before the moonshot!
It’s easy to get caught off guard with that chart, as the fractals from ’21 and ’25 on the RSI do look strikingly familiar, but notice how the right shoulder on the RSI falls in Nov 21’ , but the right shoulder on the RSI in Dec ’24 is going higher, pointing to the RSI following the ’17 uptrend.
I wonder if the person who made that chart actually thought that was the correct way to analyze the chart, or if that’s just a troll bear-posting.
I could see someone like CredibleCrypto or an XRP-maxi posting that.

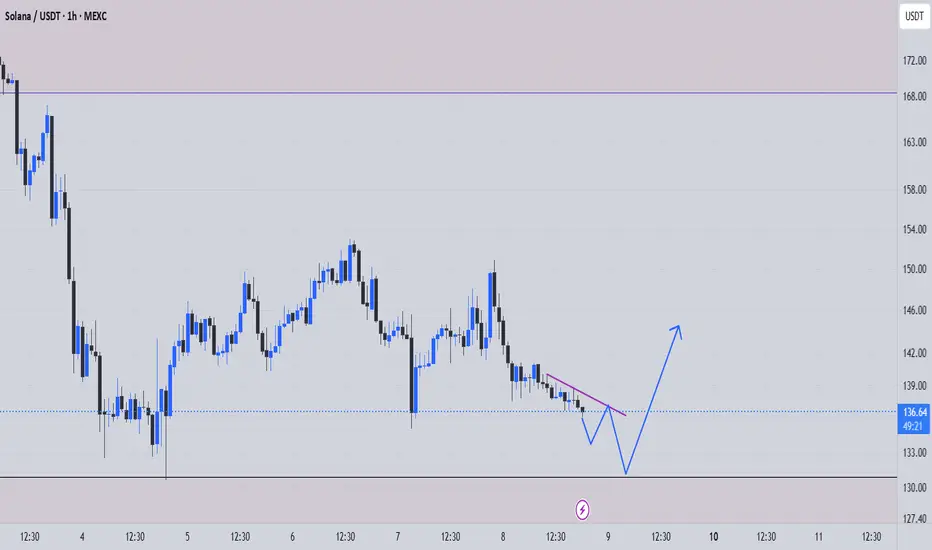
sol buy midterm"🌟 Welcome to Golden Candle! 🌟
We're a team of 📈 passionate traders 📉 who love sharing our 🔍 technical analysis insights 🔎 with the TradingView community. 🌎
Our goal is to provide 💡 valuable perspectives 💡 on market trends and patterns, but 🚫 please note that our analyses are not intended as buy or sell recommendations. 🚫
Instead, they reflect our own 💭 personal attitudes and thoughts. 💭
Follow along and 📚 learn 📚 from our analyses! 📊💡"
USOIL BUYERS WILL DOMINATE THE MARKET|LONG
Hello, Friends!
We are going long on the USOIL with the target of 73.56 level, because the pair is oversold and will soon hit the support line below. We deduced the oversold condition from the price being near to the lower BB band. However, we should use low risk here because the 1W TF is red and gives us a counter-signal.
✅LIKE AND COMMENT MY IDEAS✅

NZD/JPY BULLISH BIAS RIGHT NOW| LONG
Hello, Friends!
We are now examining the NZD/JPY pair and we can see that the pair is going down locally while also being in a downtrend on the 1W TF. But there is also a powerful signal from the BB lower band being nearby indicating that the pair is oversold so we can go long from the support line below and a target at 85.520 level.
✅LIKE AND COMMENT MY IDEAS✅

CAD/CHF BEST PLACE TO BUY FROM|LONG
Hello, Friends!
The BB lower band is nearby so CAD-CHF is in the oversold territory. Thus, despite the downtrend on the 1W timeframe I think that we will see a bullish reaction from the support line below and a move up towards the target at around 0.626.
✅LIKE AND COMMENT MY IDEAS✅

USOIL Potential UpsidesHey Traders, in today's trading session we are monitoring USOIL for a buying opportunity around 66 zone, USOIL is trading in an uptrend and currently is in a correction phase in which it is approaching the trend at 66 support and resistance area.
Trade safe, Joe.

Gold Potential UpsidesHey Traders, in the coming week we are monitoring XAUUSD for a buying opportunity around 2900 zone, Gold is trading in an uptrend and currently is in a correction phase in which it is approaching the trend at 2900 support and resistance area.
Trade safe, Joe.

Bitcoin Potential UpsidesHey Traders, in today's trading session we are monitoring Bitcoin for a buying opportunity around 84k zone, Bitcoin is trading in an uptrend and currently is in a correction phase in which it is approaching the trend at 84k support and resistance area.
Trade safe, Joe.

bch buylimit midterm"🌟 Welcome to Golden Candle! 🌟
We're a team of 📈 passionate traders 📉 who love sharing our 🔍 technical analysis insights 🔎 with the TradingView community. 🌎
Our goal is to provide 💡 valuable perspectives 💡 on market trends and patterns, but 🚫 please note that our analyses are not intended as buy or sell recommendations. 🚫
Instead, they reflect our own 💭 personal attitudes and thoughts. 💭
Follow along and 📚 learn 📚 from our analyses! 📊💡"

LINK - Strong like a Castle!Hello TradingView Family / Fellow Traders. This is Richard, also known as theSignalyst.
📈 Long-term, LINK has been overall bullish, trading within the rising wedge marked in blue.
🔻 Currently, it is in a correction phase, trading within the falling red channel.
📍 As it retests the lower bound of both the red and blue trendlines—perfectly intersecting with the green support—I will be looking for short-term longs.
🚀 For the bulls to take over long-term and initiate the next bullish phase, a breakout above the falling red channel is needed.
📚 Always follow your trading plan regarding entry, risk management, and trade management.
Good luck!
All Strategies Are Good; If Managed Properly!
~Rich

WRB RotationTesting a few technical indicators during a cyclical rotation here:
- Volume Profile
-- 50 day lookback "Quarterly PoC" | Price is at PoC
-- 100 day lookback "Power PoC" | Price is at PoC
-- PoC Price | Blue = Long
- 200 Day Moving Average
- provides baseline for Long/Short basis | Price > MA = Longs
- Volatility Radar
-- highlighted background indicates:
--- compressed volatility | Entry Allowed
--- trend intensity is showing a "weakening" bearish trend | Mixed on Direction
- 50 Day Moving Average
-- used as the ultimate exit after price goes above it
Good Luck!

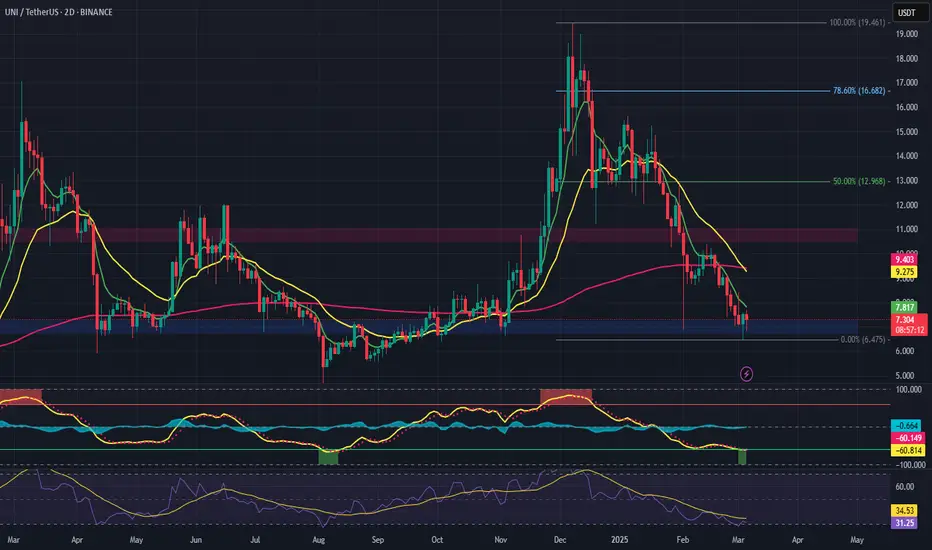
UNI Trade Setup: Key Support RetestUNI has pulled back into a primary support zone at $7.20, a critical area for bulls to hold. A bounce from this level could trigger upside momentum, while a breakdown could invalidate the bullish structure.
🛠 Trade Details:
Entry: Around $7.20
Take Profit Targets:
$9.00
$10.00
$13.00
Stop Loss: Daily close below $6.50
If buyers step in strongly at support, UNI could stage a significant recovery. Keep an eye on market conditions! 🚀
AUD/CHF BULLS WILL DOMINATE THE MARKET|LONG
Hello, Friends!
AUD/CHF pair is in the downtrend because previous week’s candle is red, while the price is clearly falling on the 1H timeframe. And after the retest of the support line below I believe we will see a move up towards the target above at 0.557 because the pair oversold due to its proximity to the lower BB band and a bullish correction is likely.
✅LIKE AND COMMENT MY IDEAS✅

NZD/CHF SENDS CLEAR BULLISH SIGNALS|LONG
Hello, Friends!
NZD/CHF pair is trading in a local downtrend which we know by looking at the previous 1W candle which is red. On the 1H timeframe the pair is going down too. The pair is oversold because the price is close to the lower band of the BB indicator. So we are looking to buy the pair with the lower BB line acting as support. The next target is 0.505 area.
✅LIKE AND COMMENT MY IDEAS✅
