BTCUSD - Fast trade idea ?Low timeframe so can be invalid very quick
I think you can expect the same Pump & Dump move on Sunday ... but in the invert way
Dump came from news and now expect a second wave, then if we can just go back above 86k6 it would kinda confirm this bringing us hopefully to "normality"
Cheers
Bullish Patterns

Crypto Total Market Cap Headed towards 5TTotal Crypto marketcap has sit the support zone around 2.6T and successfully bounced back from the support after forming two wicks on the weekly candle. This is a good sign that there is still bullish momentum left in the overall crypto market.
Currently the market-cap is around 2.9T and steadily increasing. I'm expecting the further growth in the overall market cap and to reach 5T in the next couple of months.
Follows us for more updates.
Cheers
GreenCrypto

The US Dollar Index is Decreasing - Positive for Cryptocurrency#DXY #Analysis
Description
---------------------------------------------------------------
+ The Dollar Index has breached its support level and is now trading below it, moving toward the next support zone around $100.
+ This development is positive for Bitcoin and the broader cryptocurrency market, as the US Dollar Index typically declines during a bull run.
+ In the long term, I anticipate further declines, potentially reaching the $90 range.
---------------------------------------------------------------
Enhance, Trade, Grow
---------------------------------------------------------------
Feel free to share your thoughts and insights. Don't forget to like and follow us for more trading ideas and discussions.
Best Regards,
VectorAlgo

Bitcoin - 200 EMA is holding Strong#BTC #Analysis
Description
---------------------------------------------------------------
+ Bitcoin has successfully tested the 200 EMA line and rebounded effectively.
+ However, caution is still advised, as the price may revisit the EMA support line.
+ The strong performance of the EMA is a positive indicator, suggesting the bullish trend could persist after a few retests.
---------------------------------------------------------------
Enhance, Trade, Grow
---------------------------------------------------------------
Feel free to share your thoughts and insights. Don't forget to like and follow us for more trading ideas and discussions.
Best Regards,
VectorAlgo

ETH has two pending CME Gaps#ETH #Analysis
Description
---------------------------------------------------------------
+ ETH has two pending CME future gaps to filled.
+ First gap is around 2900-3400 range and second gap is around 2500-2600 range.
+ Sooner or later these CME gaps will get filled. I'm expecting Gap2 get filled in this or next month and Gap 1 in the second or third quarter.
---------------------------------------------------------------
Enhance, Trade, Grow
---------------------------------------------------------------
Feel free to share your thoughts and insights. Don't forget to like and follow us for more trading ideas and discussions.
Best Regards,
VectorAlgo

doge buy midterm"🌟 Welcome to Golden Candle! 🌟
We're a team of 📈 passionate traders 📉 who love sharing our 🔍 technical analysis insights 🔎 with the TradingView community. 🌎
Our goal is to provide 💡 valuable perspectives 💡 on market trends and patterns, but 🚫 please note that our analyses are not intended as buy or sell recommendations. 🚫
Instead, they reflect our own 💭 personal attitudes and thoughts. 💭
Follow along and 📚 learn 📚 from our analyses! 📊💡"

QNT could double in price quicker than you think!The QNT charts are looking incredible right now, and all ISO 20022 tokens are now exhibiting the same, or very similar, internal five-wave patterns that I believe are about to move up to the next level.
Although I don't own any QNT and have no plans to, many of my followers do. Either way, the charts are starting to look like a nice slice of cherry pie.
Good luck, and always use a stop loss!

LINK Trade Update: Recovery Bounce in Play Market Context:
LINK is showing a strong bounce off major support, signaling potential upside continuation. However, if the market remains bullish, key resistance levels at $20 and $24 should be monitored for potential take-profit zones.
Trade Management:
Previous Entry Around: $15.30
Updated Take Profit Zones:
$20.00 (First TP Zone - Key Resistance)
$24.00 (Second TP Zone - Strong Resistance Level)
If LINK flips $20 into support, it could extend toward $24 and beyond. Keeping an eye on overall market sentiment is crucial! 🚀

LTC Long OpportunityMarket Context:
LTC is testing the range's low support level, which presents a strong buying opportunity if support holds. A potential bounce from this level could lead to a move toward the next resistance zones.
Trade Details:
Entry Zone: $102.00
Take Profit Targets:
$109.00 - $115.00
$132 - $140
Stop Loss: Just below $98.00
This setup offers a good risk-to-reward ratio, making it an attractive trade for a possible reversal. 🚀

GOLD BULLS ARE GAINING STRENGTH|LONG
Hello, Friends!
We are targeting the 2,925.549 level area with our long trade on GOLD which is based on the fact that the pair is oversold on the BB band scale and is also approaching a support line below thus going us a good entry option.
✅LIKE AND COMMENT MY IDEAS✅

GBP/JPY BEST PLACE TO BUY FROM|LONG
Hello, Friends!
Previous week’s red candle means that for us the GBP/JPY pair is in the downtrend. And the current movement leg was also down but the support line will be hit soon and lower BB band proximity will signal an oversold condition so we will go for a counter-trend long trade with the target being at 191.478.
✅LIKE AND COMMENT MY IDEAS✅

LINK jump soonDouble bottom in LINK week chart. Last bottom is a higher low. Target is unpredictable but would say 5 to 10x btc is possible if we really enter an alt season stage.
Tomorrow might be a big day for crypto.

APT on the move!APT has been trading within a range between $5 support and $7.7 resistance.
Currently, APT is hovering around the lower bound of the range, so we will be looking for longs as long as it holds.
For the bulls to take over in the long term, a break above the $7.7 resistance is required.
Disclaimer:
This content is for informational purposes only and should not be considered financial or investment advice. Always do your own research and consult with a professional before making any investment decisions.

Gold (XAUUSD) - Inverse Head & Shoulders Breakout Setup!Hello everyone, i hope you all will be doing good in your life and your trading as well, let's discuss about Gold and it is showing a strong bullish setup with an inverse head and shoulders pattern on the 1-hour chart . This means buyers are stepping in , and a breakout above the $2,930-$2,932 neckline could push prices higher toward the next resistance at $2,954-$2,960 . A stop-loss around $2,910-$2,906 can help manage risk in case of a pullback. Watch for volume confirmation when the breakout happens—it’ll add more strength to the move!
If Gold breaks out and holds above the neckline , we could see a good upside rally as buyers take charge. But if it fails to sustain, we might see some consolidation or even a drop. Best approach? Wait for a clean breakout and retest before jumping in. Stay sharp, manage risk, and trade smart!
Disclaimer: This analysis is for educational purposes only. Please consult a financial advisor before making investment decisions.
If you Found this helpful? Don’t forget to like, share, and drop your thoughts in the comments below.

DXY + 10Y TANKING = BULL MARKETAs expected, the DXY is TANKING alongside the 10Y, and the WMA9 is finally breaking below the 20.
This combo is turbo juice for markets, as it allows Central Banks around the world to stimulate and opens the door for more growth in the US economy.
Ignore asset prices.
Focus on the macro.
This is a leading indicator.
HODL.

DXY (Bitcoin - Alt Season - Bullish) everyone suddenly started posting DXY chart so I figured I should give my 2 cents on it as well.
People are finding hopes in DXY but main charts are still BTC.D and USDT.D
Monthly Chart has the whole picture
Weekly Chart (above) is what interests us
Breaking that Green Macro Trendline will be the 1st step towards success!
remember how yesterday everyone and their mothers were bearish except me?
This drama will continue, ignore the noise...

Chainlink - Preparing for trend reversalBINANCE:LINKUSDT (1D CHART) Technical Analysis Update
LINK is currently trading at $16.39 and currently we are seeing trend reversal and heading towards breakout from the bearish trend, if the price continues the bullish momentum we expect a clear breakout and bullish start of the bullish trend.
Entry level: $ Enter after breakout 18
Stop Loss Level: $14
TakeProfit 1: $ 20
TakeProfit 2: $ 22
TakeProfit 3: $ 26
TakeProfit 4: $ 30
TakeProfit 5: $ 35
Max Leverage: 2x
Position Size: 1% of capital
Remember to set your stop loss.
Follow our TradingView account for more technical analysis updates. | Like, share, and comment your thoughts.
Cheers
GreenCrypto

TAO - Extremely Bullishone of the few coins which are about to go in sub-wave 3 of macro-wave 3
haven't bought this one yet but might rotate a few weak positions to this if the structure holds
no idea what's going to happen to AI tokens (haven't looked into things yet, no time on hand) - sharing this purely based on TA

eth buy midterm"🌟 Welcome to Golden Candle! 🌟
We're a team of 📈 passionate traders 📉 who love sharing our 🔍 technical analysis insights 🔎 with the TradingView community. 🌎
Our goal is to provide 💡 valuable perspectives 💡 on market trends and patterns, but 🚫 please note that our analyses are not intended as buy or sell recommendations. 🚫
Instead, they reflect our own 💭 personal attitudes and thoughts. 💭
Follow along and 📚 learn 📚 from our analyses! 📊💡"

CHFJPY - Important BreakoutHello Traders !
The CHFJPY reached the support level (0.82759 - 0.82602).
Currently, The lower high is broken (change of character)
So, I predict a bullish move🚀
_______________
TARGET: 169.200🎯

ADA is on the move!After Trump tweeted about a Crypto Strategic Reserve that includes XRP, SOL, and ADA, the crypto market went wild.
And the best performer from the list? You guessed it—ADA.
ADA has surged over 80%.
What’s next?
- A retest of the $0.84 structure could offer trend-following long opportunities.
- A breakout above the $1.17 range would signal a long-term bullish takeover.
Is ADA gearing up for another explosive move? Stay ahead of the game—follow us for real-time market insights, expert analysis, and the latest crypto trends! 🚀
Disclaimer:
This content is for informational purposes only and should not be considered financial or investment advice. Always do your own research and consult with a professional before making any investment decisions.

RUNE Long OpportunityMarket Context:
RUNE has been trading within a range for the past few weeks, and price has now retraced to the lower support level of this range. This presents a solid opportunity for a long entry targeting the next resistance levels.
Trade Details:
Entry Zone: $1.18
Take Profit Targets:
$1.30 - $1.35
$1.45 - $1.60
Stop Loss: Just below $1.10
This setup offers a strong risk-to-reward ratio, with potential for range-bound trading before a breakout. 🚀

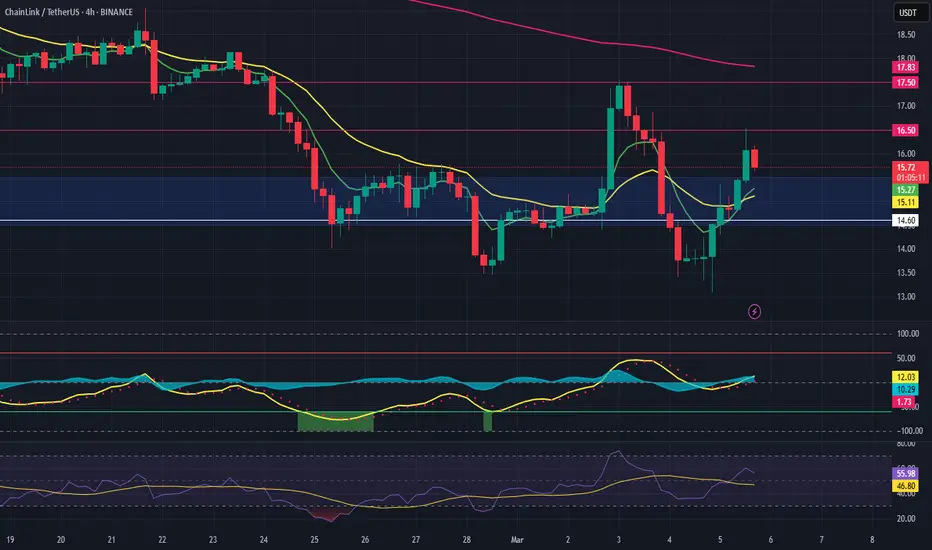
LINK Long OpportunityMarket Context:
LINK is currently testing the range's high support level at $15.30. A break and hold above this level could present a strong long opportunity for further upside.
Trade Details:
Entry Zone: $15.30
Take Profit Targets:
$16.50
$17.50
Stop Loss: Just below $14.60
This trade setup focuses on confirmation of strength at support, aiming for higher targets if the breakout sustains. 🔥