BITCOIN BULLS WILL DOMINATE THE MARKET|LONG
BITCOIN SIGNAL
Trade Direction: long
Entry Level: 104,686.94
Target Level: 111,091.02
Stop Loss: 100,407.14
RISK PROFILE
Risk level: medium
Suggested risk: 1%
Timeframe: 9h
Disclosure: I am part of Trade Nation's Influencer program and receive a monthly fee for using their TradingView charts in my analysis.
✅LIKE AND COMMENT MY IDEAS✅
Bullish Patterns

SEIHead and Shoulder Pattern is seen in the chart,
Breakout of Neckline will give a huge pump 🚀🚀🚀
Can grab some here 💰

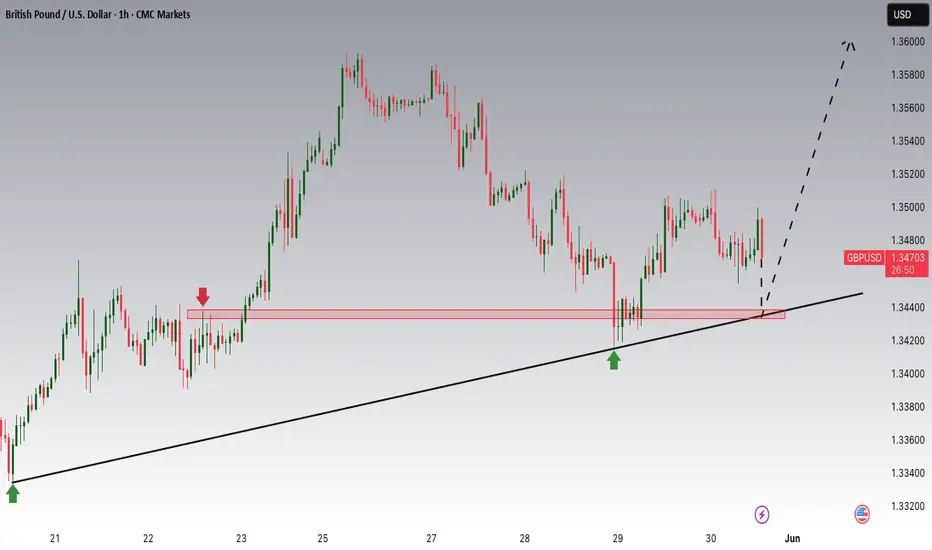
GBPUSD is Nearing an Important Support!!Hey Traders, in today's trading session we are monitoring GBPUSD for a buying opportunity around 1.34400 zone, GBPUSD is trading in an uptrend and currently is in a correction phase in which it is approaching the trend at 1.34400 support and resistance area.
Trade safe, Joe.
Render – Re-Entry Opportunity After Hitting First TargetRENDER hit the first take profit target (TP1) with a ~52% gain — great execution. Now, after the expected pullback, price is approaching a key support zone, offering a second swing trade opportunity.
🔹 Entry Zone:
Around $4.00 support
🔁 Previous resistance turned support
🧭 Psychological level and structural base
🎯 Take Profit Targets:
🥇 $4.80 (recent local high / resistance)
🥈 $5.40 (next significant supply zone)
🛑 Stop Loss:
$3.69 (below key support & invalidation level)

Toast, Inc. (TOST) – Powering the Future of RestaurantsCompany Snapshot:
Toast NYSE:TOST is cementing its position as the go-to restaurant operating system, offering integrated solutions for payments, POS, inventory, and guest engagement—all tailored for food service businesses.
Key Catalysts:
Recurring Revenue Powerhouse 💸
ARR hit $1.7B in Q1 2025 — up 31% YoY
SaaS-driven model provides high visibility and stickiness
Expanding Client Base & Network Effects 📈
Serving ~140,000 locations, up 25% YoY
More locations = richer data + stronger product improvement + increased client lock-in
Enterprise-Grade Momentum 🏢🍔
Wins with Applebee’s (~1,500 locations) and Topgolf demonstrate Toast's scalability
Validates ability to support complex, high-volume operators
Operating Leverage in Motion ⚙️
As ARR scales, margins improve—positioning Toast for profitable growth over time
Investment Outlook:
✅ Bullish Above: $37.00–$38.00
🚀 Target: $60.00–$62.00
📈 Growth Drivers: Enterprise adoption, recurring revenue, SaaS scale, network effects
💡 Toast is becoming the digital backbone of modern restaurants—serving up growth with every seat. #TOST #SaaS #RestaurantTech

Gold Strong Pullbacks But Long Term Image Still Bullish!!!Hey Traders, in today's trading session we are monitoring XAUUSD for a buying opportunity around 3,200 zone, Gold is trading in an uptrend and currently is in a correction phase in which it is approaching the trend at 3,200 support and resistance area.
Trade safe, Joe.

NZD/CHF LONG FROM SUPPORT
Hello, Friends!
The BB lower band is nearby so NZD-CHF is in the oversold territory. Thus, despite the downtrend on the 1W timeframe I think that we will see a bullish reaction from the support line below and a move up towards the target at around 0.495.
Disclosure: I am part of Trade Nation's Influencer program and receive a monthly fee for using their TradingView charts in my analysis.
✅LIKE AND COMMENT MY IDEAS✅

USD/JPY BEST PLACE TO BUY FROM|LONG
USD/JPY SIGNAL
Trade Direction: long
Entry Level: 143.655
Target Level: 145.800
Stop Loss: 142.221
RISK PROFILE
Risk level: medium
Suggested risk: 1%
Timeframe: 3h
Disclosure: I am part of Trade Nation's Influencer program and receive a monthly fee for using their TradingView charts in my analysis.
✅LIKE AND COMMENT MY IDEAS✅

BUY GOLDIn todays session we are monitoring GOLD for buying position. Our entries are at 3295 and targets are above 3361. Our stops are below 3278. Use proper risk management. Good luck to you all.

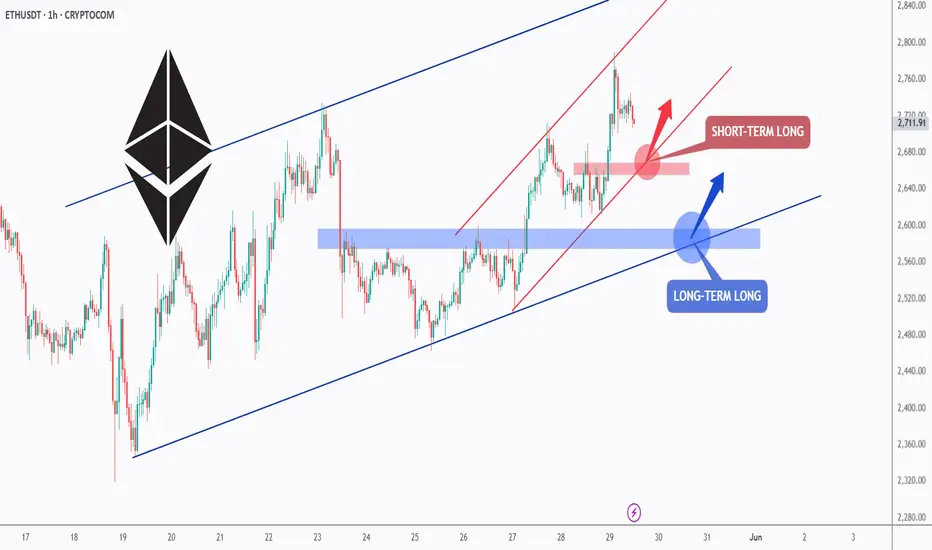
ETH - Long Anyway, Short-term and Long-term!Hello TradingView Family / Fellow Traders. This is Richard, also known as theSignalyst.
📈ETH has been overall bullish trading within the rising blue channel from a long-term perspective and within the rising red channel from a short-term perspective.
Moreover, the red and blue zones are strong support and structure!
🏹 Thus, the highlighted blue and red circles are strong areas to look for buy setups as it is the intersection of the lower zone(s) and trendline(s).
📚 As per my trading style:
As #ETH approaches one of the circles, I will be looking for bullish reversal setups (like a double bottom pattern, trendline break , and so on...)
📚 Always follow your trading plan regarding entry, risk management, and trade management.
Good luck!
All Strategies Are Good; If Managed Properly!
~Rich
$TOTAL Crypto Market Cap BREAKDOWN You don't want me to draw the squigglets that come after if it plays out like this 🥸

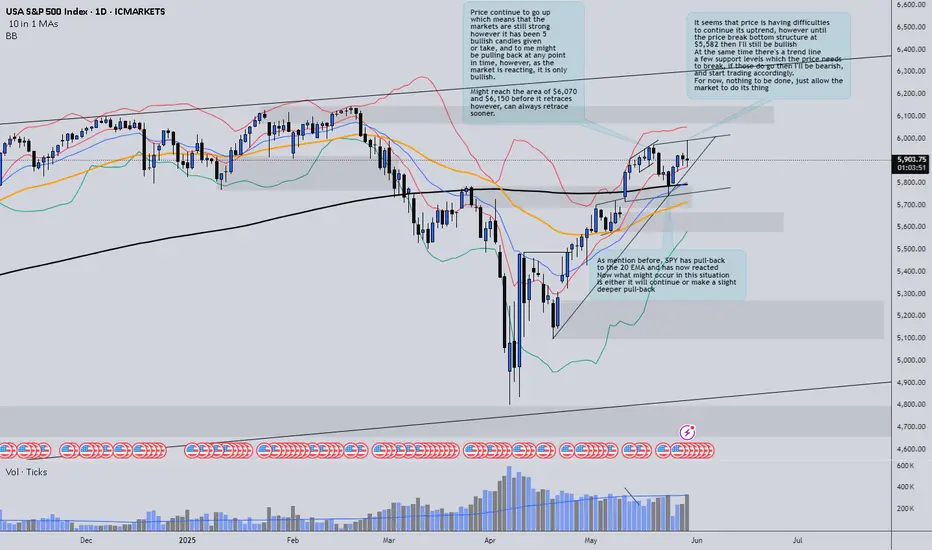
SPY update - still bullish!In today’s session, we saw an increase in volume without significant price movement. This could indicate underlying uncertainty or a potential shift in momentum.
At the moment, price is still respecting a key trend line and several support levels. Until these are broken, it's too early to confirm whether the broader market is turning bearish.
🧠 I also want to point out that the price is forming an ascending channel, often a reversal pattern, especially when occurring at market highs. While we’re seeing some bearish signs, it’s crucial to remain patient and let the market show its hand.
📊 As always, the key is to observe, not assume, and be ready to adapt as the price action develops.
Thanks for watching the update, I hope it brought some insight and value to your trading journey!
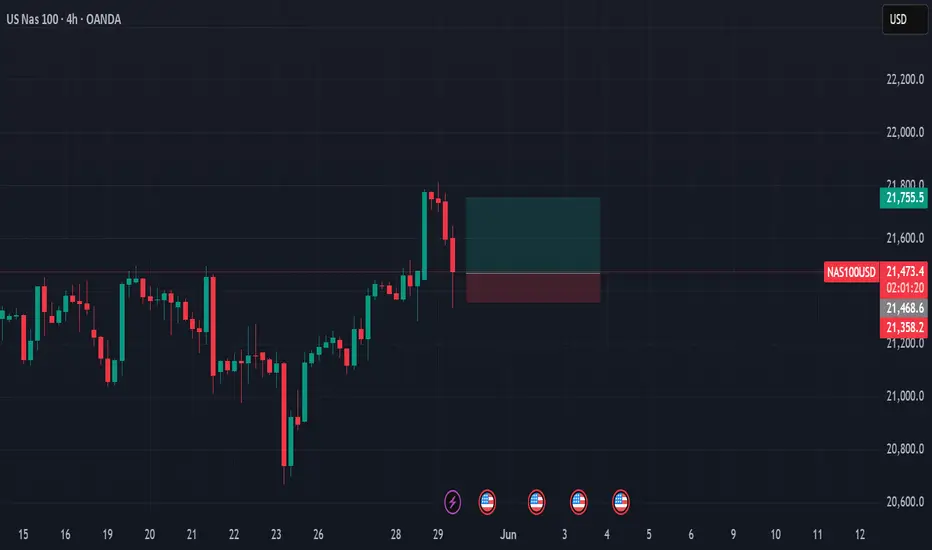
4hr break and retestgoing long here, price action is nice and simple
i am aiming for a 50 percent retracement to or close to the gerneral price action where it has previously broke out
USOIL - Bullish Double BottomHello Traders !
The USOIL price formed a double bottom pattern.
Currently, The neckline is broken !
So, I expect a bullish move🚀
_______________
TARGET: 63.49🎯

Ethereum is Approaching a Key Support!Hey Traders, in today's trading session we are monitoring ETH/USDT for a buying opportunity around 2,650 zone, Ethereum is trading in an uptrend and currently is in a correction phase in which it is approaching the trend at 2,650 support and resistance area.
Trade safe, Joe.

SIGN/USDT – Bullish Breakout Alert!🚀 SIGN Breakout Alert – 80% Potential Incoming?! 👀🔥
Hey Traders! If you're all about high-conviction plays and real alpha, smash that 👍 and tap Follow for more setups that actually deliver! 💹💯
SIGN has just broken out from a symmetrical triangle after consolidating tightly for weeks. The breakout is supported by strong volume and a solid bounce from the base of the structure.
Entry: $0.082 - $0.085 (post-breakout zone)
Targets:
• $0.095
• $0.112
• $0.134
• $0.159
Stop-loss: Below $0.076
Risk-Reward: Over 6:1 — Excellent setup for trend traders.
This move could mark the beginning of a strong upside wave. Keep it on your radar and manage your risk accordingly!
Let me know your thoughts or if you're riding this one too!

CADJPY - NEW BREAKOUT !Hello Traders !
The CADJPY price formed a descending channel.
Currently, The resistance line is broken !
So, I expect a bullish move🚀
_______________
TARGET: 105.390🎯

Potential ETH IH&S Continuation (4H)BINANCE:ETHUSDT might be forming an Inverse Head & Shoulders on the 4H chart.
• A right shoulder around ~$2400 would complete the pattern
• Confirmation comes with a breakout above the $2730 neckline
• Measured move target: ~$3130
Keep an eye on ~$2800 – it's a key daily/weekly S/R that could provide strong resistance and possibly stall the breakout.
In a No-Trade Zone until either a bounce from $2400 or a break above $2730.

Bitcoin is Nearing a Key Support Level!!!Hey Traders, in today's trading session we are monitoring BTCUSDT for a buying opportunity around 107,000 zone, Bitcoin is trading in an uptrend and currently is in a correction phase in which it is approaching the trend at 107,000 support and resistance area.
Trade safe, Joe.

WLD (Worldcoin) – Long Spot Trade Setup After 180% RallyAfter a massive 180% surge, WLD is showing signs of exhaustion and is likely to retrace toward the next major support zone. A pullback into the $1.22 – $1.35 area provides a favorable entry opportunity for continuation of the trend, assuming support holds.
🔹 Entry Zone (Support):
$1.22 – $1.35
🎯 Take Profit Targets:
🥇 $1.65 – $1.85 (prior consolidation and resistance zone)
🥈 $2.40 – $2.65 (upper range resistance / extension target)
🛑 Stop Loss:
Just below $1.10 (below structural support and invalidation level)

Credo Technology Group (CRDO) – Powering the AI Data Center BoomCompany Snapshot:
Credo Technology NASDAQ:CRDO is a rising star in AI infrastructure, delivering high-speed, low-power connectivity solutions that are mission-critical to modern data centers.
Key Catalysts:
AI Infrastructure Tailwinds 🧠🏢
Direct exposure to Active Electrical Cables (AEC) and PCIe retimers
Positioned for rapid demand acceleration from AI, cloud, and hyperscale data centers
AEC chip market expected to grow 15x from $68M (2023) to $1B+ by 2028
Sticky Software + Hardware Model 🧩
PILOT software platform offers real-time diagnostics and performance tuning
Enables a recurring revenue model and strengthens customer retention
Scalable, Energy-Efficient Portfolio ⚡🌐
High-bandwidth, low-power design aligns with sustainability goals of large data centers
Integrated solutions are already seeing early adoption momentum
Investment Outlook:
✅ Bullish Above: $51.00–$52.00
🚀 Upside Target: $90.00–$92.00
📈 Growth Drivers: AI infrastructure demand, software expansion, chip market scale
💡 Credo isn’t just riding the AI wave—it’s building the rails for it. #CRDO #AIInfrastructure #Semiconductors

NIFTY 1W forecast until August 2025India's stock market is correcting now. The correction will be short and not deep - just a normal retest of 24,500 but should not make a weekly close below 24,250 during the first half of June 2025.
A major bullrun will start in the middle of June 2025. Slowly at first, but explosive during summer.
It will find its top in August 2025 at the level of 27,800
Here I publish 1W charts, for weekly 1D charts check my profile for more ways to keep in touch

DOTUSD📊 30m Analysis – DOTUSD
Strategy: 🐊 Alligator Strategy
Trend: 📈 Strong Uptrend
📝 Trade Plan
🎯 Entry Point (EP): 4.603
🛡️ Stop Loss (SL): 4.530
💰 Take Profit 1 (TP1): 4.680
💰 Take Profit 1 (TP1):4.75
Risk Reward 1:1 TP1
Risk Reward 1:2 TP2
