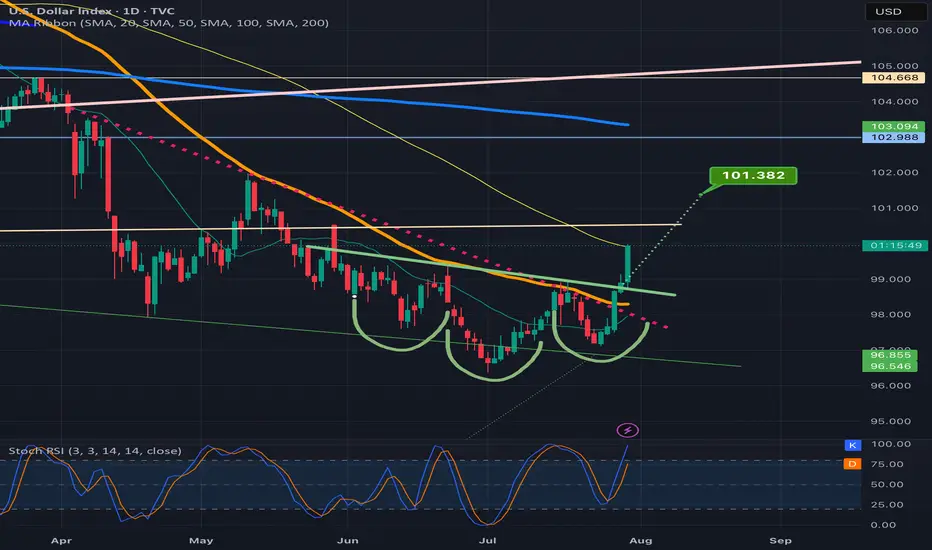
DXY attempting an inverse H&S breakoutSeeing a big green candle today on dxy after confirming the neckline of the inverse head and shoulders pattern as support on the previous daily candle.
Bullishbreakout
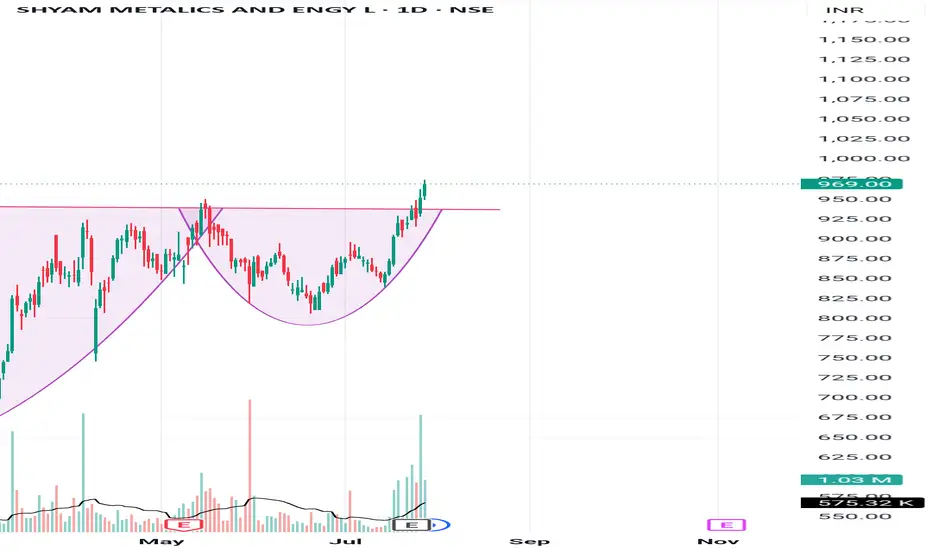
Cup and handle patternBreaks cup and handle pattern and going up. Looks bullish. Make sure to do your own analysis and maintain your risk management. This is only for educational purposes
virtuals breaking up from a symmetrical triangle w/a 3x + trgtIf this pattern validates its breakout, the measured move target from here is over 3x. *not financial advice*

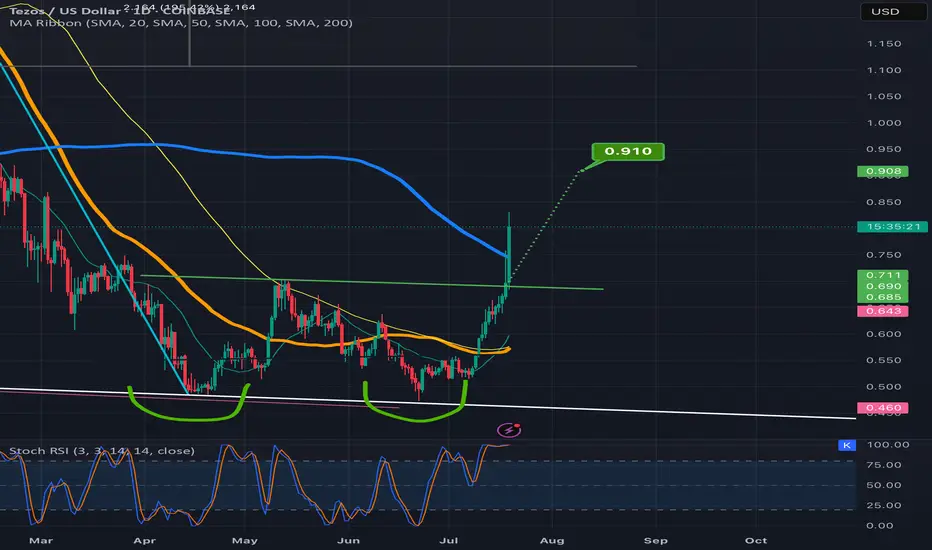
Tezos heading for a double bottom breakout targetPrice action is well above the neckline and already over halfway to the target. *not financial advice*
Algorand breaking up from inverse head and shouldersSeems like most of the cryptos from the iso20022 compliant chains are breaking out right now and algorand is no exception. Most likely in anticipation of Fednow’s migration to it tomorrow. *not financial advice*

EURUSD Approaching Liquidity Shelf — Watch for Reaction at 1.164EURUSD remains firmly bullish on all major timeframes, respecting the internal structure of an ascending channel.
• Daily: Price continues to respect both the red trendline and broader purple bullish channel. Buyers are defending the mid-line and pushing toward the upper boundary.
• 4H: Clear higher highs and higher lows. Price recently revisited and bounced off a 4H demand zone (1.14750–1.15000), and is now testing the liquidity zone at 1.16400.
• 1H: Microstructure shows consolidation and possible absorption of liquidity just beneath the 1.16415 high. A clean break and retest of this level may confirm continuation.
Key Levels:
• Resistance: 1.16415 (previous high and liquidity trap)
• Support: 1.14900 (4H demand zone)
• Daily trendline holding as dynamic support
Trade Plan:
• Longs: Await a break and retest of 1.16415 or a retracement to 1.15600 for a more discounted entry.
• Shorts: Not favored unless a strong bearish engulfing forms below 1.1600 with structure shift on the 1H.

PRINCE PIPES FITTINGS - Bullish Flag & Pole Breakout (Daily T/F)Trade Setup
📌 Stock: PRINCE PIPES FITTINGS ( NSE:PRINCEPIPE )
📌 Trend: Strong Bullish Momentum
📌 Risk-Reward Ratio: 1:3 (Favorable)
🎯 Entry Zone: ₹339.00 (Breakout Confirmation)
🛑 Stop Loss: ₹298.00 (Daily Closing Basis) (-12 % Risk)
🎯 Target Levels:
₹352.70
₹366.95
₹381.80
₹397.45
₹413.00
₹428.50
₹444.15
₹461.25 (Final Target)
Technical Rationale
✅ Bullish Flag & Pole Breakout - Classic bullish pattern confirming uptrend continuation
✅ Strong Momentum - Daily RSI > 60 & Weekly RSI >50
✅ Volume Confirmation - Breakout volume 903.21K vs previous day's 324.65K (Nearly 3x surge)
✅ Multi-Timeframe Alignment - Daily and weekly charts showing strength
Key Observations
• The breakout comes with significantly higher volume, validating strength
• Well-defined pattern with clear price & volume breakout
• Conservative stop loss at recent swing low
Trade Management Strategy
• Consider partial profit booking at each target level
• Move stop loss to breakeven after Target 1 is achieved
• Trail stop loss to protect profits as price progresses
Disclaimer ⚠️
This analysis is strictly for educational purposes and should not be construed as financial advice. Trading in equities involves substantial risk of capital loss. Past performance is not indicative of future results. Always conduct your own research, consider your risk appetite, and consult a financial advisor before making any investment decisions. The author assumes no responsibility for any trading outcomes based on this information.
What do you think? Are you watching NSE:PRINCEPIPE for this breakout opportunity? Share your views in the comments!

KAJARIA CERAMICS - Bullish Flag & Pole Breakout (Daily T/F)Trade Setup
📌 Stock: KAJARIA CERAMICS( NSE:KAJARIACER )
📌 Trend: Strong Bullish Momentum
📌 Risk-Reward Ratio: 1:3 (Favorable)
🎯 Entry Zone: ₹1065.00 (Breakout Confirmation)
🛑 Stop Loss: ₹965.00 (Daily Closing Basis) (-9 % Risk)
🎯 Target Levels:
₹1103.40
₹1143.15
₹1184.35
₹1227.05
₹1271.25
₹1317.10
₹1359.50 (Final Target)
Technical Rationale
✅ Bullish Flag & Pole Breakout - Classic bullish pattern confirming uptrend continuation
✅ Strong Momentum - Daily, Weekly RSI >60 (Bullish zone)
✅ Volume Confirmation - Breakout volume 608.73K vs previous day's 302.91K (Nearly 2x surge)
✅ Multi-Timeframe Alignment - Daily and weekly charts showing strength
Key Observations
• The breakout comes with significantly higher volume, validating strength
• Well-defined pattern with clear price & volume breakout
• Conservative stop loss at recent swing low
Trade Management Strategy
• Consider partial profit booking at each target level
• Move stop loss to breakeven after Target 1 is achieved
• Trail stop loss to protect profits as price progresses
Disclaimer ⚠️
This analysis is strictly for educational purposes and should not be construed as financial advice. Trading in equities involves substantial risk of capital loss. Past performance is not indicative of future results. Always conduct your own research, consider your risk appetite, and consult a financial advisor before making any investment decisions. The author assumes no responsibility for any trading outcomes based on this information.
What do you think? Are you watching NSE:KAJARIACER for this breakout opportunity? Share your views in the comments!

Tesla (TSLA) – From EV Giant to Tech & Energy Ecosystem Titan Update Summary:
Tesla NASDAQ:TSLA continues its transformation beyond vehicles, building a vertically integrated platform across mobility, energy, AI, and infrastructure. We maintain a bullish stance above $270.00–$275.00, with an upside target of $470.00–$480.00 based on multi-revenue stream expansion and high-margin software/service potential.
🧩 Key Growth Catalysts:
🔌 Supercharger Network Monetization
Now open to non-Tesla EVs, creating a recurring infrastructure revenue stream
Margins likely higher than vehicle hardware—similar to SaaS economics at scale
Reinforces Tesla’s ecosystem lock-in and increases brand leverage
🤖 Robo-Taxi & FSD Platform
Robo-taxi launch expected in late 2025/2026 could redefine Tesla as a Mobility-as-a-Service (MaaS) provider
Software-like margins from Full Self-Driving (FSD) subscriptions and usage fees
Establishes a powerful network effects moat
🔋 Energy + AI Synergies
Growth in Powerwall, Megapack, and solar deployments
Custom AI chips powering FSD could open new B2B licensing opportunities
AI + energy + hardware = long-term defensibility and scalability
🌍 Macro Support:
Global EV penetration projected to exceed 45% by 2030
U.S. and EU incentive tailwinds + rising fuel costs accelerate EV demand
Rising demand for grid-scale energy storage bolsters Tesla Energy segment
📈 Trade Setup & Price Targets:
✅ Entry Zone: $270.00–$275.00
🎯 Target Range: $470.00–$480.00
⏳ Time Horizon: 6–12 months (event-driven upside with robo-taxi and earnings catalysts)
🧠 Investment Thesis Summary:
Tesla is no longer just an automaker. It’s an ecosystem-first, AI-powered energy and tech company building infrastructure, platforms, and software at scale. The convergence of hardware, energy storage, and autonomy makes TSLA a rare multi-vector growth story with a durable long-term edge.
#Tesla #TSLA #EV #FSD #MobilityAsAService #EnergyStorage #TechEcosystem #BullishBreakout

"Nifty 50 Near Resistance: Wedge Signals Reversal or Breakout"1. Trend Channel: The index is moving within a well-defined **upward sloping channel**, marked by two parallel purple trendlines.
* Price is currently hovering near the **upper boundary** of the broader ascending channel — a potential area for either breakout or rejection.
2. Short-Term Rising Wedge: A narrow rising wedge is visible (formed with tighter converging trendlines in the last few candles).
* Rising wedges are generally considered bearish reversal patterns, especially near resistance zones, suggesting potential for a pullback.
3. Resistance Levels: 25,031.30 : Immediate resistance (recent high & wedge upper boundary). A breakout above this could lead to a strong bullish continuation.
Upper channel trendline: Around 25,050–25,100 zone — further confluence resistance.
4. Support Levels: 24,982.55 Near-term support (bottom of the wedge structure). A breakdown below this level confirms wedge breakdown.
24,767.50 : Strong horizontal support from prior consolidation zone.
24,561.90, 24,407.75, and 24,272.20 : Sequential key support levels for downside targets if a breakdown accelerates.
**Volume Analysis:**
1. Volume Spike seen during the recent bullish candles, indicating strong buying interest. However, during the formation of the wedge, volume has declined, signaling weakening momentum— a typical precursor to a breakout or breakdown.
Possible Scenarios:
Bullish Scenario:
Break above 25,031.30 with volume could initiate a **fresh leg of uptrend**, possibly targeting the upper end of the channel (\~25,100+).
Bearish Scenario:
Breakdown below 24,982.55 from the wedge pattern could trigger a **short-term correction**, with immediate targets at 24,767.50 and 24,561.90.
The bearish divergence between price action and declining volume further supports this view.

Weekly Market Wrap: Nifty Surges Past 25,000 – What's Next? The Nifty 50 index closed the week at 25,019, posting an impressive 1,000-point rally from the previous week’s close. The index made a high of 25,116 and a low of 24,378. The rally was driven by short covering and a surprise truce between India and Pakistan, which injected a wave of optimism into the market.
More importantly, Nifty broke out of the consolidation range of 23,200–24,600, closing strong above the psychologically significant 25,000 mark – a clear sign of bullish sentiment.
What to Expect Next Week (Outlook May 20–24)
Expected Range: 24,450 – 25,600
A breakout above 25,600 could open the doors for a retest of the all-time high (ATH) at 26,277.
As long as Nifty trades above 23,800, the broader trend remains intact.
Monthly Chart Patterns to Watch
A bullish "W" pattern could be forming, which ideally would require a pullback from current levels before resuming upward.
On the flip side, a bearish "M" pattern may emerge if the index tests ATH and faces rejection, which could trigger a sharp correction of 2,500–2,600 points.
For now, I remain cautious until the monthly time frame confirms a clear bullish breakout.
Global Markets Check: S&P 500 Eyes Key Resistance
The S&P 500 closed at 5,958, gaining 300 points week-on-week. As anticipated, a breakout above 5,770 propelled the index to meet all short-term targets of 5,821 / 5,850 / 5,900.
Key Level to Watch: 6,013
This is a major Fibonacci resistance — the same level where the market started correcting back on March 3, 2025.
A weekly close above 6,013 would be bullish, potentially triggering rallies toward 6,091 / 6,142 / 6,225.
However, a breakdown below this week’s low of 5,786 would confirm a failed breakout, with downside targets at 5,637 / 5,551 / 5,458.
Momentum traders, get ready – sharp moves are coming either way!

Equity Research Report – TIMKEN India Ltd 📌 CMP (May 2, 2025): ₹2,728
🧭 Sector: Industrial Bearings & Motion Solutions
📈 Signal: Breakout from falling channel with strong volume confirmation
🔹 Technical Summary
Breakout Pattern: Price has decisively broken out of a long-term falling channel after a 10-month downtrend.
Volume Spike: Breakout accompanied by significant volume spike (highest in over a year) – strong institutional interest.
Momentum: RSI has broken above resistance line (~55), confirming bullish momentum.
🧭 Trade Setup
✅ Buy Zone (Swing Trade/Positional)
Buy Above: ₹2,750
Target 1: ₹2,900
Target 2: ₹3,050
Target 3: ₹3,280
Stop-Loss: ₹2,490 (just below recent breakout candle)
Timeframe: 2–6 weeks
Risk-Reward Ratio: ~1:2.5 (good for swing setups)
🚫 Invalidation Level:
Breakdown and close below ₹2,490 on weekly timeframe.
For Education purposes only

Sui broke above the wedge & is already over halfway 2 the targetSUUSD has had a very notable pump on this uptrend which hopefully will end up being the beginning of confirming a real sustained uptrend in the alt market. *not financial advice*

Equity Research Report – Polycab India Ltd.✅ Buy Levels
Buy Above: ₹5,800 (post breakout confirmation)
Ideal Entry on Dip: ₹5,765–₹5,785
🎯 Targets
Timeframe Target 1 Target 2 Target 3
15-min ₹5,870 ₹5,950 ₹6,070
1-hour ₹6,070 ₹6,220 ₹6,427 (Fib 61.8%)
🔻 Stop Loss
Intraday SL: ₹5,720
Positional SL: ₹5,650 (below trendline support and 20 EMA)
For Education purposes only

SBIN Breakout Alert | Strong Volume + RSI Confirmation🔍 Chart Analysis Summary
Pattern: Stock has broken out of a clear consolidation range (highlighted in blue), suggesting bullish momentum.
Volume Spike: Notable surge in volume (blue arrow), confirming the breakout strength.
RSI: RSI has broken above the 60–65 zone, indicating strong bullish momentum.
Price Action: The breakout occurred above ₹775–₹780 resistance, now acting as support.
🟢 Recommendation: BUY
Action Level (INR)
Buy Above ₹785–₹790 (on minor dips or current price)
Target 1 ₹835
Target 2 ₹875
Stoploss ₹755 (below the breakout support zone)
for educational purposes only

JUSTDIAL LTD Falling Wedge (Bullish breakout)🔁 Chart Analysis Summary
Weekly RSI is reversing from oversold levels and shows bullish divergence.
Volume on breakout candle confirms strength.
Clear breakout above falling wedge indicates a trend reversal.
✅ Buy Recommendation
Buy above: ₹925 (Confirmation of breakout)
Target 1: ₹1,050
Target 2: ₹1,250
Target 3: ₹1,400+ (Long-term potential based on pattern projection)
❌ Stop Loss
SL: ₹840 (Below wedge support & recent low)
for educational purposes only

Sanathan Textiles | Breakout After Rounded Bottom Setup Overview:
The stock has formed a rounded bottom pattern, indicating accumulation and a potential breakout.
Strong bullish weekly candle with a 10% gain and breakout above resistance box.
RSI showing an upward breakout from oversold zone = bullish momentum building.
Recommendation
Buy Zone: ₹410–₹420 (current market price ₹417.60)
Stoploss: ₹378 (below last higher low and box bottom)
Target 1: ₹480
Target 2: ₹525
Target 3 (swing): ₹600+
⏳ Ideal for swing to medium-term traders (1–8 weeks holding time).
for educational purposes only

M&Mi Observed these Levels based on Price Action and Demand & Supply which is my own Concept "PENDAM CONCEPTS"... Please don't take any trades based on this chart/post... Because this chart is for educational purpose only not for Buy or Sell Recommendation... Thank Q

JPY/USD Technical Analysis – Bullish Breakout from Falling WedgeIntroduction
The JPY/USD chart showcases a classic falling wedge pattern, a strong bullish reversal signal. This pattern is characterized by converging downward-sloping trendlines, indicating a weakening bearish momentum. Eventually, buyers stepped in, leading to a breakout to the upside. This analysis breaks down key elements, including support and resistance zones, trendlines, trading strategy, and risk management.
1. Breakdown of the Chart Pattern
A. The Falling Wedge Formation (Bullish Reversal Pattern)
A falling wedge is a bullish technical pattern that forms when the price consolidates within two downward-sloping trendlines that converge over time. This signals that selling pressure is decreasing and a reversal may be near.
Downtrend Structure: The price was previously in a consistent downtrend, making lower highs and lower lows, which formed the wedge.
Breakout Confirmation: Once the price broke above the upper trendline, the pattern was confirmed, indicating the start of a bullish move.
Retest Possibility: Often, after a breakout, the price retests the upper trendline before continuing higher. If it holds, it strengthens the bullish outlook.
B. Key Levels Identified in the Chart
1. Support Zone (Buying Area)
The price found strong support in the 0.006291 – 0.006500 region.
Buyers stepped in, preventing the price from dropping further.
This support level coincides with the bottom of the wedge, further validating its importance.
2. Resistance Zone (Profit Target)
The 0.007100 – 0.007200 area is a major resistance level where sellers have previously dominated.
If the price reaches this level and consolidates, traders will look for either a breakout or a rejection.
A break above 0.007200 would indicate further bullish continuation.
3. Trendlines & Curve Formation
A curved trendline in the chart suggests a gradual transition from bearish to bullish momentum.
The dotted ascending trendline now acts as dynamic support, helping the price sustain its bullish move.
2. Trading Strategy & Risk Management
A. Entry Strategies
Traders have two primary ways to enter this trade:
Aggressive Entry:
Enter immediately after the breakout of the wedge.
Higher risk but captures early momentum.
Conservative Entry:
Wait for a pullback to the trendline before entering.
Lower risk as it confirms trend continuation.
B. Take Profit Targets
Primary Target: 0.007117 (Resistance level from previous highs).
Extended Target: 0.007200 (Next significant resistance).
C. Stop Loss Placement
Below the recent swing low at 0.006291 to protect against false breakouts.
Ensures a favorable risk-to-reward ratio.
3. Market Sentiment & Confirmation Signals
✅ Bullish Confirmation
Breakout from the falling wedge
Price holding above the trendline
Higher highs and higher lows formation
Increased buying volume
⚠️ Bearish Risks & Invalidations
A break below the trendline would indicate weak momentum.
If the price fails to hold support, it could reverse downward.
Low volume on the breakout could signal a fake breakout.
4. Final Thoughts
This setup provides a high-probability trading opportunity following the breakout from a falling wedge pattern. The risk-to-reward ratio is favorable, making it an ideal setup for trend-following traders. However, patience is key—waiting for a successful retest before entering can minimize risks. If the price maintains momentum, we could see a rally toward the 0.007100 – 0.007200 resistance zone in the coming weeks. 🚀

EUR/USD 1H Chart Analysis – Falling Wedge Breakout StrategyOverview of the Chart
The EUR/USD 1-hour chart is forming a falling wedge pattern, which is a bullish reversal setup. This indicates that although the price has been trending downward, the selling pressure is weakening, and a breakout to the upside is becoming more likely.
Currently, the price has broken above the wedge, signaling potential trend reversal. However, traders should watch for a retest of the breakout level to confirm whether the price holds above the resistance-turned-support area before further upward movement.
Key Components of the Chart
1️⃣ Falling Wedge Pattern (Bullish Reversal Signal)
A falling wedge consists of two downward-sloping trendlines that converge, showing a narrowing price range. This pattern is formed when:
The price makes lower highs and lower lows, indicating a downtrend.
The slope of the lower trendline is less steep than the upper one, meaning sellers are losing momentum.
Eventually, the price breaks out above the upper trendline, confirming a bullish reversal.
2️⃣ Support & Resistance Levels
✅ Support Zone (Key Demand Area)
The price recently tested a strong support level (highlighted in beige), where buyers aggressively entered the market.
This level has held multiple times, indicating that buyers are stepping in whenever the price reaches this zone.
The green upward arrow suggests that this is a key accumulation area, where demand is stronger than supply.
🚫 Resistance Zone (Profit Target)
The resistance zone near 1.09450 is the first major target for bulls.
Historically, price action has struggled to break through this level, making it a logical place to take profits.
3️⃣ Breakout Confirmation & Retest
The price has successfully broken out above the falling wedge, which is a strong buy signal.
However, a retest of the breakout level (marked by the yellow circle) might occur before further bullish continuation.
If the price retests and holds above the previous resistance (now support), this will confirm the breakout and provide an additional buying opportunity.
Trade Execution Strategy
📌 Entry Point:
Enter a long trade after the breakout confirmation.
For conservative traders, waiting for a successful retest before entering can reduce risk.
📌 Stop-Loss Placement:
Place a stop loss just below the recent swing low at 1.07541 to limit downside risk.
This ensures that if the breakout fails, the trade is exited with minimal loss.
📌 Profit Target:
The first take-profit target is at 1.09450, the key resistance level.
If bullish momentum continues, traders can look for higher targets based on price action.
📌 Risk-to-Reward Ratio:
This setup provides a favorable risk-to-reward ratio, meaning that potential profits outweigh the risk taken on the trade.
Technical Indicators Supporting the Trade
📈 Trend Reversal Signals
The market has been in a downtrend, but the falling wedge signals a potential reversal.
A higher low after the breakout would further confirm the uptrend.
📊 Volume Confirmation
Ideally, a breakout should be accompanied by increased volume, showing strong buying pressure.
If volume is low, a false breakout could occur, requiring careful trade management.
🔍 Retest & Price Action
A retest of the breakout level should hold above the wedge to confirm bullish momentum.
If the price fails to hold and falls back below, the breakout may have been a fakeout, meaning traders should exit or wait for re-entry.
Risk Management & Trade Considerations
Always use a stop-loss to manage risk.
If the price fails to stay above the breakout level, consider exiting early.
Watch for external market factors such as news events or economic data releases, which can impact EUR/USD volatility.
Conclusion: Bullish Momentum is Building 🚀
This falling wedge breakout on the EUR/USD chart provides a high-probability long trade setup. As long as price holds above the breakout level, bullish continuation toward 1.09450 is expected. Traders should monitor price action carefully and adjust their positions accordingly to maximize gains while managing risks.

EUR/GBP Chart Analysis – Inverse Head & Shoulders Bullish SetupThis EUR/GBP 1-hour chart showcases a classic Inverse Head & Shoulders (H&S) pattern, signaling a potential trend reversal from bearish to bullish. This pattern is considered one of the most reliable technical formations for spotting upcoming upward momentum, particularly after a prolonged downtrend.
🔎 Market Overview
Currency Pair: EUR/GBP
Timeframe: 1-Hour (H1)
Current Price: 0.83720
Trend: Transitioning from a downtrend to a potential bullish breakout
Key Pattern: Inverse Head & Shoulders
Trading Bias: Bullish (Pending breakout confirmation)
📊 Chart Breakdown & Technical Analysis
1️⃣ Market Structure & Trend Analysis
Before the formation of the Inverse Head & Shoulders, the market was in a strong downtrend, making lower highs and lower lows. However, buyers started stepping in near the 0.8350 level, preventing further decline. This rejection at key support has set the stage for a potential trend reversal.
Left Shoulder: Price formed a minor low around 0.8370, followed by a small bounce.
Head: Price made a deeper low around 0.8351, confirming strong support and buyer interest.
Right Shoulder: Price attempted another dip but failed to break below the previous low, forming a higher low near 0.8370, signaling increasing bullish pressure.
Neckline Resistance: 0.8385 - 0.8390 zone – a crucial level that price needs to break for confirmation of an uptrend.
2️⃣ Key Support & Resistance Levels
Support Level: 0.83513 (Major demand zone)
Resistance Levels:
Neckline: 0.8385 - 0.8390 (Breakout confirmation zone)
Major Resistance: 0.84308 (Target level)
Curve Zone: A dynamic resistance trendline that has been containing price action. A breakout above this curve signals a potential shift in trend.
📈 Trading Strategy – Bullish Breakout Plan
✅ Entry Strategy:
A long trade should be considered only after a confirmed breakout above the neckline (0.8385 - 0.8390). The confirmation comes when:
A strong bullish candle closes above the neckline.
Increased trading volume supports the breakout.
A possible retest of the neckline as new support (0.8385) before continuation.
🎯 Target Price & Stop Loss:
Take Profit (TP): 0.84308 (Projected move based on pattern size).
Stop Loss (SL): Below 0.83513 (Right Shoulder low).
Risk-to-Reward Ratio (RRR): 1:2 or higher, making this a high-probability trade setup.
🛑 Risk Management & Trade Confirmation:
Volume Confirmation: A breakout should be accompanied by a volume spike, confirming strong buyer interest.
Fakeout Warning: If price briefly breaks above the neckline but then falls back below, it could be a false breakout. In this case, waiting for a retest would be a safer approach.
Trailing Stop: Once price moves toward 0.8410, a trailing stop can help secure profits in case of market reversals.
🧐 Summary – Key Takeaways
✅ Inverse Head & Shoulders Identified – A reliable bullish reversal pattern.
✅ Breakout Zone: 0.8385 - 0.8390 (Watch for confirmation).
✅ Target Price: 0.84308 (Potential profit zone).
✅ Stop Loss: Below 0.83513 (Protect against downside risk).
✅ Risk-to-Reward Ratio: Favorable (1:2 or better).
✅ Trading Plan: Buy above the neckline, aim for 0.8430, and manage risk properly.
📌 Final Thought: If the neckline is broken with strong momentum, expect a bullish move toward 0.8430+. However, traders should remain cautious of potential fakeouts and manage risk accordingly.
📢 Share your thoughts in the comments! Are you bullish on EUR/GBP? 🚀📊
#EURGBP #ForexTrading #TechnicalAnalysis #TradingSetup #InverseHeadAndShoulders

Bitcoin (BTCUSD) Falling Wedge Breakout – Bullish Setup! 📌 Overview of the Chart Setup
This daily Bitcoin (BTC/USD) chart presents a technical breakout from a falling wedge pattern, a well-known bullish reversal signal. The price has been forming lower highs and lower lows over the past months, consolidating within a tightening structure. However, the current price action suggests an early breakout attempt, which could lead to significant upside movement in the coming weeks.
Let’s break down the key levels, technical insights, and trading opportunities visible in this chart.
📉 Chart Pattern: Falling Wedge (Bullish Reversal)
🔹 What is a Falling Wedge?
A falling wedge is a bullish continuation or reversal pattern characterized by converging downward-sloping trendlines. It typically signals a loss of bearish momentum, leading to a breakout to the upside.
🔹 Key Observations in the Chart
The price has been moving inside the falling wedge structure, with clear lower highs and lower lows.
The support level around $75,000-$80,000 has been repeatedly tested, forming a strong demand zone.
A trendline breakout has occurred, suggesting that bulls are regaining control over the price action.
Volume is expected to increase upon a confirmed breakout, reinforcing the bullish momentum.
📊 Important Technical Levels
1️⃣ Support & Resistance Zones
📌 Support Level: The $75,000-$80,000 zone has acted as a strong base, preventing further downside. Buyers have stepped in multiple times here.
📌 Resistance Level: The $95,000-$100,000 range represents a historical resistance where price has struggled to break through.
2️⃣ Trendline Breakout
The chart clearly shows a breakout above the falling wedge’s upper boundary, indicating a potential trend reversal from bearish to bullish.
If this breakout holds, Bitcoin could see strong buying pressure pushing it toward its next major resistance level.
📈 Trading Strategy & Setup
🔹 Entry Confirmation
To enter a long position, traders should wait for:
✅ A daily close above the wedge resistance (confirmed breakout).
✅ A successful retest of the breakout zone, which strengthens the bullish case.
A breakout retest is ideal because it provides a lower-risk entry point, ensuring the breakout is legitimate rather than a false move.
🔹 Target Price Projection
Using the height of the falling wedge as a projection, the potential price target is set at $118,000.
This level aligns with a 35%+ upside from the breakout zone.
Bitcoin must clear the $95,000-$100,000 resistance before reaching the final target.
🔹 Stop Loss Placement
A stop loss is positioned at $59,896, slightly below the previous major support zone.
This ensures that if the breakout fails, losses are minimized while still allowing price fluctuations within expected volatility.
🔹 Risk-to-Reward Ratio
Entry around breakout level (~$87,000)
Target: $118,000 (35% upside)
Stop Loss: $59,896 (~30% downside)
Risk-to-reward ratio: ~1:3, making this an attractive trade setup.
📢 Market Psychology & Sentiment
Why This Pattern Matters?
A falling wedge represents seller exhaustion. Over time, the bearish pressure weakens, leading to a bullish breakout.
If Bitcoin can maintain this breakout, momentum traders and institutional investors may step in, accelerating the rally.
Breaking above the resistance at $95K-$100K would confirm bullish dominance, potentially leading to new all-time highs.
Potential Risks
❌ Fake Breakout: If Bitcoin fails to hold above the wedge resistance, we may see a pullback to support before another breakout attempt.
❌ Macro Factors: External factors like regulatory news, interest rate decisions, and market-wide sentiment could impact price action.
❌ Bitcoin Dominance: If altcoins start rallying, some capital may rotate out of Bitcoin, slowing the upside move.
🚀 Final Thoughts: A High-Probability Bullish Setup
✅ The falling wedge breakout suggests a strong bullish shift, with a 35%+ potential upside.
✅ A confirmed breakout above $95K-$100K will act as a final confirmation before the next leg up.
✅ Risk is managed with a stop loss at $59,896, ensuring downside protection.
🔹 Best trading approach? Wait for confirmation, manage risk, and let the trend develop.
Would you like additional insights on entry techniques, volume confirmation, or potential invalidation points? 😊

XRPUSD breaking upward from invh&sTarget is $3. Very likely to hit the full target based on the bullish momentum from the sec ripple appeal being ofifcially dropped. Likely to continue upward from there as well but for this current idea I only wanna focus on the inv h&s target. *not financial advice*
