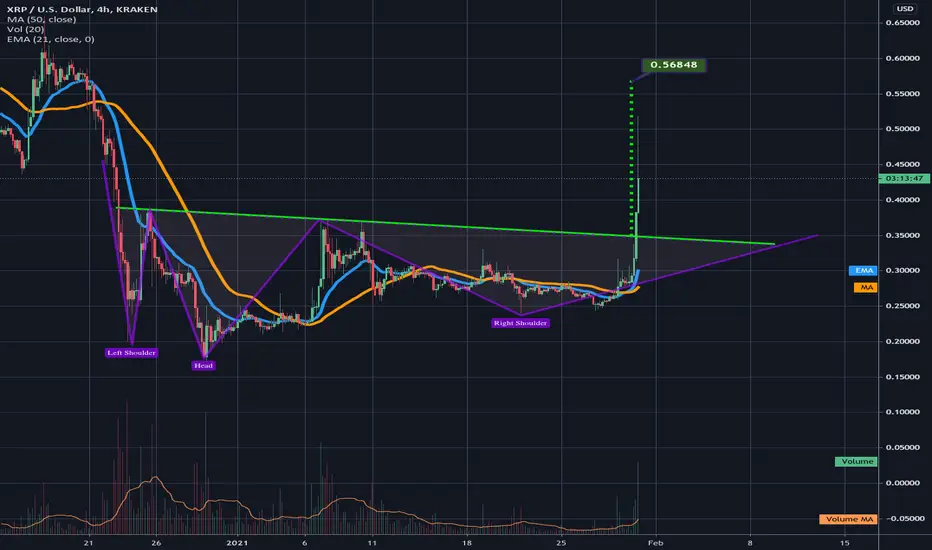
ugly inv h&s on xrpusd finally triggerin; target 57 centsthe 4hr chart ugly inverse h&s we had been watching several ideas ago waited until the very last us exchange (kraken) had suspended trading before finally confirming the breakout of this pattern...target should be around 56-57 cents. How convenient for them to wait untl the day after kraken halts trading to breakout.
Bullishbreakout
$AVA/BTC 2h (Binance Spot) Symmetrical triangle break & retestTravala has broken out of that triangle and is retesting support right now.
Current Price= 0.0000543
Buy Entry= 0.0000544 - 0.0000530
Take Profit= 0.0000589 | 0.0000632 | 0.0000689
Stop Loss= 0.0000499
Risk/Reward= 1:1.37 | 1:2.5 | 1:4
Expected Profit= +9.68% | +17.69% | +28.31%
Possible Loss= -7.08%
Fib. Retracement= 1| 1.414 | 2
Margin Leverage= 1x
Estimated Gain-time= 120h

$YFI/USDT 1h (Binance Futures) Falling wedge breaking outYearn.finance is looking bullish again, let's scalp the break-out!
Current Price= 29695.6
Buy Entry= 29702.4 - 29340.2
Take Profit= 31037.9 | 32369.3 | 34772.9
Stop Loss= 27964.7
Risk/Reward= 1:1 | 1:1.87 | 1:3.43
Expected Profit= +10.42% | +19.44% | +35.74%
Possible Loss= -10.42%
Fib. Retracement= 0.5 | 0.786 | 1.272
Margin Leverage= 2x
Estimated Gain-time= 120h

$XTZ/BTC 12h (Binance Spot) Descending channel breakout & retestTime to swing trade Tezos after that bullish breakout, entering on the pull-back.
Current Price= 0.0000937
Buy Entry= 0.0000940 - 0.0000870
Take Profit= 0.0001401 | 0.0002132 | 0.0002784
Stop Loss= 0.0000657
Risk/Reward= 1:2 | 1:4.95 | 1:7.58
Expected Profit= +54.81% | +135.58% | +207.62%
Possible Loss= -27.40%
Fib. Retracement= 0.382 | 0.618 | 0.786
Margin Leverage= 1x
Estimated Gain-time= 1440h

$NEAR/USDT 2h (Binance Futures) Descending channel breakoutNear Protocol broke out of that parallel channel and is retesting it right now.
I expect a bounce on it since it's seems to be a bullish flag to me!
Current Price= 2.5011
Buy Entry= 2.5113 - 2.4101
Take Profit= 2.7717 | 3.0259 | 3.3859
Stop Loss= 2.2527
Risk/Reward= 1:1.5 | 1:2.72 | 1:4.45
Expected Profit= +25.28% | +45.94% | +75.20%
Possible Loss= -16.90%
Fib. Retracement= 1 | 1.272 | 1.618
Margin Leverage= 2x
Estimated Gain-time= 180h

$ZEC/USDT 3h (Binance Futures) Symmetrical triangle breakoutZcash has broken out of that symmetrical triangle which looks like a bullish pennant.
Current Price= 111.00
Buy Entry= 110.21 - 107.97
Take Profit= 114.58 | 120.69 | 128.97
Stop Loss= 103.60
Risk/Reward= 1:1 | 1:2.11 | 1:3.62
Expected Profit= +10.03% | +21.26% | +36.44%
Possible Loss= -10.03%
Fib. Retracement= 0.786 | 1 | 1.272
Margin Leverage= 2x
Estimated Gain-time= 120h

$RSR/BTC 1D (Binance Spot) Descending channel near breakoutReserve Rights bullish breakout incoming from symmetrical triangle and parallel channel...
Current Price= 0.00000116
Buy Entry= 0.00000116 - 0.00000106
Take Profit= 0.00000163 | 0.00000189 | 0.00000224
Stop Loss= 0.00000085
Risk/Reward= 1:2 | 1:3 | 1:4.35
Expected Profit= +28.57% | +57.14% | +76.79%
Possible Loss= -19.64%
Fib. Retracement= 0.5 | 0.618 | 0.786
Margin Leverage= 1x
Estimated Gain-time= 1080h

$LTC/BTC 2h (Binance Spot) Falling wedge breakoutLitecoin is looking bullish again since it broke-out upwards, let's try to catch the pull-back.
Current Price= 0.004010
Buy Entry= 0.003942 - 0.003836
Take Profit= 0.004198 | 0.004573 | 0.004860
Stop Loss= 0.003580
Risk/Reward= 1:1 | 1:2.21 | 1:3.14
Expected Profit= +7.95% | +17.59% | +24.97%
Possible Loss= -7.95%
Fib. Retracement= 0.382 | 0.618 | 0.786
Margin Leverage= 1x
Estimated Gain-time= 240h

$SNX/BTC 90m (Binance Spot) Falling wedge breakoutSynthetix Network broke bullish of that falling wedge, the idea is to catch it on a possible pull-back.
Also, 100EMA seems to be acting as support now, that's why entry zone is down there!
Current Price= 0.0004010
Buy Entry= 0.0003915 - 0.0003813
Take Profit= 0.0004074 | 0.0004341 | 0.0004540
Stop Loss= 0.0003653
Risk/Reward= 1:1 | 1:2.26 | 1:3.2
Expected Profit= +5.43% | +12.34% | +17.49%
Possible Loss= -5.46%
Fib. Retracement= 0.382 | 0.618 | 0.786
Margin Leverage= 1x
Estimated Gain-time= 120h

$IOTA/USDT 1h (Binance Futures) Ascending triangle breakoutMiota broke out of that triangle and is looking ready for a leg up in my opinion.
Current Price= 0.3932
Buy Entry= 0.3933 - 0.3851
Take Profit= 0.4054 | 0.4292 | 0.4615
Stop Loss= 0.3730
Risk/Reward= 1:1 | 1:2.47 | 1:4.46
Expected Profit= +12.48% | +30.84% | +55.74%
Possible Loss= -12.48%
Fib. Retracement= 0.786 | 1 | 1.272
Margin Leverage= 3x
Estimated Gain-time= 120h

$BTC/USDT 30m (Binance Futures) Symmetrical triangle breakoutBitcoin managed to get back up and broke above the triangle after all, let's scalp!
Current Price= 34615.71
Buy Entry= 34605.52 - 34071.78
Take Profit= 35723.9 | 37920.31 | 39581.53
Stop Loss= 32942.69
Risk/Reward= 1:1 | 1:2.58 | 1:3.77
Expected Profit= +12.15% | +31.35% | +45.87%
Possible Loss= -12.15%
Fib. Retracement= 0.786 | 1.272 | 1.618
Margin Leverage= 3x
Estimated Gain-time= 120h

$MKR/USDT 30m (Binance Futures) Bullflag breakoutMaker is looking good for trend continuation after breaking that bullish flag!
Current Price= 1433.81
Buy Entry= 1455.25 - 1415.15
Take Profit= 1564.35 | 1714.13 | 1829.21
Stop Loss= 1317.27
Risk/Reward= 1:1.1 | 1:2.37 | 1:3.34
Expected Profit= +9.00% | +19.43% | +27.45%
Possible Loss= -8.22%
Fib. Retracement= 0.786 | 1.272 | 1.618
Margin Leverage= 1x
Estimated Gain-time= 120h

DOGE/BTC 1D (Binance Spot) Descending parabolic channel breakoutDogecoin is used to react well during Alt Season, let's jump in after that clear break-out.
Current Price= 0.00000018
Buy Entry= 0.00000019 - 0.00000017
Take Profit= 0.00000022 | 0.00000026 | 0.00000032
Stop Loss= 0.00000014
Risk/Reward= 1:1 | 1:2 | 1:3.5
Expected Profit= +22.22% | 44.44% | 77.78%
Possible Loss= -22.22%
Fib. Retracement= 0.236 | 0.382 | 0.618
Margin Leverage= 1x
Estimated Gain-time= 1440h

$ATOM/USDT 6h (Binance Futures) Ascending triangle breakout#Cosmos just broke out the triangle and is retesting it right now, good place for a swing!
Current Price= 5.438
Buy Entry= 5.430 - 5.302
Take Profit= 5.633 | 5.988 | 6.478
Stop Loss= 5.099
Risk/Reward= 1:1 | 1:2.33 | 1:4.16
Expected Profit= +9.96% | +23.18% | +41.44%
Possible Loss= -9.96%
Fib. Retracement= 0.618 | 0.786 | 1
Margin Leverage= 2x
Estimated Gain-time= 360h

$KNC/USDT 1h (Binance Fut.) Channel breakout & Bullflag forming#KyberNetwork is looking ready for bullish continuation here since 100EMA & 200MA are acting as support!
Current Price= 0.91284
Buy Entry= 0.91150 - 0.90150
Take Profit= 0.93530 | 0.96045 | 0.99758
Stop Loss= 0.87770
Risk/Reward= 1:1 | 1:1.87 | 1:3.16
Expected Profit= +9.54% | +17.85% | +30.15%
Possible Loss= -9.54%
Fib. Retracement= 0.5 | 0.618 | 0.786
Margin Leverage= 3x
Estimated Gain-time= 120h

$RSR/BTC 4h (Binance Spot) Descending triangle breakout#ReserveRights is looking ready for the next move up, let's grab a bag here.
Current Price= 0.00000101
Buy Entry= 0.00000102 - 0.00000098
Take Profit= 0.00000112 | 0.00000124 | 0.00000132
Stop Loss= 0.00000088
Risk/Reward= 1:1 | 1:2 | 1:2.67
Expected Profit= +12.00% | +24.00% | +32.00%
Possible Loss= -12.00%
Fib. Retracement= 0.382 | 0.618 | 0.786
Margin Leverage= 1x
Estimated Gain-time= 240h

XRP/USDT 3h (Binance Fut) Symmetrical triangle breakout & retestRipple looks bullish again, 100EMA seems to be supporting the uptrend, let's give it another try.
Current Price= 0.6177
Buy Entry= 0.6048 - 0.5568
Take Profit= 0.6978 | 0.7837 | 0.9083
Stop Loss= 0.4970
Risk/Reward= 1:1.4 | 1:2.46 | 1:3.91
Expected Profit= +20.14% | +34.93% | +856.39%
Possible Loss= -14.43%
Fib. Retracement= 0.786 | 1 | 1.272
Margin Leverage= 1x
Estimated Gain-time= 240h

$MATIC/USDT 6h (Binance Fut.) Symmetrical triangle near breakout#MaticNetwork could revisit one last time the 100EMA and triangle support then resuming the uptrend.
Current Price= 0.01921
Buy Entry= 0.01902 - 0.01842
Take Profit= 0.02052 | 0.02229 | 0.02394
Stop Loss= 0.01692
Risk/Reward= 1:1 | 1:1.98 | 1:2.9
Expected Profit= +9.62% | +19.07% | +27.88%
Possible Loss= -9.62%
Fib. Retracement= 0.786 | 1.414 | 2
Margin Leverage= 1x
Estimated Gain-time= 360h

LINK/USDT 6h (Binance Futures) Big triangle breakout & pullbackChainlink broke out the triangle two weeks ago and finally pulled back, seems to be an opportunity to swing here!
Right now sitting on 200MA, I guess up-trend could resume here and now.
Current Price= 12.332
Buy Entry= 12.342 - 11.782
Take Profit= 13.512 | 15.087 | 18.208
Stop Loss= 10.612
Risk/Reward= 1:1 | 1:2.09 | 1:4.24
Expected Profit= +12.02% | +25.08% | +50.95%
Possible Loss= -12.02%
Fib. Retracement= 0.5 | 0.786 | 1.272
Margin Leverage= 1x
Estimated Gain-time= 360h

YFI/USDT 2h (Binance Fut.) Descending channel breakout & retestYearn.Finance seems to be preparing for bullish continuation, next big move should be soon!
Parallel channel broke out and is being retesting, also 200MA is acting as support.
Current Price= 23214.3
Buy Entry= 23351.2 - 21851.2
Take Profit= 26924.9 | 34272.0 | 40698.1
Stop Loss= 18983.5
Risk/Reward= 1:1.2 | 1:3.23 | 1:5
Expected Profit= +19.13% | +51.64% | +80.07%
Possible Loss= -16.01%
Fib. Retracement= 0.786 | 1.272 | 1.618
Margin Leverage= 1x
Estimated Gain-time= 240h

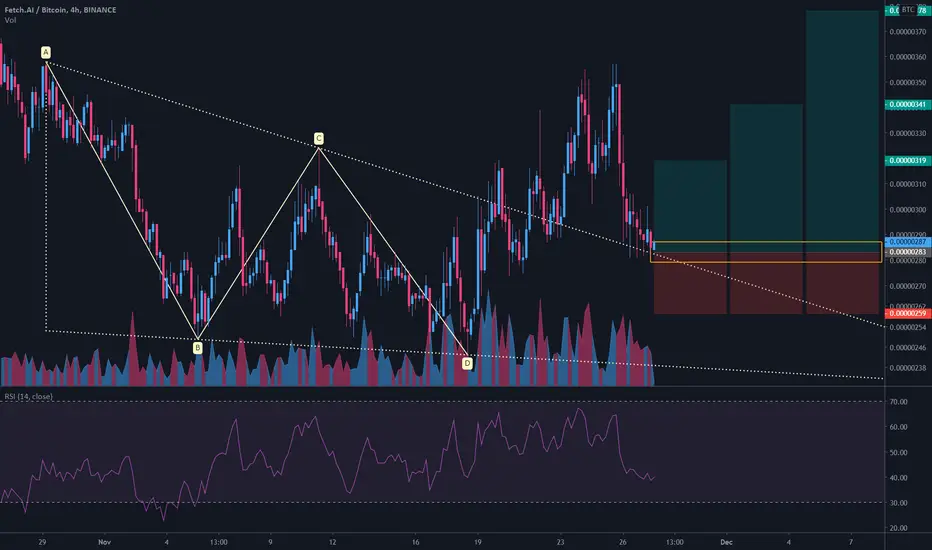
FET/BTC 4h (Binance Spot)Descending triangle breakout & pullbackFetch is looking ready for next move up, again.
Current Price= 0.00000287
Buy Entry= 0.00000287 - 0.00000279
Take Profit= 0.00000319 | 0.00000341 | 0.00000378
Stop Loss= 0.0000259
Risk/Reward= 1:1.5 | 1:2.42 | 1:3.96
Expected Profit= +12.72% | +20.49% | +33.57%
Possible Loss= -8.48%
Fib. Retracement= 0.5 | 0.786 | 1.272
Margin Leverage= 1x
Estimated Gain-time= 240h
KMD/BTC 12h (Binance Spot) Descending channel breakoutKomodo broke bullish at last, first of the falling wedge then of the parallel channel.
And it just pulled back so I believe it's time to re-enter above 50MA!
Current Price= 0.0000323
Buy Entry= 0.0000325 - 0.0000295
Take Profit= 0.0000454 | 0.0000596 | 0.0000705
Stop Loss= 0.0000215
Risk/Reward= 1:1.52 | 1:3.01 | 1:4.16
Expected Profit= +46.45% | +92.26% | +127.42%
Possible Loss= -30.65%
Fib. Retracement= 0.5 | 0.618 | 0.786
Margin Leverage= 1x
Estimated Gain-time= 840h

TRX/BTC 3h (Binance Spot) Descending channel breakoutTron broke bullish at last, the idea is to jump in on a last pull-back.
Current Price= 0.00000162
Buy Entry= 0.00000157 - 0.00000151
Take Profit= 0.00000174 | 0.00000183 | 0.00000195
Stop Loss= 0.00000138
Risk/Reward= 1:1.25 | 1:1.81 | 1:2.56
Expected Profit= +12.99% | +18.83% | +26.62%
Possible Loss= -10.39%
Fib. Retracement= 0.5 | 0.618 | 0.786
Margin Leverage= 1x
Estimated Gain-time= 240h
