XRP bullish breakout from symmetrical triangle; target= .48-.49 Looks pretty certain that weve triggered the breakout from the weekly symmetrical triangle.
Bullishbreakout

monthly double bottom breakout on ETHUSD confirmed; target=636 The most important chart pattern in ethereum has just had it's breakout confirmed. This double bottom shown here on the monthly chart has been giving us a few head fakes over the last few weeks. I originally thought it was more predominantly a weekly pattern we had a fakeout back below theneckline a couple weeks back which made me realize it was better suited on the monthly chart. The breakout target is $636 however my first initial target on the smaller time frame of the 1day chart has been $525 for awhile which we are very close to reaching...there may be some consolidation that occurs between $525 and $636 but we will reach that target sooner rather than later I'm quite certain. Thanks for reading! *not financial advice**

ADA/USDT 2h (Binance Futures) Descending triangle near breakoutCardano is getting ready for the next big move, I expect it will be upwards as long as 200MA is holding the trend!
The chart is showing Spot pair, but we will trade it with low leverage in Futures market.
Current Price= 0.10302
Buy Entry= 0.10310 - 0.10106
Take Profit= 0.10756 | 0.11299 | 0.11842
Stop Loss= 0.09664
Risk/Reward= 1:1 | 1:2 | 1:3
Expected Profit= +10.66% | +21.28% | +31.92%
Possible Loss= -10.66%
Fib. Retracement= 0.618 | 1 | 1.272
Margin Leverage= 2x
Estimated Gain-time= 240h

EGLD/USDT 8h (Binance Futures) Descending channel breakoutElrond eGold is surely looking juicy here, preparing for a big move up I believe after that pullback.
As long as 50MA is holding and supporting the price we are good to go up!
Current Price= 8.158
Buy Entry= 8.191 - 7.729
Take Profit= 8.953 | 9.906 | 10.96
Stop Loss= 6.967
Risk/Reward= 1:1 | 1:1.96 | 1:3.02
Expected Profit= +12.47% | +24.45% | +37.69%
Possible Loss= -12.47%
Fib. Retracement= 0.382 | 0.5 | 0.681
Margin Leverage= 1x
Estimated Gain-time= 480h

AAVE/USDT 45m (Binance Fut) Descending channel breakout & retestAave could be forming a bull-flag here (continuation), I expect a last pullback down to 200MA before the next big move up.
Current Price= 56.971
Buy Entry= 54.837 - 51.837
Take Profit= 58.907 | 63.242 | 66.528
Stop Loss= 47.767
Risk/Reward= 1:1 | 1:1.78 | 1:2.37
Expected Profit= +10.44% | +18.57% | +24.73%
Possible Loss= -10.44%
Fib. Retracement= 0.382 | 0.618 | 0.786
Margin Leverage= 1x
Estimated Gain-time= 72h

BAT/BTC 15m (Binance Spot) Bullish flag breakout & retestBasic Attention Token has just broken bullish and is pulling back to give us entry, time to get onboard for a scalp!
Current Price= 0.00001323
Buy Entry= 0.00001329 - 0.00001319
Take Profit= 0.00001353 | 0.00001382 | 0.00001415
Stop Loss= 0.00001295
Risk/Reward= 1:1 | 1:2 | 1:3.14
Expected Profit= +2.19% | +4.38% | +6.87%
Possible Loss= -2.19%
Fib. Retracement=1.272 | 1.618 | 2
Margin Leverage= 1x
Estimated Gain-time= 48h

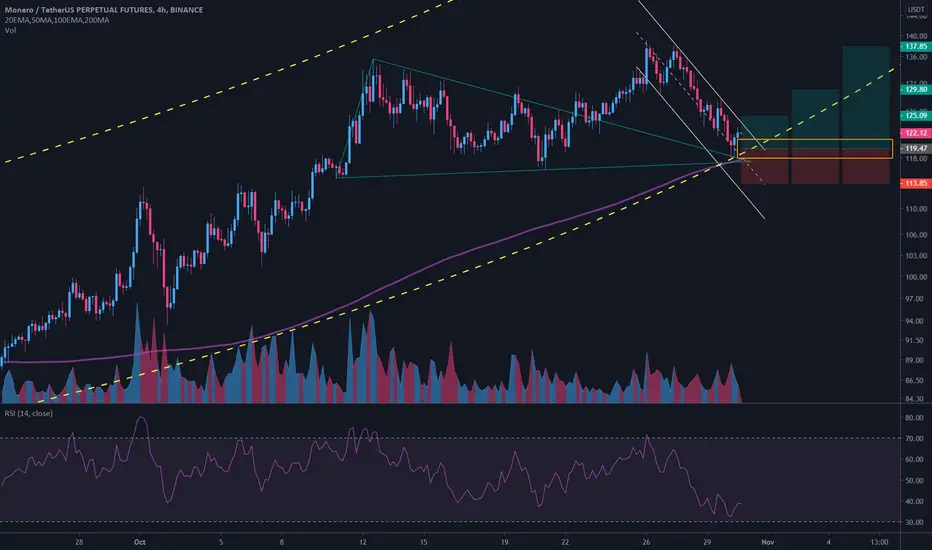
XMR/USDT 4h (Binance Futures) Descending channel near breakout#Monero could take advantage of the current bullish momentum to make a new leg up.
Since 200MA and parabolic curve seem to act as support, it would be the best place to enter in my opinion.
Current Price= 122.11
Buy Entry= 121.07 - 117.87
Take Profit= 125.09 | 129.80 | 137.85
Stop Loss= 113.85
Risk/Reward= 1:1 | 1:1.84 | 1:3.27
Expected Profit= +9.40% | +17.30% | +30.76%
Possible Loss= -9.40%
Fib. Retracement= 0.236 | 0.382 | 0.618
Margin Leverage= 2x
Estimated Gain-time= 240h
COMP/USDT 8h (Binance Fut.) Descending channel breakout & retest#Compound is pulling back to give us entry after that clear breakout of parallel channel.
I believe this is a new opportunity to long it before a possible bull run!
Current Price= 107.06
Buy Entry= 107.03 - 102.23
Take Profit= 116.77 | 123.26 | 133.20
Stop Loss= 96.51
Risk/Reward= 1:1.5 | 1:2.29 | 1:3.52
Expected Profit= +23.20% | +35.62% | +54.62%
Possible Loss= -15.52%
Fib. Retracement= 0.5 | 0.618 | 0.786
Margin Leverage= 2x
Estimated Gain-time= 480h

BULLISH BREAK OUT IN CEAT TYRESCROSSED PRE-COVID LEVELS LAST WEEK.
WEEKLY RSI crossed level of 60 after 2 yrs.
PLEASE SEE CHART FOR FURTHER DETAILS
TARGET 1: 1200
TARGET 2: 1300
STOP LOSS : 1080
**These are my personal observations. Please trade at your own risk.**


XRP BreakoutMy first prediction failed, but the bigger ascending triangle seems to work.
Although there was a bearish breakout, the price came back in the triangle and broke the support zone. Bullish!!!
Maybe the bullish Bitcoin movement helped a bit ;)
My next target is 0.29500 USD. The 0.30000 USD could be a hughe psychological resistance.
Caution when the support area breaks! My Stop is slightly underneath the triangle.
A confirmation of the old resistance/new support zone would be very good.

ZIL/USDT 1h (Binance Fut.) Parallel channel breakout & pullback#Zilliqa just broke-out bullish and volume increased a lot, time to look up now!
Current Price= 0.01889
Buy Entry= 0.01874 - 0.01850
Take Profit= 0.01916 | 0.01962 | 0.02024
Stop Loss= 0.01808
Risk/Reward= 1:1 | 1:1.85 | 1:3
Expected Profit= +11.60% | +21.48% | +34.80%
Possible Loss= -11.60%
Fib. Retracement= 0.5 | 0.618 | 0.786
Margin Leverage= 4x
Estimated Gain-time= 120h

RVN/BTC 1D (Binance Spot) Falling wedge breakout & on support#Ravencoin has been retracing for a long time now, a move up seems to be coming!
Since it broke out already and it's on big descending channel support, that looks like a good buy zone.
Current Price= 0.00000115
Buy Entry= 0.00000116 - 0.00000110
Take Profit= 0.00000128 | 0.00000144 | 0.00000162
Stop Loss= 0.00000098
Risk/Reward= 1:1 | 1:2.07 | 1:3.27
Expected Profit= +13.27% | +27.43% | +43.36%
Possible Loss= -13.27%
Fib. Retracement= 0.236| 0.5 | 0.786
Margin Leverage= 1x | 3x | 5x
Estimated Gain-time= 2400h

WAVES/USDT 2h (Binance Fu) Triangle breakout & Ascending channel#Waves is looking bullish again after that pullback to broken trendline, let's give it a new try!
Current Price= 2.4674
Sell Entry= 2.4700 - 2.4146
Take Profit= 2.5632 | 2.6910 | 2.8840
Stop Loss= 2.3214
Risk/Reward= 1:1 | 1:2.06 | 1:3.65
Expected Profit= +9.90% | +20.36% | +36.18%
Possible Loss= -9.90%
Fib. Retracement= 0.5 | 0.618 | 0.786
Margin Leverage= 2x
Estimated Gain-time= 240h

$PFSI daIly chart bullish breakout$PFSI has just broken from a rounding formation
Neckline stands at 56 so it has to hold above that
MACD cross up on above 20MA VolAvg day
Potential target around 64
Good luck,
TA

A look at the Monthly Chart Symmetrical Triangle Pattern!We may come back down and retest the top trendline of the symmetrical triangle before takeoff but to me this looks like probability will favor and validate this pattern breakout. Being a monthly chart it may take several months to reach the breakout target but based on this simple macro pattern we are likely in for a very bullish 2021. Of course we are only just now on our confirmation candle for this pattern we must keep in mind that so far we only have 1 candle closed above it on the monthly..closing the current followup monthly candle above the pattern as well would be a very bullish sign in my opinion *not financial advice* if it were to hit its full target we should see price action reaching above 28k I'm guessing no later than Q2 of next year and a new ATH significantly sooner. *not financial advice*

GBPUSD Weekly Breakout and TargetWeekly candle has broken out of an old pitchfork channel I had on GBPUSD.. Acknowledging the likelyhood of a retest of support/resistance, I'd say it's a great set up for me.
Low volume nodes make excellent targets.
~180 pips for grabs here, if we tap the target low volume node area.

Monthly Candle Closes Above the TOTAL2 Chart's Dbl Bttm NecklineThe monthly double bottom pattern on the TOTAL2(Alt Market) has finally gotten it's first monthly close above the neckline. There are 2 possible necklines here a descending one(notated by a dotted yellow line) and a horizontal one (orange yellow). Both price targets for a breakout from each neckline are listed. Not quite sure which one is more legit but we are now on our follow up confirmation candle on the monthly chart. Probability of a confirmed breakout has greatly increased here but we should be prepared for a retest of the neckline and also a smaller possibility of a fakeout just in case.

VET/USDT 3h (Binance Futures) Descending channel breakoutVeChain is looking bullish again and I'm expecting it to keep going up.
We enter the trade just in time, now it already left Buy zone so you could wait for it to add more or enter now if you missed out.
Current Price= 0.017973
Buy Entry= 0.017800 - 0.017290
Take Profit= 0.018745 | 0.019688 | 0.021085
Stop Loss= 0.016345
Risk/Reward= 1:1 | 1:1.79 | 1:2.95
Expected Profit= +27.36% | +48.84% | +80.72%
Possible Loss= -27.36%
Fib. Retracement= 0.5 | 0.618 | 0.786
Margin Leverage= 4x
Estimated Gain-time= 240h

$NIU classic #pennant #breakout #chart$NIU is breaking out of a beautiful classic pennant on daily chart
Yesterday the 5EMA crossed up the 10EMA
Price trades above all major MAs, RSI at 61 with plenty of room, MACD ready to cross into positive area
Also notice the volume in the past sessions above the 20MA AvgVol
They tried to push it back today after the open, retested the 20EMA and we are looking at a potential beautiful “red to green” move
Target 26-30$
Good luck,
TA

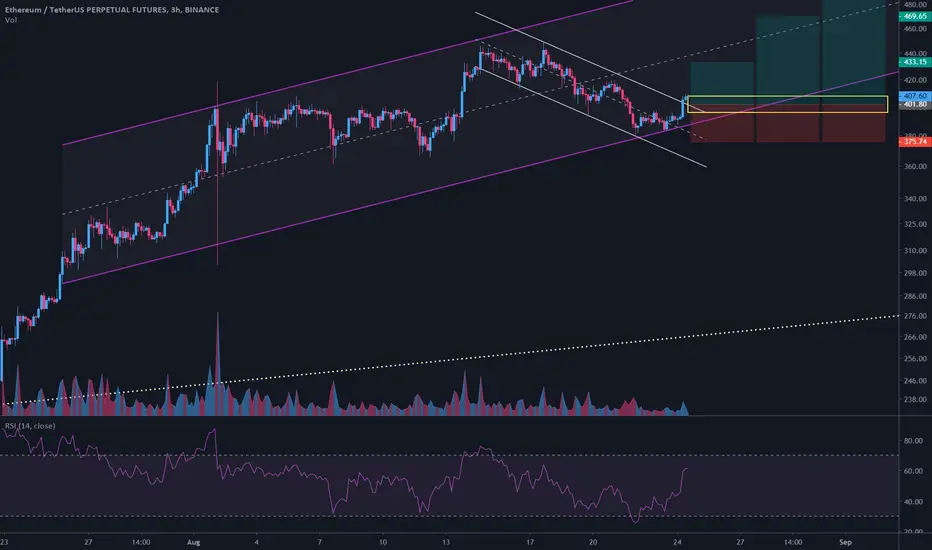
ETH/USDT 3h (Binance Fut.) Descending channel breakoutIf you keep missing out with Ethereum, you'd better do something about it!
This is another clear break-out to me and it could go for a new local high.
Current Price= 407.59
Buy Entry= 407.60 - 396.00
Take Profit= 433.15 | 469.65 | 497.47
Stop Loss= 375.74
Risk/Reward= 1:1.2 | 1:2.6 | 1:3.67
Expected Profit= +25.96% | +67.56% | +95.24%
Possible Loss= -25.96%
Fib. Retracement= 0.786 | 1.272 | 1.618
Margin Leverage= 4x
Estimated Gain-time= 240h
Weekly Chart Looks Extremely Bullish!Two simple patterns are all that's needed to be focused on right now on the weekly chart as we can see the weekly bull flag in yellow has clearly confirmed its breakout and we should see it reach it's breakout target of 14.4k! Also, by the bull flag reaching its target this should also fully validate and confirm this weekly inverse head and shoulders pattern I've been watching develop since last year and predicted would develop many many ideas ago. A fakeout still has a microcosmic chance of happening of course so we should always be prepared for the unexpected but now the odds tremendously favor the inverse h&s will be confirmed. So buckle up! It seems price action is about to go stratospheric!

