#ZECUSDT #1D (Binance Futures) Descending channel breakoutZcash broke-out printing a morning star, looks good for recovery towards 100EMA resistance.
⚡️⚡️ #ZEC/USDT ⚡️⚡️
Exchanges: Binance Futures
Signal Type: Regular (Long)
Leverage: Isolated (2.0X)
Amount: 5.9%
Current Price:
36.12
Entry Zone:
36.05 - 33.55
Take-Profit Targets:
1) 41.83
1) 47.12
1) 52.42
Stop Targets:
1) 28.92
Published By: @Zblaba
SEED_DONKEYDAN_MARKET_CAP:ZEC BINANCE:ZECUSDT.P #1D #Zcash #Privacy z.cash
Risk/Reward= 1:1.2 | 1:2.1 | 1:3.0
Expected Profit= +40.4% | +70.8% | +101.3%
Possible Loss= -33.8%
Estimated Gaintime= 1-2 months
Bullishbreakout

ENA Breaks Downtrend – Is a Rally Incoming?$ENA/USDT 12H chart shows a breakout above the resistance trendline and the 50 EMA, indicating a potential trend reversal. However, the price is currently facing resistance near the previous support-turned-resistance zone.
A retest of the trendline breakout is possible before further upside. If the price holds above the trendline and reclaims support, it could confirm a bullish continuation.
However, failure to hold may result in a fakeout and further downside.
DYOR, NFA

ADA breaking up from bullflag/handle targets= 1.88 & 2.40Unless this is some sort of strange bull trap. The recent declaration o Trump’s Truth Social page that he will be including ADA in the Strategic reserve has resulting in a major pump for cardano here which will likely confirm the breakout of both this bull flag its currently above and the cup and handle it’s about to be above (yellow line) *not financial advice*

PEPE/USD Bullish Breakout: Demand Zone Holds, Reversal in Sight?PEPE/USD has been gaining attention as it trades near a critical juncture. With the daily demand zone holding strong and signs of a downside channel reversal, the pair could be on the brink of a bullish breakout. In this analysis, we’ll break down the technical indicators and patterns that suggest PEPE/USD might be ready to reverse its downtrend.
Daily Demand Zone Holding Firm
One of the most significant factors supporting a potential bullish move is the respected daily demand zone. This area has provided strong support, acting as a floor for buyers to step in. A failure to break below this zone increases the probability of an upward momentum shift.
Key Support Levels: Highlight exact price levels in the demand zone.
Volume Analysis: Look for increased buying volume around these levels, which could signal accumulation by bullish traders.
What to Watch For Before Confirmation
While the technical signs are promising, traders should remain cautious. Key events to watch include:
Breakout Above Resistance: Identify the breakout level for confirmation
Retest of the Channel Top: Look for a retest and bounce as confirmation of strength.
Market Sentiment and Volume: Monitor trading volume and broader market sentiment.
Conclusion: A Bullish Opportunity?
The combination of a respected daily demand zone and a downside channel reversal pattern makes PEPE/USD a pair to watch. A confirmed breakout could set the stage for a bullish run, providing traders with an exciting opportunity. As always, use risk management and stay updated with the latest price action.

TOSHI/USD Bearish Phase is Over! Is a Bullish Breakout Coming?After a prolonged bearish correction, TOSHI/USD is flashing signals of a potential breakout. If you're still stuck in a bearish mindset, you might be missing the next big move!
🔥 Key Bullish Signals:
✅ Higher Lows Forming – Buyers stepping in at stronger levels.
✅ Volume Surge
💡 Trading Idea:
🎯 Long Entry: Look for confirmation above with strong volume.
📢 Final Takeaway: If TOSHI/USD holds key support and breaks resistance, we could see a strong rally. Stay alert and trade smart!
💬 What’s your outlook on TOSHI? Drop your thoughts below! 👇
#TOSHIUSD #CryptoTrading #BullishBreakout #TradingIdeas #TrendReversal #Altcoins #CryptoMarket

Gold’s Bullish Surge Eyeing the $2,700 Breakout! The chart displays a bullish recovery following a significant downtrend, transitioning into an uptrend within a defined ascending channel. A symmetrical triangle breakout during the bearish phase marked the beginning of this upward movement. Key support is identified around $2,600, while resistance levels are at $2,697, aligned with the 100% Fibonacci projection, and $2,728, which corresponds to the 138.2% Fibonacci extension and acts as a potential exhaustion point. The psychological level of $2,700 plays a critical role as a resistance zone. The price is currently near the upper boundary of the ascending channel, suggesting possible resistance and a chance for consolidation or retracement. If the price breaks above $2,700, it could target $2,728 or higher, while a rejection might lead to a pullback toward the midline or lower boundary of the channel. The bullish momentum remains intact, and traders could consider entering on a breakout above $2,700 or on a retracement near the channel’s lower boundary. Targets lie at $2,728 or higher, with stops placed below the last swing low or channel support. This chart signals a strong bullish trend with critical action expected around the $2,700 level.

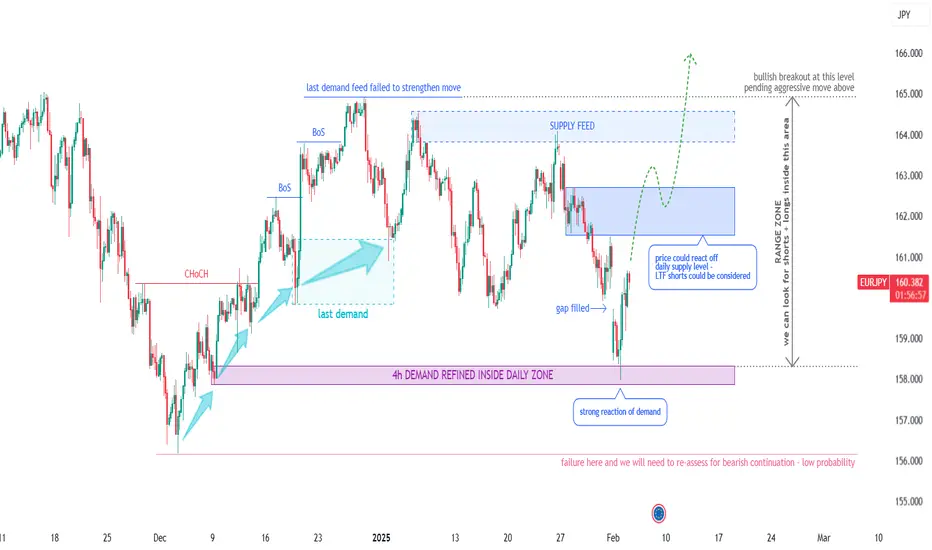
EURJPY Potential Longs - Short & Long Term (Technical Analysis)Technical Outlook:
Looking at previous price movement, we see it's been trending up since August 2024, with the last reaccumulation phase ending in early 2024. We recently saw a demand chain, but the last push couldn't quite hit new highs. Supply then took over, driving the price back down to a daily demand level. At this point, we've seen some strong bullish reactions on the lower timeframes, which is interesting and here's why -
Potential Scenarios & Probabilities:
Scenario 1 (High Probability) – Demand should regain control, leading to a bullish breakout.
Scenario 2 (Medium Probability) - Price could range within the ascending channel for a while.
Scenario 3 (Low Probability) – The bulls might disengage, resulting in a bearish break and continuation thereafter.
Trading Considerations:
Price is currently in a discounted zone within the ascending channel (158.000 – 168.000) . We can look for trading opportunities within this range, focusing on strong supply and demand areas, anticipating the eventual bullish breakout. A long position closer to the bottom of the range could turn into a swing trade. If you're trading inside the range on lower time frames, it's smart to keep an eye on volume, overbought/oversold levels, and relative currency strength.
Final Notes:
With the price moving sideways for a good six months, range trading is definitely a possibility. But the real goal is to catch that bullish breakout when it happens, and it looks like it's getting close. As always, manage your risk carefully, and don't hesitate to take the trade when the setup is right – assuming you've got a solid plan and a clear target in mind.
OANDA:EURJPY
BTC/USD Bullish Setup | Order Flow Breakout Targeting $118,000+📈 Bitcoin (BTC/USD) is showing strong bullish momentum after breaking key resistance levels. After a period of accumulation and sideways movement, BTC has shown clear signs of fresh buying pressure, supported by a clean Order Flow setup . We are targeting a move towards $118,000 as we see continuation in the current bullish trend.
Key Levels:
ATH Resistance at $109,350$ (All-Time High).
Order Flow Confirmation near $105,000 - $106,000.
Entry Zone: The green demand zones are marked as strong areas to enter long positions.
Price Target: We are aiming for a continuation towards $118,000 , which aligns with both the market structure and order flow.
🔍 Analysis:
Multiple Order Flow setups have formed around the $105,000-$106,000 region, confirming that buyers are in control.
The price is breaking above key resistance zones, and the current consolidation suggests a strong potential for price continuation.
Support Areas: The green zones on the chart represent potential areas where price could dip to before continuing upward.
Entry Strategy: Look for price action confirmation in these demand zones, with a focus on bullish candlestick formations and strong volume.
💬 Drop your thoughts and analysis in the comments below! Let's discuss where Bitcoin is headed next!
🔔 Follow for more insights on Bitcoin & Altcoin setups."

Updated XRPUSD chart to more precisely show the breakout pointI decided to post an updated version of my current xrpusd daily chart to more accurately display the measured move line at the spot of the exact breakout so we can see it work its magnetism on price action and so far you can see here we had a perfect wick support bounce up from the dotted measured over line like clockwork. Let’s see if it climbs up the lne like it often does with other pattern breakouts. Target for this specific breakout is $4.86. II will post a link to the previous version of this chart below. I tired that one something along the lines of the 50ma is about to push price action out of the nest and force it to fly and as you can see that’s more or less exactly what it did. *not financial advice*

LTC Breaking above tan invh&s neckline, right on goldencrossI have the weekly chart timeframe selected here simply because I needed to expand the timeframe on the chart to be able to fit both inverse head and shoulders patterns and their respective breakout targets in the frame. Wanted to put the timeframe on the daily chart so. Could show once again how these recent crypto pumps have all being launching on the exact day that the Daly golden cross occurs. I will post. Daily chart version of this as well that zooms in on the golden cross and subsequent priceaction and link it below. Anyways it looks like on this 2nd breach above the tan neckline that Litecoin is likely to finally trigger a breakout ths go around. If so the highest measured move target is in the $170s here, and reaching it will obviously also allow us to hit the white inverse head and shoulders breakout target too on the way there. In order to ensure that price acton doesn’t dip back below the tan neckline for a second time, it will need to flip the weekly 200ma(blue line) to solidified support once that happens I think it will definitely confirm the breakout at that point. Alt season has officially began! *not financial advice*

XRPETH chart heading to it’s next breakout targetI do think eth will be making decent gains here in the near future, but t looks like xrp will outpace those gains with its own gains based on the current chart pattern on the XRPETH chart. *not financial advice*

XDC breaking up from 3 different bull patterns at the same timeI had to use the weekly time frame instead of the daily to fit all 3 patterns in the frame here. As you can see we have a double bottom(green neckline), an inverse head and shoulders (tan neckline), and a pink bullflag that price action is currently breaking above each of. Their full measured move targets are all relatively close to eachother too which creates some bullish confluence. *not financial advice*

XRP’s 1day 50ma about to push XRP price out of the nestWe can see the orange 1day 50ma has now rise up to the bullflag xrp has been consolidating in since its big pump and is ready to shove xrp’s priceaction u out of the nest so it can learn to fly to the next target. I’m gonna go out on a limb here(no pun intended) and make an educated guess that XRP will achieve a new all time high before February. That’s not financial advice obviously but that’s how confident I am in the current market conditions I’m seeing. Let’s see if my guesstimate comes true.

ONDO/USDT Falling Wedge in Play Is it Set to Soar?Pattern
The chart is forming a Falling Wedge pattern, which is typically a bullish reversal structure.
Key Levels to Watch
Support Zone
Lower trendline support around $1.05.
Strong horizontal support near $1.00, making this a potential entry point for long positions.
Resistance and Target
If a breakout occurs, the expected upside target is $1.60+, with further momentum possibly driving the price even higher.
Insights
The falling wedge narrows as price action consolidates, indicating reduced bearish strength.
A breakout above the upper trendline would confirm a bullish move.
Trading Strategy
Look for confirmation of breakout or bounce from $1.05 or $1.00 before entering.
Set stops below $1.00 to manage risk.
Potential profit taking levels could be around $1.60 or higher depending on market momentum.
This chart signals a promising bullish setup. Monitor closely for breakout confirmation to capitalize on the potential upward move.

Bullish Cases for ENA/USDT#Bull_Insights #014
Coin Ticker : #ENA
Market : Binance
Time Frame : 1 Week.
This report analyzes the bullish indicators for ENA/USDT as depicted in the provided chart, highlighting potential upward trends and investment opportunities based on technical analysis.
Key Observations:
Volume Surge : There's a noticeable increase in trading volume at the end of 2024, which often precedes significant price movements. High volume can indicate strong buying interest, suggesting a potential bullish trend.
Price Consolidation : The price has been consolidating within a tight range, marked by the red dashed lines (approximately $1.2 - $1.4 USDT). Consolidation after a downtrend and rebound can lead to a breakout, often upwards if accompanied by increasing volume.
Support and Resistance: The consolidation area acts as a strong support level. If ENA breaks above the resistance with significant volume, it could signal the start of a new uptrend.
Moving Average Cross: Although not explicitly shown, the price action near what appears to be a moving average specifically on the daily time frame confirms a golden cross (short-term MA crossing above long-term MA), a bullish signal.
Relative Strength Index (RSI) : The RSI, if considered, rebound from the oversold area and currently showing bullish sentiment with a divergence in the formation (not visible in the chart). An RSI moving upwards from an oversold condition or showing bullish divergence could confirm buying momentum.
Pattern Formation : The price action seems to be forming a potential double bottom or and in some particular cases inverse head and shoulders pattern, both of which are bullish reversal patterns. Confirmation of these patterns with a breakout above the neckline or the red rectangle resistance area would be a strong bullish signal.
Fibonacci Retracement: The price is currently near the 1.68 Fibonacci extension level. A bounce from these levels could indicate the resumption of the forming uptrend.
🔼Bullish Cases:
Breakout Scenario: A breakout above the current resistance with high volume could lead to a target price calculated by the height of the consolidation range, potentially pushing ENA towards $1.6 - $1.8 USDT in the short term and will pave a way for the long term ATH move for the coin.
Pattern Confirmation : If the patterns mentioned (double bottom or inverse head and shoulders) are confirmed, this could lead to significant price appreciation, targeting levels beyond the previous highs.
Volume Confirmation: Continued increase in volume alongside price movement will validate the bullish case, suggesting strong market interest and potential for sustained growth.
Fundamental View on the future of MIL:ENA :
▶️ Sector: DeFi
▶️ MC: $3.73B
▶️ FDV: $18.58B
▶️ Unlocked supply: 20.22%
- Ethena is a synthetic dollar protocol built on Ethereum.
- It offers a crypto-native solution for money that doesn't rely on traditional banking infrastructure.
- Additionally, it provides a globally accessible, dollar-denominated savings instrument — the "Internet Bond."
Conclusion:
The current technical setup for ENA/USDT shows several bullish indicators. However, investors should watch for confirmation through volume and price action before making investment decisions. Always consider broader market conditions and news related to ENA that could affect its price independently of technical indicators.
Recommendation:
Monitor ENA/USDT closely for breakout signals above the current resistance. If confirmed with volume, consider entering long positions with stops below the consolidation area for risk management.

AMP Ready for Round 2, Get Your TicketsAmp is looking good, just broke out with some nice volume and ready for the next leg up. The AMP Train is leaving the station.
Short term target: 0.018 to 0.020 range
Med term target: 0.027 to 0.033 range
Long term target: Moon
Lets Go!!!

Floki has an impressive chessboard at the momentMultiple overlapping bull patterns that will trigger eachother like a domino effect, It tart with the bull flag which we are already seeing begin to break out here. Fro here to the highest chart target is 111%. On the previous chart I posted on Floki, it had not yet been added to coinbase but we were speculating it would be and now it has. *not financial advice*

More proof Goldencross works immediately in this phase of bullJust like the char I posted before this one, I’m posting this simply to lllustrate how the golden cross (orange line crossing above the blue line) immediately resulted in a very pivotal bullish pump that coincided with a major fulcrum point on the chart recently on multiple different charts. More times than not in the other market cycles, when a golden cross occurs it usually takes a few weeks afterwards to know whether that cross will have its desired outcome or instead end up being a fakeout but lately I’ve noticed multiple charts have seen an instantaneous pump on the exact day of the golden cross, which is making me think that once we enter the 2nd parabolic phase of a bull market that that is when you can anticipate a golden cross to have its immediate intended effect its suppose to have with much much higher probability than all the other market phases including even the 1st half of the bull market. Anyways I wanted to illustrate that hypothesis here with the XLM chart as you can clearly see it’s a text book example, and I will try to put a link below to the previous example where this occurred as wel a link to the total2 chart which will have its golden cross in the next 102 daily candles.l One major reason I want to illustrate this is because within the next 1-2 daily candle closes the Total2 (aka altcoin market) chart is going to have its golden cross and it is currently trying to confirm the breakout upward from a cp and handle pattern which is a huge fulcrum point for it. So should the trend of instantaneous golden cross pump effects occurring the same daily candle as the cross itself, this could clue us into exactly when the real full on alt season will be about to kick off (which if correct, will be ignited by a big confirmation breakout pump within the next 1-3 daily candles). *not financial advice*

XDC beginning to head to its bullish breakout targetsPosting an update this chart so I can show a zoomed in look at the daily price action with the measured move lines readjusted to the exact breakout points of the two chart patterns to provide ore accurate breakout targets. I will link the original chart idea i posted of these 2 patterns below. *not financial advice*

NEAR breaking up from invh&s and soon from symmetrical triangleIn order to reach the full inverse head and shoulder breakout target, NEAR will have to send price action well above the top trendline of this turquoise symmetrical triangle, in the process likely validating the breakout of that pattern too. *not financial advice*

Dash breaking up from double bottom on same day as goldencrossI’m starting to think my hypothesis has been proven at this point as yet another alt coin has its massive breakout pump on the exact same day pill candle it has its golden cross on. Dash now joins the countless other alt coins who have also broken up from the chart patterns with a big pum the day fo their golden cross. *not financial advice*

Bullflag on bitcoin’s monthly log chart putting up big numbers 200k by May?! The measured move target is over 200k and the trajectory of the ensured move line suggests that it could even potentially reach this target in the first half of 2025. A very exciting notion let’s hope it can and will. I do expect one steep corrections on the way to this target. *not financial advice*

Digibyte looks like it’s validating the invh&s breakoutDigibyte shown here on the daily chart showing a nice bullish impulse firmly above the neckline of its inverse head and shoulders pattern. Already well on the way to the breakout target here so very likely validating the breakout. Also doing so a day or so before it has its golden cross. Once it reaches the full breakout target it’s likely to test the next potential resistance of the yellow horizontal trendline. That trendline is actually the neckline of a larger double bottom pattern. Wouldn’t be surprised with the golden cross so close by that whatever resistance that double bottom neckline provides doesn’t last very long *not financiala dvice*
