EURUSD-Weekly Market Analysis-Aug22,Wk2A Bullish Butterfly form at 1.0045 could be an opportunity for counter-trend traders to wait for a counter-trend trading opportunity that completes at that price. However confident you are in the trading setup, it is important to wait for candlestick confirmation before engaging in the trade.
Bullish Butterfly

CRUDEO - 1H - Bullish ButterflyCRUDEO is in a bearish trend . The price action is currently testing the Support Zone after forming a Bullish Butterfly pattern in addition to a Bullish Candle Pattern near point D . Expecting bulls to push prices higher.

CAD/CHF: Bullish butterfly harmonic patternI found out that Canadian Dollar/Swiss Franc forming a bullish butterfly harmonic pattern with the correct measure using Fibonacci for harmonic. But I see that CAD/CHF as forming this bullish perspective. I believe that CAD/CHF will continue drop, yes drop but doesn't drop as I expect because we see a wick of manipulation zone that institutional are interesting to buy this forex par.
I show clearly the rejection point, and also in H1 you can to see better as in H4 timeframe, because the drop was stopped and doesn't make a drop in the price, just a wick of rejection in that zone.
Also, there's a good opportunity to buy now CAD/CHF. I entry in the 2nd trade and entry to $0.7481 CHF, Stop Loss to $0.7452 CHF (27 pips) and take profit of $0.7530 CHF (51 pips). In my first trade I entry around $0.7486 CHF, For update, I put the same Stop Loss #0.7452 CHF (32 pips) and take profit of $0.7530 CHF (46 pips) This it's a risk/benefi 1:1, but have a lot potential to reach our target.
Good luck!!!

TOTAL2 butterfly and bat patternthere are three bullish pattern are created.
the first point is 312B
the second is 288B and third is227B
the most possible is the first point.

Bullish Butterfly D1Open - 1.01854
TP1 - 1.03621
TP2 - 1.06216
TP3 - 1.07654
SL - 1.00712
Please note that my setups are not signals to trade but my own personal analysis and predicted direction. To enter a trade it must be validated by multiple different indicators and confluence factors.

We Have a Double Bottom at the PCZ of a Bullish Butterfly on BATPretty much everything you need to know is in the title but if i were to elaborate on some details i'd add the fact that there is Bullish Divergence on both the Daily MACD and RSI.

AUDUSD - Bullish Butterfly Pattern A potential Bullish Butterfly Pattern might just catch the falling knife. I'll be waiting for the candlestick touch the furthest line of the rectangle at Point D and show me a confirmation sign to engage the trade.
Retest on Point D will not be the requirement for this trade.

AUDUSD - Bullish Butterfly A Bullish Butterfly setup on the intra day timeframe which is great for intra day trader and CounterTrend trader to consider to engage on this Butterfly Pattern.

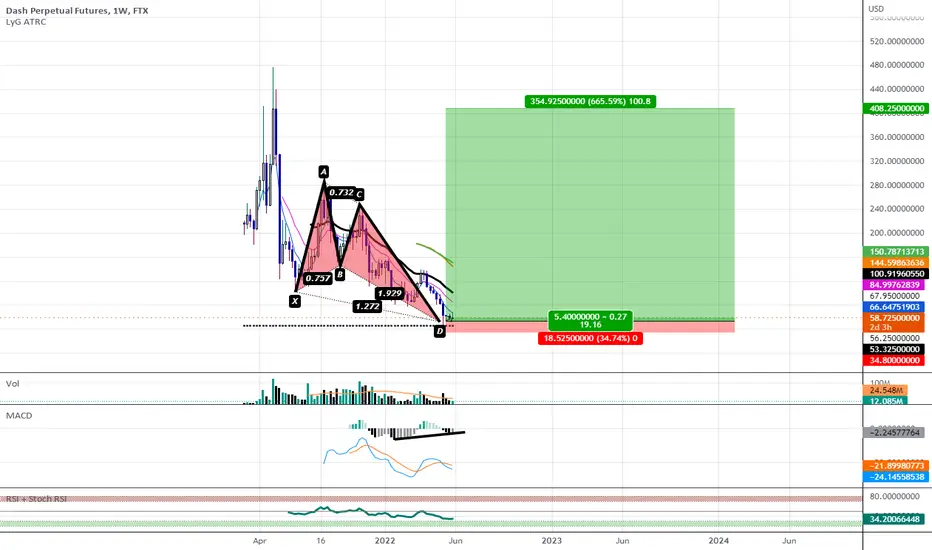
Bullish Butterfly with Bullish Divergence on WeeklyWe Have Weekly MACD Bullish Divergence Visible at the PCZ of a Bullish Butterfly on DASH
DOGE/USD Inverted Head and Shoulders at PCZ of Bullish ButterflyWe are at a PCZ of a Bullish Butterfly printing a Potential Right Shoulder of an Inverted Head and Shoulders Pattern Visible on the Weekly with a bit of Bullish Divergence to top it off.
My Stop loss will be below 10 cents and my TP will be above 30 cents.

CADJPY - Bullish ButterflyCADJPY is on a Bullish Trend, trend traders could wait for a Bullish Butterfly Pattern that form on the 4-hourly chart for a buying opportunity. Should that happen, I will need to see a 3-bar reversal at 96.90.

GUJGASLTDGujgas made bullish butterfly pattern on an hourly charts with very good above average volumes & with increase in OI.
Could be bought with mentioned stoploss & targets.

SBINSbin made bullish butterfly pattern on an hourly chart with decent volumes & mammoth OI in 500 CE & trading above 500 hints at massive short covering.
Could be bought with mentioned stoploss & targets.
SBI 500 CE cmp 20 stoploss 17.20 target 25.

godrejcpGodrejcp made bullish butterfly pattern on daily charts with good volumes.
Buy at cmp or on dip till 765 with mentioned stoploss & intraday & positional targets.

HEROMOTOHeromoto made bullish butterfly pattern on daily charts with very good volumes.
Could be bought with mentioned stoploss & targets.
Also can be bought in calls of next series.

An Intricate BlockA lot of bullishness unfolding here so I will start with the targets and break it down how I got them and why I am so bullish on SQ.
*Initial Target = 138 ; time to target TBD, what I'm looking for is 3 consequtive green candles at the 2 hour level (estimating time to target occurring before the end of April)
**Intermediate Target = 157 by 5/4/2022 - I will explain below
Goal Target is above 166 , but will return to this after the first 2 pts are hit (I can say time to target is after May 4th)
Explaination:
- my analysis displayed begins after the gap on last earnings, notice the 5-count down to fill gap that immediately led into a harmonic resulting in a leading diagonal with wave 1 at 100% retracement of AD... the 5th wave made it to 2.618
- the corrective wave off (5) was a wolfe wave which led into a Butterfly which is yet to materialize... however, the green circle starting April 12th is a Butterfly Fractal - you'll see this if you look at the chart at 5 or 15 minute intervals... I am expecting the next leg up to begin any day now coming off this setup
* Initial target is a 0.618 AD from the "primary" butterfly and a 1.618 from the "secondary" butterfly fractal. In between the current price and the initial pt (138) there is a gap to fill around 134 - this will be a 1.272 AD off the secondary/fractal butterfly (again, not shown but you can find it at the lower intervals). A gap and continue to initial target will set up to continue to intermediate target.
** Intermediate target of 157 is 1.272 AD of primary butterfly (shown). Using the blue trendline from the 1-4 wolfe wave resistance I obtained time to target as the intersection of the 1.272 AD and the 1-4 Wolfe line.. this falls on May 4th but could occur sooner in the right conditions.
I'll revisit this soon but I'm seeing very bullish signals in SQ. Side Note: the yellow trendlines are just longer term trendlines from a while back, left them on there in case they can explain any hold ups or critical levels in price action, probably not important.
Not Financial Advice.

On the Wings of a ButterflyNear term Bitcoin likely to get some wings - Bullish Butterfly with initial target around 41k. Description of chart below:
- yellow zone would complete butterfly harmonic, expect liftoff from there
- green zone is initial 1.618 target range
- red horizontal line is 3 standard dev. under the displacement of the proportional differences between 9 day s.m.a and price vs. 9 day s.m.a and 20 day s.m.a which is acting as a local over-extension to the down side relative to recent peak around 48k
- down-sloping green line is channel support that it recently fell out of - this is the channel that began end of march
- orange horizontal line is an old price support level
Lets see if the momentum from a leg up off this pattern can get it back above that support - if so I can see it continuing to around 50k before the inevitable drop to complete the bigger bullish harmonic at the weekly level.
Not Financial Advice.

BTC/USD: Bullish butterflyBitcoin forming a bullish butterfly harmonic pattern and we see that it's a bullish pattern, and also to take in note we forming a bullish divergence in the RSI forming a lower high in RSI and price action lower low. That it's an indication that the trend will going return bullish.
So guys, in H4 it's look bullish.
Are you agreewith this analysis?

MCXMCX made butterfly pattern on daily chart with decent volumes,,
Could be bought with mentioned stoploss & targets.

mutMuthootfin made bullish butterfly on an hourly charts with decent volumes.
Could be bought with mentioned stoploss & targets.

AUTO/USDAlthough i hate how much of an under performer this asset has been and that it has only ever made lower highs and lower lows
Here you can see momentum is shifting after a textbook Bullish Butterly Harmonic PCZ at the 1.272 fib extension an Inverse Head and Shoulders pattern has matured.
Not something that i would personally long just because of the sheer underperformance of this asset overall but you cant say momentum isnt shifting here and the bottom could be in!
3 targets if you wanted to go long
1st = swing low from 21st july 2021 at $629 (29%)
2nd = swing high from 29th december 2021 at $799 (65%)
3rd = first level of historic resistance at $954 (95%)

SLPHidden bullish divergence and bullish harmonic at 1H TF. We can bounce at 0.0261 and reach 0.0315 and 0.0320. We can also dip lower at the current level which is around 0.0249 but we will still bounce from that level.

HULHUL made bullish butterfly on daily charts & it confirms pattern only above 2117.
Could be bought only above 2117 with mentioned stoplos & targets
