What Is the Hanging Man Candlestick Pattern: Meaning & Trading?What Is the Hanging Man Candlestick Pattern, and How Can You Trade It?
In the world of technical analysis, candlestick patterns play a vital role in helping traders decipher market trends and potential reversals. Among the many setups, the hanging man holds particular significance. This distinctive formation captures traders' attention as it often serves as a warning sign of a possible trend reversal. This article will go through the technical analysis of the hanging man formation and explain how traders can trade with it.
What Is a Hanging Man Pattern?
The hanging man candlestick pattern is characterised by a small body near the top of the candlestick, a long lower shadow, and little to no upper shadow. It resembles a figure hanging from its head, hence the name "Hanging Man."
Psychology Behind the Hanging Man
The psychology behind the hanging man candlestick pattern reflects a shift in market sentiment. After a sustained uptrend, the appearance of this pattern indicates that buyers are losing momentum. The long lower shadow shows that sellers were able to push prices down significantly during the trading session. Although buyers managed to drive prices back up, the close near the open price suggests weakening bullish sentiment. This pattern signals that selling pressure is increasing, potentially leading to a bearish reversal as confidence among buyers diminishes.
The hanging man is a versatile formation that can be applied across a wide range of financial instruments, including stocks, cryptocurrencies*, ETFs, indices, and forex, on different timeframes.
Identifying a Hanging Man Candlestick on Trading Charts
To spot a hanging man pattern in stocks and other financial instruments, you may follow these key steps:
Look for an existing uptrend: Start by identifying a prevailing upward price movement on the chart.
Locate a candlestick with specific characteristics: Search for a candlestick with a small body near the top, a long lower shadow, and little to no upper shadow. This formation resembles a figure hanging from its head. The colour of the candle doesn’t matter, but if it’s bearish, the signal is stronger.
Consider supporting indicators: Utilise other technical indicators or oscillators to further validate the potential reversal. These can include trendlines, moving averages, or momentum indicators that align with the bearish interpretation.
Note that there is no such thing as an inverted hanging man candlestick or a bullish hanging man candlestick pattern.
Trading the Hanging Man Pattern
Those trading the hanging man reversal pattern need to apply a systematic approach in order to increase the likelihood of successful trades. Here are a few steps traders usually follow to trade this pattern:
- Identification: Identify the setup by using the steps mentioned above.
- Look for confirmation signals: The setup alone is not sufficient for making trading decisions. Seek additional confirmation through subsequent candlestick patterns or technical indicators. This can include bearish candlestick patterns (e.g. bearish engulfing or shooting star), a breach of support levels, or the convergence of other indicators signalling a potential reversal.
- Define your entry point: An entry point can be either when the next candlestick confirms the bearish sentiment or when the price breaches a significant support level.
- Consider risk management: Assess the risk-reward ratio of the trade and ensure it aligns with your risk tolerance. For efficient risk management, you may adjust your position size accordingly. Risk management tools like position sizing, setting stop-loss orders, and diversification may help protect your capital. You may set a stop-loss order above the hanging man pattern to limit potential losses if the trade goes against you.
- Identify profit targets: The candlestick itself doesn't provide specific targets. Traders can identify profit targets by looking at previous support levels, Fibonacci retracement levels, or other technical analysis tools like moving averages or pivot points.
- Monitor the trade: Keep a close eye on your position as it progresses. Pay attention to any changes in market conditions or additional signals that may invalidate the trade.
- Learn from outcomes: Regardless of the outcome of the trade, analyse it afterwards to identify areas for improvement. Assess whether the setup provided accurate signals and identify any factors that may have affected its success. This analysis will help refine your trading strategy over time.
Live Market Example
Consider the example of a hanging man on the forex USDJPY pair. An entry is placed on the next bearish candlestick with a stop loss just above the hanging man. The take profit order is at the next level of support marked by the orange line.
Limitations of the Hanging Man Candlestick
The hanging man candlestick pattern, while useful, has certain limitations that traders need to consider:
- False Signals: The hanging man can produce false signals, especially in volatile markets where price movements are erratic.
- Market Context: The effectiveness of the pattern varies depending on the broader market context and prevailing trends.
- Timeframe Sensitivity: Its reliability can differ across various timeframes; what works on a daily chart may not be as effective on an intraday chart.
- Not Standalone: It should not be used in isolation but as part of a comprehensive trading strategy that includes other indicators and risk management tools.
Comparing the Hanging Man to Similar Candles
Understanding how the hanging man pattern differs from similar candlestick patterns helps in accurate technical analysis. Here's a brief comparison of the hanging man with related patterns.
What Is the Difference Between a Hanging Man and a Hammer?
Both have the same candle structure. However, the hanging man candlestick occurs in an uptrend and signals a potential bearish reversal, while the hammer occurs in a downtrend, indicating a potential bullish reversal. Interestingly, it is possible to see a hanging man candlestick in a downtrend, often as part of a bullish retracement. Both candles require confirmation from subsequent price movements. They should be analysed within the context of the overall market trend and other technical indicators.
What Is the Difference Between a Pin Bar and a Hanging Man?
A pin bar and a hanging man are both single-candlestick patterns with small bodies and long shadows, but they serve different purposes in technical analysis. The pin bar has a small body and a long tail, indicating a reversal, but it can appear in any market condition. Its long tail shows a strong rejection of a certain price level, with the body pointing in the direction of the anticipated reversal.
The hanging man, however, specifically occurs after an uptrend and signals a potential bearish reversal, characterised by a small body at the top and a long lower shadow, indicating selling pressure.
What Is the Difference Between a Shooting Star and a Hanging Man Candlestick?
The shooting star and the hanging man are both bearish reversal patterns, but they differ in their appearance and context. A shooting star occurs after an uptrend and features a small body at the bottom with a long upper shadow, indicating that the price was pushed up significantly but fell back down, showing strong selling pressure.
The hanging man also appears after an uptrend but has a small body at the top with a long lower shadow, suggesting that sellers dominated the session despite an initial push by buyers. Both require confirmation from subsequent candlesticks to validate the reversal.
Final Thoughts
While the hanging man alone is insufficient for making trading decisions, it serves as a warning signal that buyers may be losing control and that selling pressure could increase. Traders seek additional confirmation through subsequent candlestick patterns, support and resistance levels, and other technical indicators to validate the potential reversal.
By understanding the implications of the setup within the broader market context and employing proper risk management strategies, traders can enhance their decision-making process and improve their chances of identifying different trading opportunities.
FAQ
What Does the Hanging Man Pattern Indicate?
The hanging man trading pattern in technical analysis typically indicates a potential trend reversal in an uptrend. It suggests that the buyers, who have been driving the market higher, are losing control, and the selling pressure may increase.
The hanging man is represented by a small body near the top of the candlestick, a long lower shadow, and little to no upper shadow. It resembles a figure hanging by the neck. This visual representation conveys the potential bearish sentiment.
Can a Hanging Man Candle Be Bullish?
No, there is no such thing as a bullish hanging man candlestick pattern. The bearish hanging man pattern indicates a potential trend reversal from an uptrend to a downtrend.
Is the Hanging Man Pattern Reliable?
The reliability of the formation, like any candlestick pattern, can vary depending on several factors. While the setup is widely recognised and considered a potential bearish reversal signal, it should not be relied upon as the sole basis for trading decisions. It is crucial to consider other factors and confirmation signals to increase its reliability.
What Is the Confirmation Candle for the Hanging Man?
A confirmation candle for the hanging man is a bearish candlestick that follows the pattern, confirming the reversal. This can include a bearish engulfing candle or a candlestick closing well below the hanging man's body, indicating increased selling pressure.
Is the Hanging Man Pattern Bearish?
Yes, it is generally considered a bearish pattern in technical analysis. It is formed when the price’s open or close is near or at its high, there is a significant decline during the trading session, and it closes not far from the opening price. The pattern resembles a hanging man with his legs dangling.
*Important: At FXOpen UK, Cryptocurrency trading via CFDs is only available to our Professional clients. They are not available for trading by Retail clients. To find out more information about how this may affect you, please get in touch with our team.
This article represents the opinion of the Companies operating under the FXOpen brand only. It is not to be construed as an offer, solicitation, or recommendation with respect to products and services provided by the Companies operating under the FXOpen brand, nor is it to be considered financial advice.
Bullishcandlestick

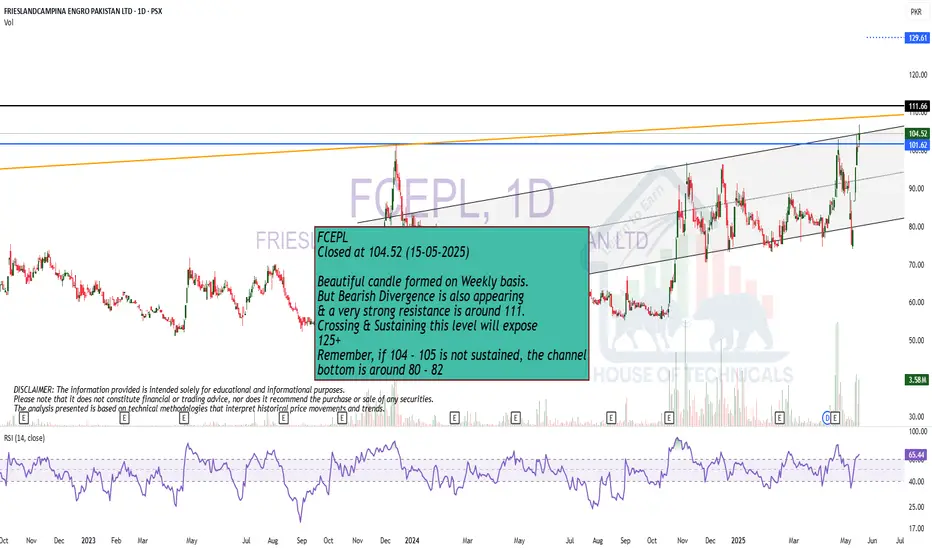
Beautiful candle but Bearish Divergence is also there..
Beautiful candle formed on Weekly basis.
But Bearish Divergence is also appearing
& a very strong resistance is around 111.
Crossing & Sustaining this level will expose
125+
Remember, if 104 - 105 is not sustained, the channel
bottom is around 80 - 82
a Very Strong Weekly Bullish Candle; but
a Very Strong Weekly Bullish Candle; but
there is a Resistance around 240 - 245.
Crossing this level may hit 290+
On the flip side,
though Channel Support s around 165 - 170 but
we also have a Strong Support around 190.

Play on LevelsImmediate Resistance is around 360 - 361
Weekly Closing above this level would be
a +ve sign & may move the price towards 385 - 387

Wait for a Proper Support!Wait for some Bullish Candles to appear at Support level with Good Volumes.

Morning StarBeautiful Morning Star formation on Weekly basis.
Immediate Resistance is around 33 & then 36.
It should not Break 26.50 now otherwise, we may
witness More Selling Pressure.

BUY CUB cmp 144.50, target min 166 then 180/200 SL- 129CUB correction is completed both price-wise and time-wise. From this month it has strong potential upside with minimum target of 166 around, then 180 and 200 levels. 2nd target of 180 and 3rd target 200 can come in next month or next to next month but 166 is almost confirmed. This view will fail if it close on or below 130 levels. so the risk is very less from current levels and the rewards are very high with short term time frame. Fundamentally, the fair value of the stock near to 175-180 levels going with earnings of fy25-26 and with fy24, its still stand to value near 155-160 levels so there is a tremendous potential in value unlocking. NIMs of the bank likely to improve given the interest rate downtrend to start and the cost of borrowing will reduce resulting in improvement of margins. NPAs recovery is already going since last 3-4 quarters and it has reduced. Credit growth is expected to grow given the digitalisation in approval process, ties up with NBFC and expanding to new areas of credit growth. Branches increased last year, however still concentrated in TamilNadu, so any improvement in that state directly impacts cub. Recently the key person in higher management has changed with strong banking experience in big banks and mid size bank as well. Expect the strong turnaround for cub in coming quarters, so 200 is just the levels but it wont be surprising even it cross new lifetime highs when numbers are out. Multiple brokerage house knew this and gave a buy call, it is just a matter of time that Investor's patience soon going to be rewarded. Good luck.

BEL TRADING IDEASTOCK TAKING SUPPORT ON RISING TREND LINE MAKING HIGHER LOW WITH HAMMER CANDLESTICK PATTERN ON DAILY AND WEEKLY CHART DIVIDEND ANNOUNCEMENT DATE IS 24TH MARCH RSI 43
Entry and SL available on chart Risk Reward ratio is1:47
educational purpose only!

SPX and NQ - are we there already?I am cautiously optimistic that the the correction that started since mid July could be finally over and we could begin to see more ups rather than downs going into the final 2 months of this year.
SPX did come very close to its H&S target while NQ was 4% shy of its H&S "target" (close enough though!) before we had a bullish reversal this week.
One could still argue that this could just yet another "sucker's rally" (aka bull trap) that we have seen numerous times in the past 3.5 months.
However, there are a few factors that gave hope for medium term bullish bias this time:
1. A pretty bullish (large body with almost no wicks) weekly reversal candle, though still in the making for this week
2. Both SPX's and NDX's Weekly RSI could be breaking out of their downward trendline, which often could be an "early" signal of strength in the coming weeks.
Non-technical aspects:
3. More earnings announced this week have been beating market expectations and their stocks are now bouncing off a lower base.
4. Fed announcing a pause in in interest rate hike yesterday.
That said, we still need to see the indices breaking above their strong trendline resistences (shown in Red) for a confirmation that the "correction" could be over, plus there is always a chance that the trend going forward could remain sluggish despite no longer "bearish".
Let's see!
Disclaimer:
This is just my own analysis and opinion for discussion and is NOT a trade advice. Kindly do your own due diligence and trade according to your own risk tolerance and don't forget that money management (ie trailing stop loss and position sizing) is (probably the most) important!
Take care and Good Luck!

INDIGO BREAKOUT TRADING IDEAAs we can see after a 4-month breakout with a bullish candlestick pattern
RSI 64.26 towards an upward direction
HV 26
let's retrace as per shown on the chart whereas, on 15 min chart, you'll see a shooting star and an evening star which indicates slide retracement
so plan accordingly.
enty and exit levels
2080
sl 2020 to 2000 (2.80%)
taget 2230 (8%)
RR 2.70%
educational purpose only!

Candlestick Patterns - Part3Hanging Man (Bullish Reversal Pattern)
----------------------------------------
The Hanging Man is a bearish candlestick pattern that appears during an uptrend. It has a small body near the top of the trading range, a short upper shadow, and a long lower shadow. It suggests a potential trend reversal, indicating that buyers may be losing control and sellers could take over. Confirmation from subsequent price action is usually needed before taking any trading decisions based on this pattern.
Candlestick Patterns - Bearish Reversal Patterns - Hanging Man
Key components and characteristics
The Hanging Man pattern consists of a single candlestick with the following characteristics:
1. Body: The Hanging Man candlestick has a small body, typically bearish (black or red), representing a narrow range between the opening and closing prices. The body may also be bullish (white or green) but is less common. The small body indicates indecision or a slight preference towards bearishness.
2. Lower shadow/wick: The Hanging Man has a long lower shadow, also known as the tail or wick, extending below the body. The length of the lower shadow should be at least twice the size of the body. This shadow represents the low price reached during the trading period.
3. Upper shadow/wick: The Hanging Man has little to no upper shadow. If present, it is usually very short compared to the lower shadow. This indicates that bulls attempted to push the price higher but failed, signaling potential weakness.
Shooting Star (Bullish Reversal Pattern)
----------------------------------------
The Shooting Star is a candlestick pattern commonly found in technical analysis of financial markets. It is formed when the open, high, and close prices are relatively close to each other, but the high is significantly above the open and close. This creates a candlestick with a small body and a long upper shadow or wick.
The Shooting Star pattern suggests a potential reversal of an uptrend, indicating that buyers may be losing control and sellers are becoming more active. It is often seen as a bearish signal, especially when it appears after a price rally. Traders interpret this pattern as a sign that the market may be overextended and could experience a downward correction or trend reversal.
The significance of the Shooting Star pattern is strengthened when it occurs near key resistance levels or when it is accompanied by other technical indicators or patterns that confirm the bearish sentiment. Traders typically look for confirmation in subsequent price action before making trading decisions based on this pattern.
Candlestick Patterns - Bearish Reversal Patterns - Shooting Star
Key components and characteristics
The Shooting Start candlestick pattern consists of a single candlestick with the following characteristics:
1. Body: The Shooting Star has a small body, indicating that the opening and closing prices are close to each other.
2. Lower shadow/wick: The Shooting Star typically has little to no lower shadow, or if present, it is very short compared to the upper shadow.
3. Upper shadow/wick: The defining characteristic of a Shooting Star is its long upper shadow or wick, which extends above the body. This shadow represents the high price reached during the trading period.
Gravestone Doji (Bullish Reversal Pattern)
------------------------------------------
The Gravestone Doji is a candlestick pattern in technical analysis used to analyze financial markets, particularly in trading stocks or other securities. It is formed when the open, high, and close prices of a trading period are all at or near the low of the period, creating a long upper shadow or wick. The pattern resembles a gravestone, hence its name.
Candlestick Patterns - Bearish Reversal Patterns - Gravestone Doji
Key components and characteristics
The Gravestone Doji candlestick pattern consists of a single candlestick with the following characteristics:
1. Body: In a Gravestone Doji Doji, the opening price, closing price, and high price of the trading session are all at the same level. This creates a small body at the bottom of the candlestick.
2. Lower shadow/wick: The lower shadow, which represents the price range between the opening price and the low of the period, is either non-existent or very short in the Gravestone Doji pattern.
3. Upper shadow/wick: The upper shadow represents the price range between the high of the period and the closing price. In the Gravestone Doji, this upper shadow is usually long and extends above the opening price.
Bearish Engulfing (Bullish Reversal Pattern)
--------------------------------------------
The Bearish Engulfing candlestick pattern is a two-candle pattern that usually signals a potential reversal of an uptrend. It occurs when a small bullish candle is followed by a larger bearish candle that completely engulfs the previous candle's body. The bearish candle's body represents a strong shift in sentiment from buyers to sellers, as it opens above the previous candle's close and closes below the previous candle's open. This pattern suggests that bears have gained control and may lead to further downward movement in the price. Traders often use it as a signal to consider selling or taking a bearish position in the market.
Candlestick Patterns - Bearish Reversal Patterns - Bearish Engulfing
Key components and characteristics
The Bearish Engulfing candlestick pattern consists of two key components:
1. Bullish candle: The first candle is a bullish (green or white) candlestick, indicating that buyers have been in control. It is typically smaller in size compared to the second candle.
2. Bearish candle: The second candle is a larger bearish (red or black) candlestick. Its body completely engulfs the body of the bullish candle, meaning the high and low of the bearish candle's body completely cover the range of the bullish candle.
Evening Star (Bullish Reversal Pattern)
---------------------------------------
The Evening Star is a bearish candlestick pattern that typically signals a potential reversal of an uptrend. It consists of three candles and is formed at the top of a price rally.
Candlestick Patterns - Bearish Reversal Patterns - Evening Star
Key components and characteristics
The key components and characteristics of an Evening Star candlestick pattern are as follows:
1. First Candle: The pattern starts with a bullish candle that occurs during an uptrend. It represents the continuation of the existing upward momentum. This candle often has a long body and indicates the dominance of buyers.
2. Second Candle: The second candle is a small-bodied candle, often a doji or a spinning top, which reflects indecision in the market. It signifies a potential shift in sentiment as the bulls and bears reach a temporary balance. This candle can be bullish or bearish and serves as a warning sign.
3. Third Candle: The final component is a bearish candle that closes below the midpoint of the first candle. This candle demonstrates that selling pressure has increased, overpowering the previous buying pressure. It confirms the Evening Star pattern and suggests a potential reversal of the uptrend.
Three Black Crows (Bullish Reversal Pattern)
---------------------------------------------
The Three Black Crows is a bearish candlestick pattern that often indicates a potential reversal in an uptrend. It consists of three consecutive long-bodied black (or red) candles with each opening within the body of the previous candle and closing near its low. The pattern suggests that sellers have taken control, driving prices lower over three consecutive trading sessions. It typically signifies a strong shift in market sentiment from bullish to bearish and can be a signal for traders to consider selling or taking profits.
Candlestick Patterns - Bearish Reversal Patterns - Three Black Crows
Key components and characteristics
The key components and characteristics of the Three Black Crows candlestick pattern are as follows:
1. Number of candles: The pattern consists of three consecutive candles.
2. Color: Each candle is typically black or red, indicating a bearish sentiment.
3. Shape: The candles are long-bodied, meaning they have relatively large real bodies compared to their wicks or shadows.
4. Opening and closing: Each candle opens within the real body of the previous candle and closes near its low. This shows sustained selling pressure throughout the trading sessions.
5. Trend reversal: The pattern often occurs after an uptrend, indicating a potential reversal in the market sentiment from bullish to bearish.
6. Volume: Ideally, the pattern is accompanied by increasing trading volume, suggesting strong selling pressure.
7. Confirmation: Traders usually wait for confirmation after spotting the Three Black Crows pattern, such as a further decline in prices or a break below a support level, before considering a bearish trade.
It's worth noting that while the Three Black Crows pattern can indicate a bearish reversal, it's essential to consider other technical indicators, market conditions, and confirmation signals to make well-informed trading decisions.
Cheers & have fun!

Candlestick Patterns - Part2Hammer (Bullish Reversal Pattern)
-----------------------------------
The Hammer is a popular candlestick pattern that provides important information about the potential reversal of a downtrend. It is a single candlestick pattern characterized by a small body located at the top of the trading range with a long lower shadow (also known as the tail or wick). The long shadow represents a rejection of lower prices, indicating potential reversal. The upper shadow, if present, is usually very small or nonexistent. Traders may interpret the Hammer as a signal to go long or buy, considering confirmation and other technical analysis tools.
Candlestick Patterns - Bullish Reversal Patterns - Hammer
Key components and characteristics
The Hammer pattern consists of a single candlestick with the following characteristics:
1. Body: The Hammer candlestick has a small body, which represents a narrow range between the opening and closing prices. The body is typically bullish (white or green) but can also be bearish (black or red). The small body indicates that there is indecision in the market.
2. Lower shadow/wick: The most prominent feature of the Hammer is its long lower shadow, which extends below the body. The length of the lower shadow is generally at least twice the size of the body. This shadow represents the low price reached during the trading period.
3. Upper shadow/wick: The upper shadow, if present, is usually very short or nonexistent. This indicates that the bulls were able to push the price up from the lows, suggesting a potential reversal.
Inverted Hammer (Bullish Reversal Pattern)
---------------------------------------------
The Inverted Hammer is a candlestick pattern that typically forms at the bottom of a downtrend and suggests a potential reversal in the price of an asset. It consists of a small body located near the bottom of the candle, with a long upper shadow and little to no lower shadow.
The pattern indicates that sellers initially dominated the market, pushing the price lower. However, buyers stepped in, driving the price back up, resulting in the long upper shadow. The small body indicates indecision between buyers and sellers, with a slight bias towards buyers. The lack of a lower shadow suggests that buyers were able to maintain control without much resistance.
Traders interpret the Inverted Hammer as a signal that the bearish pressure may be weakening, and a bullish reversal might occur. Confirmation of the reversal typically comes with a subsequent bullish candle or a break above the high of the Inverted Hammer. Traders often look for other technical indicators or patterns to strengthen their analysis before making trading decisions based on the Inverted Hammer pattern.
Candlestick Patterns - Bullish Reversal Patterns - Inverted Hammer
Key components and characteristics
The Inverted Hammer candlestick pattern consists of a single candlestick with the following characteristics:
1. Body: The pattern has a small real body near the bottom of the candlestick. The body represents the price range between the opening and closing prices.
2. Lower shadow/wick: The Inverted Hammer typically has little to no lower shadow. The absence of a lower shadow suggests that the low price for the period is near the bottom of the candlestick body.
3. Upper shadow/wick: The Inverted Hammer has a long upper shadow, which extends above the small body. This upper shadow represents the high price reached during the trading period.
Dragonfly Doji (Bullish Reversal Pattern)
-----------------------------------------
The Dragonfly Doji is a candlestick pattern that forms when the opening price, closing price, and high price of a trading session are all equal. This pattern typically occurs at the bottom of a downtrend and suggests a potential reversal in the price direction.
Candlestick Patterns - Bullish Reversal Patterns - Dragonfly Doji
Key components and characteristics
The Dragonfly Doji candlestick pattern consists of a single candlestick with the following characteristics:
1. Body: In a Dragonfly Doji, the opening price, closing price, and high price of the trading session are all at the same level. This creates a small body at the top of the candlestick.
2. Lower shadow/wick: The candlestick has a long lower shadow, which indicates that the price fell significantly during the session but was ultimately pushed back up by buyers. The length of the lower shadow is typically at least twice the length of the body.
3. Upper shadow/wick: Unlike other candlestick patterns, the Dragonfly Doji does not have an upper shadow. This means that the high price of the session was the same as the opening and closing prices.
Bullish Engulfing (Bullish Reversal Pattern)
--------------------------------------------
The Bullish Engulfing candlestick pattern is a bullish reversal pattern that typically occurs at the end of a downtrend. It consists of two candles, a smaller bearish candle followed by a larger bullish candle. The body of the bullish candle completely engulfs the body of the bearish candle, indicating a shift in market sentiment from bearish to bullish.
Candlestick Patterns - Bullish Reversal Patterns - Bullish Engulfing
Key components and characteristics
The bullush engulfing candlestick pattern consists of two key components:
1. Bearish candle: The first candle is a bearish (red or black) candlestick, indicating that sellers have been in control. It is typically smaller in size compared to the second candle.
2. Bullish candle: The second candle is a larger bullish (green or white) candlestick. Its body completely engulfs the body of the bearish candle, meaning the high and low of the bullish candle's body completely cover the range of the bearish candle.
Morning Star (Bullish Reversal Pattern)
----------------------------------------
The Morning Star is a bullish candlestick pattern typically found on price charts. It consists of three candles and is considered a reliable indicator of a potential trend reversal from a downtrend to an uptrend.
Candlestick Patterns - Bullish Reversal Patterns - Morning Star
Key components and characteristics
The key components and characteristics of a Morning Star candlestick pattern are as follows:
1. First Candle: The first candle in the pattern is a long bearish (red or black) candlestick. It signifies a strong selling pressure and suggests that bears are in control of the market.
2. Second Candle: The second candle is a small-bodied candle that can be either bullish or bearish. It forms a gap down from the previous candle, indicating indecision or a weakening of the selling pressure.
3. Third Candle: The third candle is a long bullish (green or white) candlestick that gaps up from the second candle. It confirms the reversal as buying pressure overtakes the selling pressure. This candle suggests that bulls are gaining control and a trend reversal may be imminent.
Three White Soldiers (Bullish Reversal Pattern)
------------------------------------------------
The Three White Soldiers is a bullish candlestick pattern that often signals a reversal of a downtrend and the beginning of an uptrend. It consists of three consecutive long-bodied bullish candles with small or nonexistent wicks or shadows. Each candle opens within the previous candle's body and closes higher than the previous candle's close. The pattern indicates increasing buying pressure and suggests a strong shift in market sentiment toward the bulls. Traders often interpret this pattern as a sign of potential upward momentum and look for opportunities to enter long positions.
Candlestick Patterns - Bullish Reversal Patterns - Three White Soldiers
Key components and characteristics
The key components and characteristics of the Three White Soldiers candlestick pattern are as follows:
1. Three consecutive candles: The pattern consists of three consecutive bullish (upward) candles.
2. Long-bodied candles: Each candle in the pattern should have a relatively long body, indicating strong buying pressure. The longer the bodies, the more significant the pattern.
3. Absence of or small wicks/shadows: The candles should have minimal or no upper or lower wicks, suggesting that the buying pressure was sustained throughout the entire trading session without significant pullbacks.
4. Opening within the previous candle's body: Each candle should open within the body of the previous candle, showing a continuation of the buying pressure from one candle to the next.
5. Closing higher than the previous close: The closing price of each candle should be higher than the previous candle's close, signifying a steady rise in prices and a bullish sentiment.
6. Reversal signal: The Three White Soldiers pattern typically appears after a period of downtrend, indicating a potential reversal and the start of an uptrend.
7. Volume confirmation: Higher trading volume during the formation of the pattern adds strength to the interpretation and suggests increased buying activity.
These components collectively suggest a strong shift in market sentiment from bearish to bullish, often prompting traders to anticipate further upward movement and potential buying opportunities.
To be continued.
Cheers & have fun!

Candlestick Patterns - Part1Candlestick Components
Candlestick components refer to the various elements that make up a candlestick chart, a popular tool used in technical analysis to analyze price movements in financial markets. Each candlestick represents a specific time period, such as a day, week, or hour, and provides valuable information about the price action during that period.
There are four main components of a candlestick:
1. Open: Is the opening price of the time period. It indicates the first traded price during that period.
2. Close: Is the closing price of the time period. It indicates the last traded price during that period.
3. High: Is the highest price reached during the time period is represented by the upper shadow or wick of the candlestick. It extends vertically from the top of the candle body to the high point.
4. Low: Is the lowest price reached during the time period is represented by the lower shadow or wick of the candlestick. It extends vertically from the bottom of the candle body to the low point.
The body of the candlestick is the rectangular area between the open and close prices. It is filled or colored differently to indicate whether the closing price was higher (bullish) or lower (bearish) than the opening price.
How To Read a Candlestick
Reading a candlestick involves analyzing its components and patterns to gain insights into price movements and potential market trends. Here's a step-by-step guide on how to read a candlestick:
1. Identify the trend: Start by determining the overall trend of the market, whether it's bullish (upward) or bearish (downward). This can be done by looking at the sequence of candlesticks and their general direction.
2. Understand the candlestick components: Examine the individual candlestick's open, close, high, and low prices. The open and close prices determine the body of the candlestick, while the high and low prices define the upper and lower shadows.
3. Interpret the candlestick color: Candlesticks are typically colored differently to represent bullish and bearish movements. A green or white candlestick usually indicates a bullish or positive movement, where the close price is higher than the open price. Conversely, a red or black candlestick represents a bearish or negative movement, where the close price is lower than the open price.
4. Analyze the size of the body and shadows: The size of the body and shadows can provide additional information. A long body suggests a significant price movement during the time period, while a short body indicates a relatively small price change. Longer shadows indicate greater price volatility, while shorter shadows suggest price stability.
5. Look for candlestick patterns: Candlestick patterns are specific formations created by multiple candlesticks. They can provide valuable insights into potential reversals, continuations, or indecision in the market. Examples of common candlestick patterns include doji, hammer, engulfing, and shooting star.
6. Consider the volume: Volume is an essential factor to analyze alongside candlestick patterns. Higher volume during specific candlestick formations can confirm the strength of a trend or signal potential market reversals.
7. Combine with other technical indicators: To strengthen your analysis, consider using other technical indicators like moving averages, trendlines, or oscillators. These indicators can provide further confirmation or additional insights into market conditions.
Remember that reading candlesticks is not a foolproof method, and it's crucial to consider multiple factors and employ risk management strategies when making trading or investment decisions. Additionally, learning and practicing candlestick analysis takes time and experience to develop proficiency.
To be continued.
Cheers & have fun!

📊10 Candlestick Patterns You need To Know🔷 Bullish engulfing:
A candlestick pattern where a smaller bearish candle is followed by a larger bullish candle, indicating a potential reversal of a downtrend.
🔷 Bearish engulfing:
The opposite of a bullish engulfing pattern, where a smaller bullish candle is followed by a larger bearish candle, suggesting a potential reversal of an uptrend.
🔷Tweezer tops:
Two consecutive candlesticks with equal or near-equal high prices, indicating possible resistance and a potential reversal from an uptrend.
🔷Tweezer bottoms:
Similar to tweezer tops, but indicates support and a potential reversal from a downtrend.
🔷Bullish harami:
A bullish harami is a candlestick chart indicator used for spotting reversals in a bear trend. It is generally indicated by a small increase in price (signified by a white candle) that can be contained within the given equity's downward price movement (signified by black candles) from the past couple of days.
🔷Morning star:
A three-candle pattern consisting of a bearish candle, a small indecisive candle, and a bullish candle, indicating a potential reversal from a downtrend.
🔷Evening star:
The opposite of a morning star pattern, consisting of a bullish candle, a small indecisive candle, and a bearish candle, suggesting a potential reversal from an uptrend.
🔷Three white soldiers:
Three consecutive long bullish candles, typically seen as a strong bullish reversal pattern.
🔷Three black crows:
Three consecutive long bearish candles, often considered a bearish reversal pattern.
🔷Three inside up :
A bullish reversal pattern composed of a large down candle, a smaller up candle contained within the prior candle, and then another up candle that closes above the close of the second candle.
👤 @AlgoBuddy
📅 Daily Ideas about market update, psychology & indicators
❤️ If you appreciate our work, please like, comment and follow ❤️


My Trading Plan #Long #GBPUSDMy Trading Plan #Long #GBPUSD
Disclaimer: Trading is risky and trade on your own risk.
My Trading Plan;
Long GU: 1.23500
Stop loss: 1.23390
Target: 1.23986 (48 Pips)

🔎 A Look Inside The Candlestick Chart📍What Is a Candlestick?
The formation of the candle is essentially a plot of price over a period of time. For this reason, a one minute candle is a plot of the price fluctuation during a single minute of the trading day. The actual candle is just a visual record of that price action and all of the trading executions that occurred in one minute.
[b📍Who Discovered the Idea of Candlestick Patterns?
It is commonly believed that candlestick charts were invented by a Japanese rice futures trader from the 18th century. His name was Munehisa Honma.
Honma traded on the Dojima Rice Exchange of Osaka, considered to be the first formal futures exchange in history.
As the father of candlestick charting, Honma recognized the impact of human emotion on markets. Thus, he devised a system of charting that gave him an edge in understanding the ebb and flow of these emotions and their effect on rice future prices.
📉Bearish Candle
🔹 Open Price: A bearish candlestick forms when the opening price of a currency pair is higher than the closing price of the previous candlestick.
🔹 High and Low Price: During the candlestick's time frame, the price moves higher than the opening price and then declines to form a lower low than the previous candlestick.
🔹 Body: The body of the bearish candlestick is colored red and represents the difference between the opening and closing price. The longer the body of the candlestick, the stronger the bearish sentiment.
🔹 Upper Shadow: The upper shadow of the candlestick represents the highest price achieved during the candlestick's time frame. The longer the upper shadow, the greater the bearish pressure.
🔹 Lower Shadow: The lower shadow of the candlestick represents the lowest price achieved during the candlestick's time frame. The shorter the lower shadow, the stronger the bearish sentiment.
📈Bullish Candle
🔹 Open Price: A bullish candlestick forms when the opening price of a currency pair is lower than the closing price of the previous candlestick.
🔹 High and Low Price: During the candlestick's time frame, the price moves lower than the opening price and then rises to form a higher high than the previous candlestick.
🔹 Body: The body of the bullish candlestick is colored green and represents the difference between the opening and closing price. The longer the body of the candlestick, the stronger the bullish sentiment.
🔹 Upper Shadow: The upper shadow of the candlestick represents the highest price achieved during the candlestick's time frame. The shorter the upper shadow, the greater the bullish pressure.
🔹 Lower Shadow: The lower shadow of the candlestick represents the lowest price achieved during the candlestick's time frame. The longer the lower shadow, the greater the bullish sentiment.
👤 @AlgoBuddy
📅 Daily Ideas about market update, psychology & indicators
❤️ If you appreciate our work, please like, comment and follow ❤️

AAVEUSDTAssalamualikum friend AAVEUSDT market is moving side way and market not break resistance.
But over all crypto market is bullish so it will be break their resistance.
reason behind this trade is some bullish candle stick and also in a support area it's time i hope.

GOING LONG IN USDCHFI am taking a long position in USDCHF due to it recently forming a rising wedge pattern now the market is sideways and it nearly retests its support level
By taking a 1:1 risk and reward I have opened a long position as well as it is forming three white soldiers which means bulls are more active than bears
So let's see what happens next

MSFT - Potentially bullish on monthly chartAlthough MSFT is still trading below it's 200 day MA, the bullish candle that is forming on it's monthly chart is now screaming "buy".
To keep risk manageable, long with an initial stop loss slightly below 234 (confluence of it's 20day moving average and also the 38.2% fib retracement level of its' recent AB upswing).
If and when the trade goes out way, trail stops upwards.
There are several ways to place our stops depending one's risk tolerance:
1. place a stop loss just slightly below the 20day moving average (smaller losses but also smaller profits as trade could get whip sawed out prematurely)
2. place a stop loss slightly below it's 50 day moving average (to catch a larger move but potentially giving back more profits at the end)
3. wait for a pivot (higher low) to form on the daily chart and place the stop loss just below this new pivot
Trading is not just about entry but also about risk management. Multiple smaller losses but several large profits is enough for one to be a (potentially very) profitable trader.
p/s if stopped out, look for entry again only when MSFT is at least trading above both it's 20day and 50 day MA. Plus some other compelling signals that might be present.
Disclaimer: Just my 2 cents and not a trade advice. Kindly do your own due diligence and trade according to your own risk tolerance and don't forget that money management is important! Take care and Good Luck!

GOING LONG IN LINKUSDTI am taking a long position in LINKUSDT because at a higher low it creates a bullish hammer after red candles as well as it tests its 0.236 fib level
Let's see what happens next

Week08 - USDRUB | Reversal PatternBullish Head and Shoulders is forming on currency pair USDRUB, target points are defined with the stoploss.

KncHellow traders,
Here’s a quickie for you.
Please see chart for details and always do your own research.
Savvy
