EURCAD Short Term Buy IdeaH1 - Bullish convergence.
Currently it looks like a pullback is happening.
Bullish hidden divergence.
Until the strong support zone holds my short term view remains bullish here. A valid breakout above the most recent downtrend line would be the validation for this bullish view.
Bullishconvergence

AUDCAD - Looking To Buy Pullbacks In The Short TermH4 - Price is bouncing higher from a key support zone.
Bullish convergence.
H1 - Bullish trend pattern.
Currently it looks like a correction is happening
Until the two strong support zones hold my short term view remains bullish here.

EURAUD - Looking To Buy Pullbacks In the Short TermD1 - Bullish convergence.
No opposite signs.
Expecting short term bullish moves to happen here.
H4 - Higher highs.
Currently it looks like a pullback is happening.
Until the key support zone holds my short term view remains bullish here.

AUDUSD Short Term Buy IdeaD1 - Higher highs.
Price has currently reached a strong support zone.
Bullish hidden divergence.
H1 - Bullish convergence.
Until the strong support zone holds my short term view remains bullish here.

Bullish Convergence on MACD and Hidden Bullish Divergence on RSIFTT has reacted to the PCZ of a Bullish Gartley on the Weekly and has since begun to develop Weekly Hidden Bullish Divergence on the RSI and tail end Weekly Bullish Convergence on the MACD that could take it up to the levels of $94-$100

Oil - Looking To Buy Pullbacks In The Short TermH1 - Price is bouncing higher from a strong support zone.
Bullish convergence.
Until the strong support zone holds I expect the price to move higher further after pullbacks.

AUDUSD Buy IdeaD1 - Bullish convergence.
Currently it looks like a correction is happening.
Expecting the price to continue higher further after this correction.
H4 - Bullish trend pattern followed by a potential double wave correction.
Price is bouncing higher from a key support zone.
A valid breakout above the downtrend line would be the validation for this bullish view.

BTC to Russian Ruble Looking to Pump Over 40%We have an Ascending Triangle here on the weekly Timeframe and we are looking to target the 1.618 extension which would be the AB=CD BAMM Target from here upon breaking 500k. We are also showing Bullish Convergence on the MACD and Hidden Bullish Divergence on the RSI above the Breakout Point of the pattern.

Litecoin Short Term Buy IdeaD1 - Price has reached a key support zone.
Multiple bullish divergence.
H1 - Bullish convergence.
Currently it looks like a pullback is happening.
Until the strong support zone holds I expect the price to move higher further in the short term after pullbacks.

NZDCHF - Looking To Buy PullbacksD1 - Price is bouncing higher from a key support zone.
Bullish convergence.
Expecting the price to continue higher further.
H4 - Bullish trend pattern.
Higher highs.
Currently it looks like a correction is happening.
Until the two strong support zones hold my view remains bullish here.

GBPCHF Short Term Buy And Mid Term Sell IdeaD1 - Price is bouncing lower from a strong resistance zone.
Lower lows.
Expecting the price to continue lower further after corrections.
H1 - Bullish convergence.
Currently it looks like a pullback is happening.
Potential bullish hidden divergence.
My short term view is bullish and my mid term view is bearish here.

CADJPY Short Term Buy IdeaD1 - Higher highs.
Bullish hidden divergence.
After the first leg to the upside currently it looks like a correction is happening.
Expecting the price to continue higher further after this correction.
H4 - Bullish convergence.
Until the key support zone holds I expect the price to move higher further in the short term.

EURGBP - Looking To Buy PullbacksD1 - Bullish divergence
Higher highs.
Price has respected a strong support zone and is bouncing higher.
H1 - Bullish convergence.
Currently it looks like a pullback is happening.
Until the strong support zone holds I expect the price to move higher further in the short term.

EURCHF - Looking To Buy PullbacksD1 - Price is bouncing higher from 1.03 psychological level.
Bullish convergence.
Currently it looks like a pullback is happening.
H4 - Higher highs.
No opposite signs.
Until both the strong support zone holds my view remains bullish here.

CHFJPY - Looking To Buy PullbacksH4 - Price is bouncing higher from a key support zone.
Bullish divergence.
Downtrend line breakout.
H1 - Bullish convergence.
Currently it looks like a pullback is happening.
Until the key support zone holds I expect the price to continue higher further after pullbacks.

GBPCHF - Looking To Buy PullbacksD1 - Bullish convergence.
Currently it looks like a pullback is happening.
Expecting the price to continue higher further after pullbacks.
H4 - Bullish hidden divergence.
Until the two key support zones hold my view remains bullish here.

AUDJPY Short Term Buy IdeaH4 - Bullish convergence.
Currently it looks like a correction is happening.
Bullish hidden divergence.
H1 - Price is currently moving inside a range.
Until both the key support zone holds my short term view remains bullish here.

GBPCHF Intraday Buy IdeaD1 - Price has reached a key support zone.
Bullish divergence.
H4 - Bullish convergence.
Until the key support zone holds my short term view remains bullish here.

GBPAUD Intraday Buy IdeaD1 - Price has reached a strong support zone.
Bullish divergence.
Engulfing candle pattern.
Expecting short term bullish moves to happen here.
H1 - Bullish convergence.
Currently it looks like a pullback is happening.
Until the strong support zone holds I expect the price to move higher further after pullbacks.

NZDCHF Buy IdeaD1 - Price has broken above the top of the range.
Bullish convergence.
Currently it looks like a pullback is happening.
H4 - Price has reached the first key support zone.
Bullish divergence.
Until both these key support zones hold my view remains bullish here.

Ethereum Intraday Buy IdeaH4 - After the first move to the upside currently it looks like a correction is happening in the form of a range.
Basically, I expect the price to move higher further after this correction.
H1 - Price is bouncing higher from a key support zone.
Bullish convergence.
Expecting further continuation higher after pullbacks.

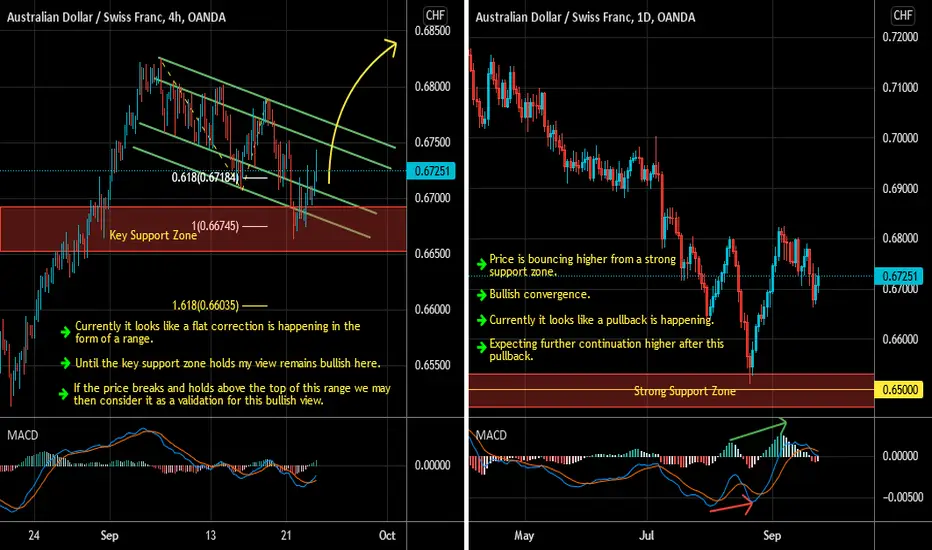
AUDCHF Intraday Buy IdeaD1 - Price is bouncing higher from a strong support zone.
Bullish convergence.
Currently it looks like a pullback is happening.
Expecting further continuation higher after this pullback.
H4 - Currently it looks like a flat correction is happening in the form of a range.
Until the key support zone holds my view remains bullish here.
If the price breaks and holds above the top of this range we may then consider it as a validation for this bullish view.
EURGBP Buy Idea After Bullish ConvergenceD1 - Price is bouncing higher from a strong support zone where the psychological 0.85 level coincides.
Bullish divergence.
No opposite signs.
H4 - Bullish trend pattern followed by a correction.
Bullish convergence.
Until both the strong support zones hold my view remains bullish here.
