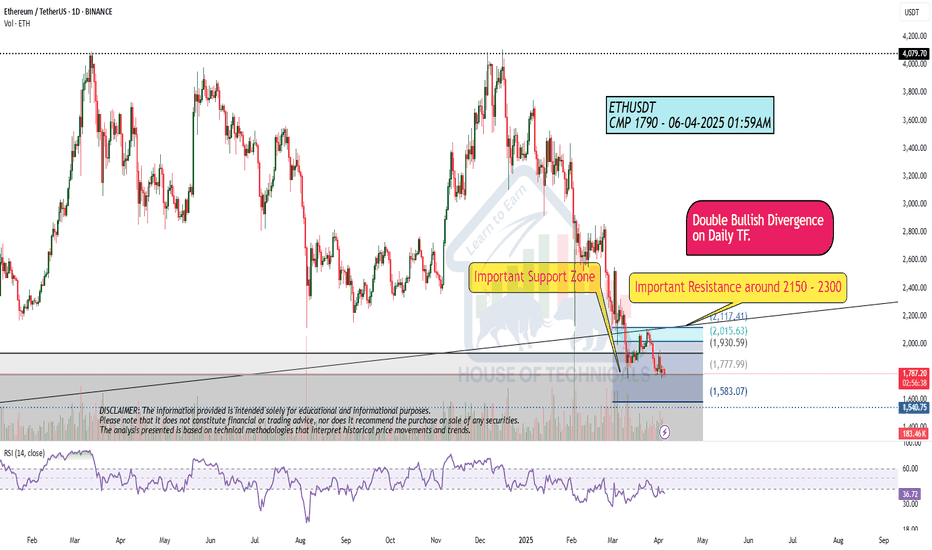
Bullish Divergence
Nvidia : Learning from the pastNASDAQ:NVDA
Looking at the past is easy, but learning from it is easier.
Let's get listed the points.
1. Breakout of trendline on 24Jan23, that started
on 19Nov21, confirmed on 29Mar22;
2. Bullish divergence started in Sep22 and
confirmed in mid Oct22;
3. No lower low after 13Oct22;
4. Breakout of previous lower high of 13Dec22 on
24Jan23 (which happened to be breakout
of Trendline as well.
Polyplex Corp: Analyzing Wave (5) Projection and SupportTechnical Analysis of Polyplex Corporation Ltd.
Elliott Wave Counts and Structure
The chart illustrates a possible Elliott Wave count on a weekly time frame, identifying key waves and corrective patterns. Here’s a detailed breakdown:
1. Primary Wave Structure:
- The chart shows an unfolding five-wave impulsive structure, with Waves (1) through (4) completed, indicating a bullish phase followed by corrective waves.
- Wave (1) is observed in November 2010, and Wave (2) is identified around September 2013.
- Wave (3) peaks significantly higher than Wave (1), indicating a strong bullish phase, and completes near April 2022.
- Waves 1, 2, 3, 4, and 5 within Wave (3) are clearly marked, showing the internal structure of this impulsive wave.
2. Corrective Waves:
- After the peak of Wave (3), the chart illustrates a complex corrective pattern labeled as W-X-Y-X-Z.
- This correction appears to end at Wave (4), indicating the start of a new potential impulsive wave (Wave (5)).
- The corrective waves show significant price declines, characteristic of Elliott Wave corrections.
3. Current Scenario and Target:
- The current price action suggests the initiation of Wave (5).
- The target for Wave (5) is projected to be above the high of Wave (3), which is near 2880 INR.
- An upward arrow indicates the bullish outlook, projecting the price towards this target level.
4. Invalidation Level:
- An invalidation level is marked at 751. If the price falls below this level, the current Elliott Wave count and bullish scenario would be invalidated.
- This level acts as a critical support, below which the wave count may need to be re-evaluated.
Summary and Considerations
- Bullish Outlook: The primary analysis suggests a bullish wave (Wave (5)) is underway, targeting levels above the previous high of 2880.
- Key Support: The invalidation level at 751 is crucial for maintaining the bullish scenario.
- Risks: As noted in the disclaimer, Elliott Wave Theory involves multiple possibilities and inherent risks. It's important to consider this analysis as one potential scenario.
Investors and traders should consult with financial advisors and consider broader market conditions, as well as other technical indicators, before making investment decisions based on this analysis.
This analysis provides an educational perspective on using Elliott Wave Theory for Polyplex Corporation Ltd. and highlights the importance of monitoring critical price levels to validate the wave counts.
I am not Sebi registered analyst.
My studies are for educational purpose only.
Please Consult your financial advisor before trading or investing.
I am not responsible for any kinds of your profits and your losses.
Most investors treat trading as a hobby because they have a full-time job doing something else.
However, If you treat trading like a business, it will pay you like a business.
If you treat like a hobby, hobbies don't pay, they cost you...!
Hope this post is helpful to community
Thanks
RK💕
Disclaimer and Risk Warning.
The analysis and discussion provided on in.tradingview.com is intended for educational purposes only and should not be relied upon for trading decisions. RK_Charts is not an investment adviser and the information provided here should not be taken as professional investment advice. Before buying or selling any investments, securities, or precious metals, it is recommended that you conduct your own due diligence. RK_Charts does not share in your profits and will not take responsibility for any losses you may incur. So Please Consult your financial advisor before trading or investing.
Elliott Wave (3) Awakening: Laxmi Organic Industries Ltd.Laxmi Organic Industries Ltd. has completed wave (1) in blue Intermediate degree on the weekly chart from its inception till the peak in September 2021. Wave (2) has completed at the bottom in June 2024. We are now possibly starting to unfold wave (3) in blue Intermediate degree on the weekly chart, which is generally a strong impulse wave.
Wave (3) Characteristics and Strength:
- Strong Impulse: Wave (3) is typically the most powerful and extended wave in the Elliott Wave cycle, characterized by strong price movements and high trading volumes.
- Fibonacci Extension Target: The ideal target for wave (3) is the 161.8% extension of wave (1). Using the Trend-based Fibonacci Extension tool, this projects a price target near 1000.
- Subdivisions: Wave (3) is expected to subdivide into five smaller waves (minor degree), each representing a smaller impulse move within the larger wave.
Current Price Action:
- Current Price: 265
- Key Levels:
- Invalidation Level: 220 (last swing low)
- Breakout Confirmation: 277 (a break and close above this level will confirm the start of wave (3))
Technical Indicators:
- Bullish Divergence: At the bottom in June 2024, double bullish divergence was observed, signaling potential reversal.
- Dow Theory Confirmation: We are waiting for the first higher high and higher low formation to confirm the bullish impulse. This pattern will strengthen the case for wave (3) initiation.
Risk-Reward Ratio:
- Risk: Very low, with the stop-loss set at the invalidation level of 220.
- Reward: Potentially huge, with a target of 1000 or more, aligning with the 161.8% Fibonacci extension of wave (1).
- Risk-Reward Ratio: Excellent, considering the low risk and high reward potential.
Trading Strategy:
- Entry Point: Consider entering a position now while the price is at 265, with a stop-loss at 220.
- Confirmation Entry: A more conservative entry can be made once the price breaks and closes above 277.
Conclusion:
Laxmi Organic Industries Ltd. appears to be in the early stages of wave (3) in blue Intermediate degree. Given the characteristics of wave (3) and the current technical setup, this presents an attractive trading opportunity with a favorable risk-reward ratio. Monitoring the price action for a break above 277 will provide further confirmation of the bullish impulse wave.
I am not Sebi registered analyst. My studies are for educational purpose only.
Please Consult your financial advisor before trading or investing.
I am not responsible for any kinds of your profits and your losses.
Most investors treat trading as a hobby because they have a full-time job doing something else.
However, If you treat trading like a business, it will pay you like a business.
If you treat like a hobby, hobbies don't pay, they cost you...!
Hope this post is helpful to community
Thanks
RK💕
Disclaimer and Risk Warning.
The analysis and discussion provided on in.tradingview.com is intended for educational purposes only and should not be relied upon for trading decisions. RK_Charts is not an investment adviser and the information provided here should not be taken as professional investment advice. Before buying or selling any investments, securities, or precious metals, it is recommended that you conduct your own due diligence. RK_Charts does not share in your profits and will not take responsibility for any losses you may incur. So Please Consult your financial advisor before trading or investing.
NOTHING !!Hi.
BINANCE:NOTUSDT
🔵We have a Bullish Structure here
NOTUSDT formed a falling wedge on 2h timeframe🤔
Up we go if we do breakout ,also a bullish Divergence (RD+) on MACD which shows Positive Signs for NOTCOIN.
✅ Due to the Ascending structure of the chart...
🟢 High potential areas are clear in the chart.
🟢 Bullish Wedge.
🟢Bullish Regular Divergence(+RD)
Stay awesome my friends.
_ _ _ _ _ _ _ _ _ _ _ _ _ _ _ _ _ _ _ _ _ _ _ _ _ _ _ _ _ _ _ _ _
✅Thank you, and for more ideas, hit ❤️Like❤️ and 🌟Follow🌟!
⚠️Things can change...
The markets are always changing and even with all these signals, the market changes tend to be strong and fast!!
Marathon Digital Holdings (MARA): Bullish Divergence SignalsMarathon Digital Holdings is heavily influenced by developments in the cryptocurrency market. Despite this dependency, significant indicators on the RSI chart show repeated divergences. These divergences have previously resulted in substantial price movements and could potentially do so again. Currently, we have identified a bullish divergence on the daily chart, with the stock holding above the High-Volume-Node (HVN) Edge within a trend channel. These correlations suggest there could be enough momentum for the stock to retest the $34 level, which we consider a minimum target.
Marathon's stock is known for its rapid movements, meaning it can quickly move up or down. Should the stock move upwards, it could swiftly surpass the $34 mark. However, we must also consider the presence of equal lows on the chart. These equal lows are often a point of concern as they indicate significant liquidity below them, which the market tends to target. Therefore, it is possible that we might see a dip to collect this liquidity in the coming days, weeks, or even months, potentially bringing the price back to the trendline.
In the worst-case scenario, the stock might drop to the High-Volume-Node Point of Control at $9.67 before resuming its upward trajectory. Despite this risk, we believe that Marathon has substantial upside potential in the coming weeks. The confluence of bullish signals and strong support levels suggests that the stock could see significant gains if the bullish divergence plays out as expected.
BLOCK (SQ): Major Buy Zones Identified Amid Potential Upswing!BLOCK (formerly Square) has experienced a significant sell-off since its all-time high of $290 in July 2021, dropping to a low of $37. This marked the completion of Wave 2 in its price cycle. Currently, we are observing two critical zones:
Must-Buy Zone : Between $33 and $51. Historically, the price has spent minimal but crucial time in this range, indicating strong market movement always follows a dip into this zone.
Okay-Buy Zone : Between $51 and $87. This broader range also saw significant accumulation periods, specifically from May 2018 to March 2020, and again from May 2022 to the present.
BLOCK's price dipped to the Must-Buy Zone recently but quickly reclaimed higher levels, suggesting a potential upswing. Additionally, a clear bullish divergence on the RSI (3-day chart) indicates a possible new momentum phase.
Potential Scenarios:
Retest and Reclaim : On the 12-hour chart, a retest of the high-volume nodes and Points of Control (POC) on the daily and 3-day charts might occur. If BLOCK retests these levels successfully, it could signify a sustained upward movement.
Dip and Buy Opportunity : Should the price fall below these POCs, another dip into the Must-Buy Zone could present an excellent long-term buying opportunity, especially if the RSI indicates oversold conditions aligning with these price points.
Given the bullish divergence on the RSI and historical support levels, there is a strong case for a potential upward movement. However, the risk of a further dip remains, making it crucial to monitor these levels closely for a strategic entry point.
Oatly Whats likely, More Price Decline or Bottom reached?Hi Guys. This is a Technical Analysis Update on Oatly, (OTLY). On the 1 Week Timeframe.
We are in a critical area for OTLY.
We have continued our DECLINE from the REJECTION area
With last weeks candle close, We have CLOSED BELOW the "MAJOR SUPPORT" Area.
This candle close isn't enough information to assess what comes next. The next week or the next couple weeks we need CONFIRMATION.
So its important to observe what happens next.
So couple of scenarios can occur:
1. We confirm back ABOVE the MAJOR SUPPORT line. Leading to the formation of a DOUBLE BOTTOM pattern. This would confirm our bottom for OTLY, and we start to move back up to Resistance levels.
2. We CONFIRM our break BELOW the MAJOR SUPPORT.
Leading to not only ALL TIME LOWS, but the potential for the DESCENDING Triangle to play out.
If thats the case, we can go as LOW as $0.40 cents.
But without data points, its hard to assess if we do go down that far or stop before.
Notice also the "Bullish Divergence Trendline" on Price action. This line coincides with our "Measured Target".
Could be an area where we bounce from and be a potential Bottom area.
3. Ideal scenario would be we come down a bit lower from the Major SUPPORT Line and start our way back up ABOVE "Major Support". This would form a "Head" and play into a potential bottoming pattern, the Inverse Head & Shoulders pattern. The First green circle indicating our 1st bottom of potential double bottom, would be our left shoulder.
Watch also the RSI. We are nearing a Support test on the "Bullish DIVERGENCE" trendline. We want this to stay as support. We don't want a break and confirmation BELOW the RED dashed line. It could negate our Bullish Divergence Trend.
The STOCH RSI is also something to watch. We have traveled BELOW the 20 level. Extended stay below here, would indicate further Price DECLINES. We would like to see a BUllish cross back ABOVE 20 level for Bullish Momentum to come in and push prices back up. If we do get a cross, then Double bottom is likely.
We need to stay level headed as OTLY bottoms out. Take it one step at a time with an objective mindset.
__________________________________________________________________________________
Thank you for taking the time to read my analysis. Hope it helped keep you informed. Please do support my ideas by boosting, following me and commenting. Thanks again.
Stay tuned for more updates on OTLY in the near future.
If you have any questions, do reach out. Thank you again.
DISCLAIMER: This is not financial advice, i am not a financial advisor. The thoughts expressed in the posts are my opinion and for educational purposes. Do not use my ideas for the basis of your trading strategy, make sure to work out your own strategy and when trading always spend majority of your time on risk management strategy.
GOLD BREAKOUT - TREND BREAK AND RETESTLooking for Gold to breakout of the downward trend with a break and retest of the $2298.5 level before continuing higher.
I am looking for entries on the 5min and 15min timeframes.
I believe this is a short term bullish move before the bigger overall bearish retracement on the higher timeframes.
PERPUSDT: Bullish Engulfing at 200 Moving Average and SupportPERP has Bullishly Engulfed above a major Support/Resistance Level and looks to be forming a Double Bottom of sorts with Bullish Divergence on the MACD. If it plays out we could very well see higher highs and may actually see a macro Bullish Breakout of an even bigger pattern of higher lows and higher highs on the Weekly, but for the time being I'd just want it to try to recover the range highs of the daily Double Bottom.
MSM: Holding Above 200 Moving Average In Support ZoneMSM looks to be Triple Bottoming with Triple Bullish Divergence on the MACD above a Congestion Zone and has also formed a Bullish Deep Gartley Visible on the Daily and 4 Hour Timeframes. If it holds we could see the period of consolidation break upwards and given the industrial nature of this stock and how other industrials have performed after experiencing similar retraces towards support, we would likely see a move towards the ATHs, after that we would then aim for the Fibonacci Extensions which could hopefully even take us to the 1.618 near 150 Dollars.
I Cannot SHORT This !!!Hi.
➡️ the odds of another bullish Movement is Pretty high because the pattern which SHIB is in, Is a Bullish wedge Pattern! Since The break out has not happened, there is no confirmation of a Bullish Movement But If It happens....
✅ Due to the Ascending structure of the chart...
🟢 The odds of another Bullish Movement is High!
🟢 Bullish wedge is Visible on The chart!
🟢 REEGULAR BULLISH Divergence
🟢 No break out yet!
🟢 FALLING WEDGE
✨Targets are:
🎯$0.00002969
🎯$0.00003280
🎯$0.00003660
🎯$0.00003930
❗ Note that if the WEDGE is broken down with the power of descending candles, our analysis will fail.
Stay awesome my friends.
_ _ _ _ _ _ _ _ _ _ _ _ _ _ _ _ _ _ _ _ _ _ _ _ _ _ _ _ _ _ _ _ _
✅Thank you, and for more ideas, hit ❤️Like❤️ and 🌟Follow🌟!
⚠️Things can change...
The markets are always changing and even with all these signals, the market changes tend to be strong and fast!!
AUDCHF - 1H - Long PositionIn this chart we have observed a Bearish Continuation pattern making LH & LL . But there is Bullish Divergence spotted which give us the signal of potential reversal towards bullish trend. So we have placed entry point above the LH level as it breaks we take an entry and we put SL & TP accordingly.
NZDCHF - 1H - Long PositionIn this chart we have observed a Bearish Continuation pattern making LH & LL . But there is Bullish Divergence spotted which give us the signal of potential reversal towards bullish trend. So we have placed entry point above the LH level as it breaks we take an entry and we put SL & TP accordingly.
NZDUSD - 1H - Long PositionIn this chart we have observed a Bearish Continuation pattern making LH & LL . But there is Bullish Divergence spotted which give us the signal of potential reversal towards bullish trend. So we have placed entry point above the LH level as it breaks we take an entry and we put SL & TP accordingly.
EURUSD - 1H - Long PositionIn this chart we have observed a Bearish Continuation pattern making LH & LL . But there is Bullish Divergence spotted which give us the signal of potential reversal towards bullish trend. So we have placed entry point above the LH level as it breaks we take an entry and we put SL & TP accordingly.
AUDUSD - 1H - Long Positionn this chart we have observed a Bearish Continuation pattern making LH & LL . But there is Bullish Divergence spotted which give us the signal of potential reversal towards bullish trend. So we have placed entry point above the LH level as it breaks we take an entry and we put SL & TP accordingly.
🐳Cardano will Go Up Again🐳Hi.
BINANCE:ADAUSDT
✅Today, I want to analyze ADA for you in a 12h time frame so that we can have a MID-term view of ADA regarding the technical analysis. (Please ✌️respectfully✌️share if you have a different opinion from me or other analysts).
After the fifth bullish wave, Cardano has completed his corrective waves (ABC) and now he has reached the end of the wedge, now it is time to start the five bullish waves .also a bullish Divergence (RD+) on MACD which shows Positive Signs for CARDANO.
✅ Due to the Ascending structure of the chart...
🟢 High potential areas are clear in the chart.
🟢 Bullish Wedge.
🟢 Starting 5th waves.
🟢 Bullish Divergence
❗ Note that if the WEDGE is broken down with the power of descending candles, our analysis will fail.
Stay awesome my friends.
_ _ _ _ _ _ _ _ _ _ _ _ _ _ _ _ _ _ _ _ _ _ _ _ _ _ _ _ _ _ _ _ _
✅Thank you, and for more ideas, hit ❤️Like❤️ and 🌟Follow🌟!
⚠️Things can change...
The markets are always changing and even with all these signals, the market changes tend to be strong and fast!!
AVAX/USD 2h: just a few pips, but there's money on the tableThe AVAX/USD pair exhibits promising signs of an upward trajectory on the 2-hour chart, marked by key technical indicators. Initially, a regular bullish divergence was spotted, a reliable harbinger of potential reversal. This divergence occurs when the price charts lower lows while the RSI (Relative Strength Index), an oscillator measuring the momentum and possible trend reversals, shows higher lows. This discrepancy signals weakening downward momentum, suggesting that buyers are gradually gaining ground.
Complementing this bullish signal, the MACD (Moving Average Convergence Divergence) indicator, a tool used to identify trend direction and momentum, crossed above its signal line prior to the divergence. Currently, the MACD and its signal line are advancing in parallel, reinforcing the bullish momentum .
With these technical indicators in alignment, the price has commenced its upward movement. The immediate profit target is set at the monthly pivot point of $51.51 , serving as the next significant resistance level. Traders should monitor these levels closely, as a sustained move above could further validate the bullish outlook for AVAX/USD.
In conclusion, the convergence of bullish divergence and a favorable MACD configuration offers a compelling case for an impending uptrend. Investors should consider these technical signals in their trading strategy, keeping an eye on the pivotal $51.51 level for potential profit-taking opportunities.
🚧ADAUSDT is Bullish now🚧 & many Traders don't see it 👀!!!Hi.
COINEX:ADAUSDT
✅Today, I want to analyze ADA for you in a 1D time frame so that we can have a MID-term view of ADA regarding the technical analysis. (Please ✌️respectfully✌️share if you have a different opinion from me or other analysts).
After the fifth bullish wave, Cardano has completed his corrective waves (ABC) and now he has reached the end of the wedge, now it is time to start the five bullish waves .also a bullish Divergence (RD+) on MACD which shows Positive Signs for CARDANO.
✅ Due to the Ascending structure of the chart...
🟢 High potential areas are clear in the chart.
🟢 Bullish Wedge.
🟢 Starting 5th waves.
🟢 Bullish Divergence
❗ Note that if the WEDGE is broken down with the power of descending candles, our analysis will fail.
Stay awesome my friends.
_ _ _ _ _ _ _ _ _ _ _ _ _ _ _ _ _ _ _ _ _ _ _ _ _ _ _ _ _ _ _ _ _
✅Thank you, and for more ideas, hit ❤️Like❤️ and 🌟Follow🌟!
⚠️Things can change...
The markets are always changing and even with all these signals, the market changes tend to be strong and fast!!
Unveiling the Power of RSI's Hidden Bullish Divergence.Greetings, friends and speculators.
Let's take a moment to examine the Crypto King's relationship with the 2-month RSI indicator.
The RSI has proven itself as a powerful tool, accurately identifying the exact bottom on three separate occasions.
During the bear market lows of 2015, 2018, and 2022, a hidden bullish divergence emerged, signaling the conclusion of the downtrend and the initiation of a new "Mark Up" Phase.
Interestingly, there has been an approximately 20% increase in the duration between these hidden bullish divergences. If we extrapolate this trend to the current period, we might anticipate a market bottom around July 2027.
However, approach this prediction with caution, past performance does not guarantee future returns.
To confirm a valid Hidden Bullish Divergence, the bulls need to maintain the price above the 2022 lows while ensuring that the RSI makes a lower low.
Apart from indicating market bottoms, the RSI indicator also aids in pinpointing optimal exit points. Notably, RSI levels surpassing 90 historically denoted the conclusion of the bull run.
With the current RSI hovering around the 70 mark, it suggests that the bulls still possess plenty of ammunition as they advance further.
I should note that RSI has made a lower high during the last 2 market tops, one could assume that a lower high in this bull frenzy would fail to penetrate the 90+ level.
If you recall my BTC post from September 2021, I advised bulls to start dollar-cost averaging into positions. At that time, BTC was experiencing an "Accumulation" phase, and it's clear that we've transitioned into a "MarkUp" phase now.
As we approach the final Bitcoin halving, there is no doubt that an interesting time is upon us.
To all those who weathered the brutal bear market, I salute you.
Much Love & Good Luck!
SPECUALTIVE SETUP, DYOR + DD.
What is Hidden Bullish Divergence?
A hidden bullish divergence is a setup where the oscillator forms lower lows at the same time that the price is forming higher lows. This setup is frequently seen in situations where the price has been in consolidation or has performed a pullback from an uptrend.
What is RSI?
The Relative Strength Index, or RSI for short, is one of the most popular technical indicators among the trading community. It belongs to the family of oscillators, or technical tools used to determine overbought or oversold conditions. It’s used to gauge the market sentiment.
Developed by J. Welles Wilder, the RSI measures the speed and change of price movements.
A popular way of reading RSI values is to look for divergences that occur when a new high or a new low of the price isn’t confirmed by the RSI readings.
displays on a vertical range of 0 to 100.
Readings close to 0 are viewed as “oversold”, while those closer to 100 are a sign of “overbought” market conditions. Unlike some other momentum indicators, readings can’t go below 0 or higher than 100.
AUDJPY - 1H - Bearish Flag - Short EntryIn this chart we have observed a Bearish Flag, but we also spotted that there is a Bullish Divergence and candle sticks are making HH & HL which indicate it is a Bullish trend.
There might be a chance of UPTREND, but we are following Bearish FLAG and we have executed entry & exit points accordingly.